Races in Mukilteo, Washington (WA) Detailed Stats
Data:
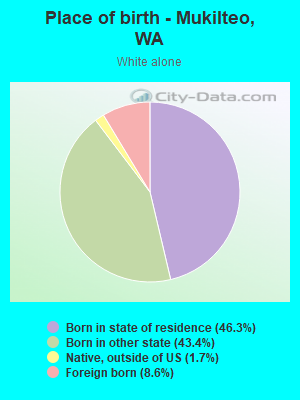
Races - White alone (%)
Races - White alone (% change since 2000)
Races - Black alone (%)
Races - Black alone (% change since 2000)
Races - American Indian alone (%)
Races - American Indian alone (% change since 2000)
Races - Asian alone (%)
Races - Asian alone (% change since 2000)
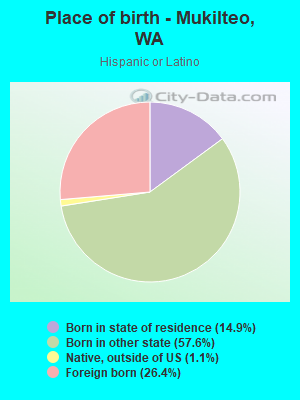
Races - Hispanic (%)
Races - Hispanic (% change since 2000)
Races - Native Hawaiian and Other Pacific Islander alone (%)
Races - Native Hawaiian and Other Pacific Islander alone (% change since 2000)
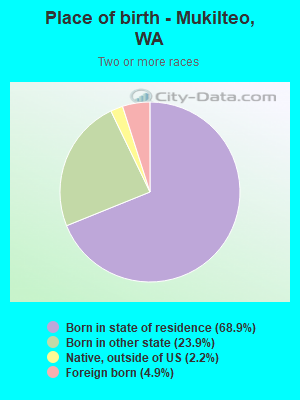
Races - Two or more races(%)
Races - Two or more races(% change since 2000)
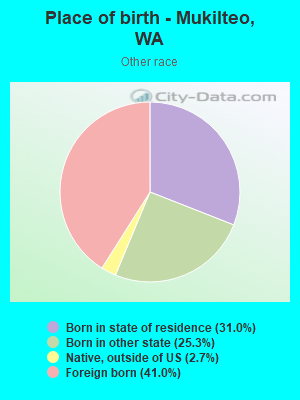
Races - Other race alone (%)
Races - Other race alone (% change since 2000)
Racial diversity
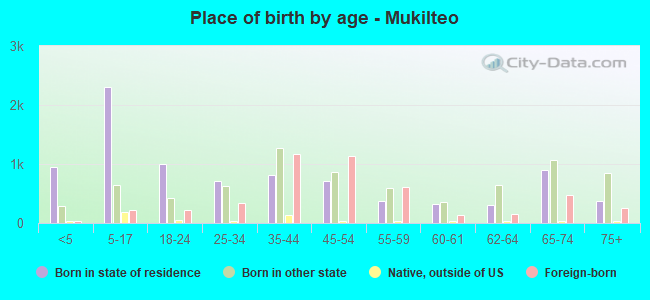
Place of birth - Born in state of residence (%)
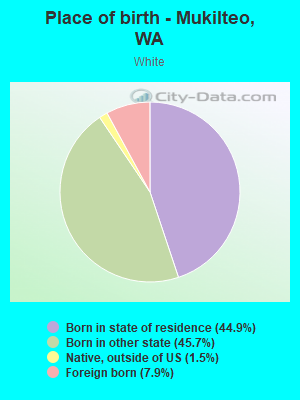
Place of birth - Born in state of residence (%) - White
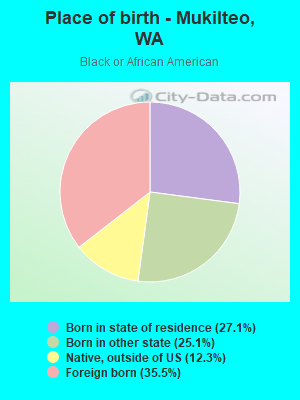
Place of birth - Born in state of residence (%) - Black or African American
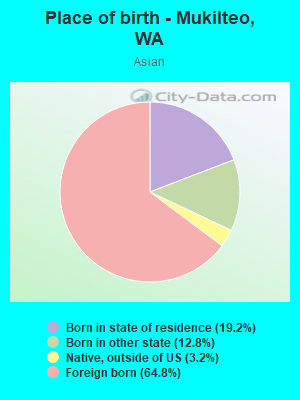
Place of birth - Born in state of residence (%) - Asian
Place of birth - Born in state of residence (%) - Hispanic or Latino
Place of birth - Born in state of residence (%) - American Indian and Alaska Native
Place of birth - Born in state of residence (%) - Multirace
Place of birth - Born in state of residence (%) - Other Race
Place of birth - Born in other state (%)
Place of birth - Born in other state (%) - White
Place of birth - Born in other state (%) - Black or African American
Place of birth - Born in other state (%) - Asian
Place of birth - Born in other state (%) - Hispanic or Latino
Place of birth - Born in other state (%) - American Indian and Alaska Native
Place of birth - Born in other state (%) - Multirace
Place of birth - Born in other state (%) - Other Race
Place of birth - Native, outside of US (%)
Place of birth - Native, outside of US (%) - White
Place of birth - Native, outside of US (%) - Black or African American
Place of birth - Native, outside of US (%) - Asian
Place of birth - Native, outside of US (%) - Hispanic or Latino
Place of birth - Native, outside of US (%) - American Indian and Alaska Native
Place of birth - Native, outside of US (%) - Multirace
Place of birth - Native, outside of US (%) - Other Race
Place of birth - Foreign born (%)
Place of birth - Foreign born (%) - White
Place of birth - Foreign born (%) - Black or African American
Place of birth - Foreign born (%) - Asian
Place of birth - Foreign born (%) - Hispanic or Latino
Place of birth - Foreign born (%) - American Indian and Alaska Native
Place of birth - Foreign born (%) - Multirace
Place of birth - Foreign born (%) - Other Race
Residents speaking English at home (%)
Residents speaking English at home - Born in the United States (%)
Residents speaking English at home - Native, born elsewhere (%)
Residents speaking English at home - Foreign born (%)
Residents speaking Spanish at home (%)
Residents speaking Spanish at home - Born in the United States (%)
Residents speaking Spanish at home - Native, born elsewhere (%)
Residents speaking Spanish at home - Foreign born (%)
Residents speaking other language at home (%)
Residents speaking other language at home - Born in the United States (%)
Residents speaking other language at home - Native, born elsewhere (%)
Residents speaking other language at home - Foreign born (%)
Marital status - Never married (%)
Marital status - Now married (%)
Marital status - Separated (%)
Marital status - Widowed (%)
Marital status - Divorced (%)
Ancestries Reported - Arab (%)
Ancestries Reported - Czech (%)
Ancestries Reported - Danish (%)
Ancestries Reported - Dutch (%)
Ancestries Reported - English (%)
Ancestries Reported - French (%)
Ancestries Reported - French Canadian (%)
Ancestries Reported - German (%)
Ancestries Reported - Greek (%)
Ancestries Reported - Hungarian (%)
Ancestries Reported - Irish (%)
Ancestries Reported - Italian (%)
Ancestries Reported - Lithuanian (%)
Ancestries Reported - Norwegian (%)
Ancestries Reported - Polish (%)
Ancestries Reported - Portuguese (%)
Ancestries Reported - Russian (%)
Ancestries Reported - Scotch-Irish (%)
Ancestries Reported - Scottish (%)
Ancestries Reported - Slovak (%)
Ancestries Reported - Subsaharan African (%)
Ancestries Reported - Swedish (%)
Ancestries Reported - Swiss (%)
Ancestries Reported - Ukrainian (%)
Ancestries Reported - United States (%)
Ancestries Reported - Welsh (%)
Ancestries Reported - West Indian (%)
Ancestries Reported - Other (%)
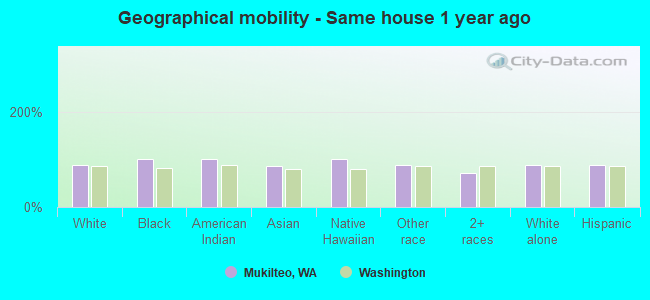
Geographical mobility - Same house 1 year ago (%)
Geographical mobility - Same house 1 year ago (%) - White
Geographical mobility - Same house 1 year ago (%) - Black or African American
Geographical mobility - Same house 1 year ago (%) - Asian
Geographical mobility - Same house 1 year ago (%) - Hispanic or Latino
Geographical mobility - Same house 1 year ago (%) - American Indian and Alaska Native
Geographical mobility - Same house 1 year ago (%) - Multirace
Geographical mobility - Same house 1 year ago (%) - Other Race
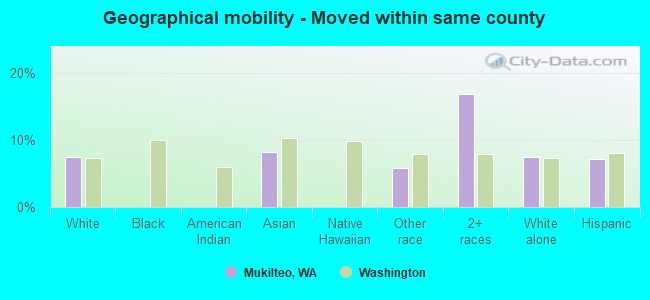
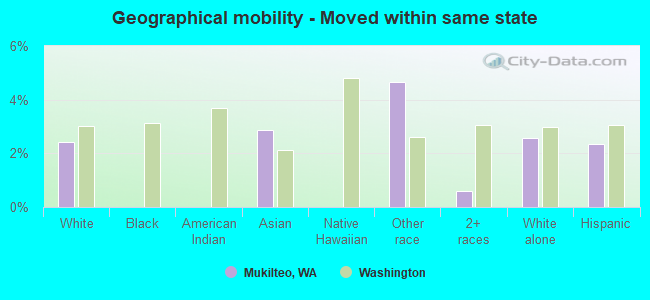
Geographical mobility - Moved within same county (%)
Geographical mobility - Moved within same county (%) - White
Geographical mobility - Moved within same county (%) - Black or African American
Geographical mobility - Moved within same county (%) - Asian
Geographical mobility - Moved within same county (%) - Hispanic or Latino
Geographical mobility - Moved within same county (%) - American Indian and Alaska Native
Geographical mobility - Moved within same county (%) - Multirace
Geographical mobility - Moved within same county (%) - Other Race
Geographical mobility - Moved from different county within same state (%)
Geographical mobility - Moved from different county within same state (%) - White
Geographical mobility - Moved from different county within same state (%) - Black or African American
Geographical mobility - Moved from different county within same state (%) - Asian
Geographical mobility - Moved from different county within same state (%) - Hispanic or Latino
Geographical mobility - Moved from different county within same state (%) - American Indian and Alaska Native
Geographical mobility - Moved from different county within same state (%) - Multirace
Geographical mobility - Moved from different county within same state (%) - Other Race
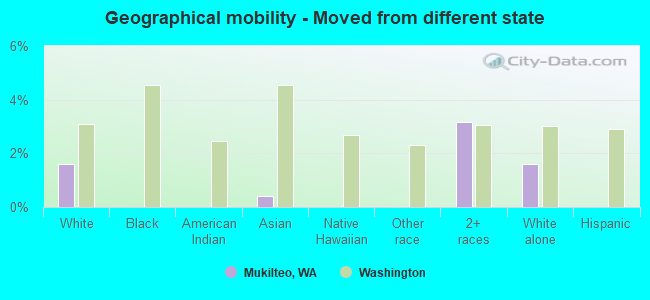
Geographical mobility - Moved from different state (%)
Geographical mobility - Moved from different state (%) - White
Geographical mobility - Moved from different state (%) - Black or African American
Geographical mobility - Moved from different state (%) - Asian
Geographical mobility - Moved from different state (%) - Hispanic or Latino
Geographical mobility - Moved from different state (%) - American Indian and Alaska Native
Geographical mobility - Moved from different state (%) - Multirace
Geographical mobility - Moved from different state (%) - Other Race
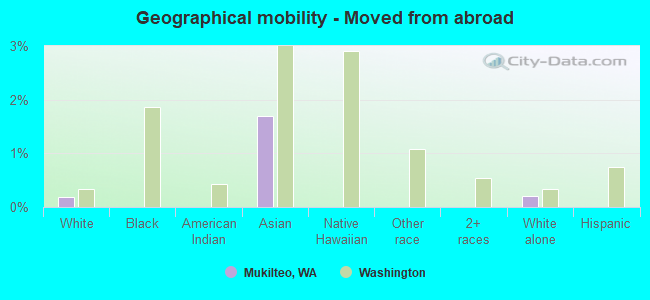
Geographical mobility - Moved from abroad (%)
Geographical mobility - Moved from abroad (%) - White
Geographical mobility - Moved from abroad (%) - Black or African American
Geographical mobility - Moved from abroad (%) - Asian
Geographical mobility - Moved from abroad (%) - Hispanic or Latino
Geographical mobility - Moved from abroad (%) - American Indian and Alaska Native
Geographical mobility - Moved from abroad (%) - Multirace
Geographical mobility - Moved from abroad (%) - Other Race
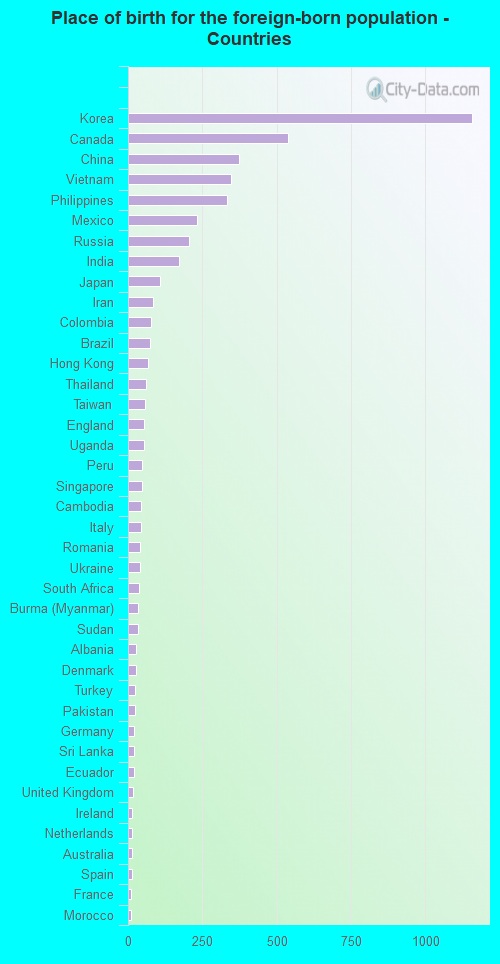
Place of birth for the foreign-born population - Ireland (%)
Place of birth for the foreign-born population - Denmark (%)
Place of birth for the foreign-born population - Norway (%)
Place of birth for the foreign-born population - Sweden (%)
Place of birth for the foreign-born population - United Kingdom (%)
Place of birth for the foreign-born population - England (%)
Place of birth for the foreign-born population - Scotland (%)
Place of birth for the foreign-born population - Other Northern Europe (%)
Place of birth for the foreign-born population - Austria (%)
Place of birth for the foreign-born population - Belgium (%)
Place of birth for the foreign-born population - France (%)
Place of birth for the foreign-born population - Germany (%)
Place of birth for the foreign-born population - Netherlands (%)
Place of birth for the foreign-born population - Switzerland (%)
Place of birth for the foreign-born population - Other Western Europe (%)
Place of birth for the foreign-born population - Greece (%)
Place of birth for the foreign-born population - Italy (%)
Place of birth for the foreign-born population - Portugal (%)
Place of birth for the foreign-born population - Spain (%)
Place of birth for the foreign-born population - Other Southern Europe (%)
Place of birth for the foreign-born population - Albania (%)
Place of birth for the foreign-born population - Belarus (%)
Place of birth for the foreign-born population - Bosnia and Herzegovina (%)
Place of birth for the foreign-born population - Bulgaria (%)
Place of birth for the foreign-born population - Croatia (%)
Place of birth for the foreign-born population - Czechoslovakia (%)
Place of birth for the foreign-born population - Hungary (%)
Place of birth for the foreign-born population - Latvia (%)
Place of birth for the foreign-born population - Lithuania (%)
Place of birth for the foreign-born population - North Macedonia (Macedonia) (%)
Place of birth for the foreign-born population - Moldova (%)
Place of birth for the foreign-born population - Poland (%)
Place of birth for the foreign-born population - Romania (%)
Place of birth for the foreign-born population - Russia (%)
Place of birth for the foreign-born population - Serbia (%)
Place of birth for the foreign-born population - Ukraine (%)
Place of birth for the foreign-born population - Other Eastern Europe (%)
Place of birth for the foreign-born population - China (%)
Place of birth for the foreign-born population - Hong Kong (%)
Place of birth for the foreign-born population - Taiwan (%)
Place of birth for the foreign-born population - Japan (%)
Place of birth for the foreign-born population - Korea (%)
Place of birth for the foreign-born population - Other Eastern Asia (%)
Place of birth for the foreign-born population - Afghanistan (%)
Place of birth for the foreign-born population - Bangladesh (%)
Place of birth for the foreign-born population - India (%)
Place of birth for the foreign-born population - Iran (%)
Place of birth for the foreign-born population - Kazakhstan (%)
Place of birth for the foreign-born population - Nepal (%)
Place of birth for the foreign-born population - Pakistan (%)
Place of birth for the foreign-born population - Sri Lanka (%)
Place of birth for the foreign-born population - Uzbekistan (%)
Place of birth for the foreign-born population - Other South Central Asia (%)
Place of birth for the foreign-born population - Burma (%)
Place of birth for the foreign-born population - Cambodia (%)
Place of birth for the foreign-born population - Indonesia (%)
Place of birth for the foreign-born population - Laos (%)
Place of birth for the foreign-born population - Malaysia (%)
Place of birth for the foreign-born population - Philippines (%)
Place of birth for the foreign-born population - Singapore (%)
Place of birth for the foreign-born population - Thailand (%)
Place of birth for the foreign-born population - Vietnam (%)
Place of birth for the foreign-born population - Other South Eastern Asia (%)
Place of birth for the foreign-born population - Armenia (%)
Place of birth for the foreign-born population - Iraq (%)
Place of birth for the foreign-born population - Israel (%)
Place of birth for the foreign-born population - Jordan (%)
Place of birth for the foreign-born population - Kuwait (%)
Place of birth for the foreign-born population - Lebanon (%)
Place of birth for the foreign-born population - Saudi Arabia (%)
Place of birth for the foreign-born population - Syria (%)
Place of birth for the foreign-born population - Turkey (%)
Place of birth for the foreign-born population - Yemen (%)
Place of birth for the foreign-born population - Other Western Asia (%)
Place of birth for the foreign-born population - Eritrea (%)
Place of birth for the foreign-born population - Ethiopia (%)
Place of birth for the foreign-born population - Kenya (%)
Place of birth for the foreign-born population - Somalia (%)
Place of birth for the foreign-born population - Uganda (%)
Place of birth for the foreign-born population - Zimbabwe (%)
Place of birth for the foreign-born population - Other Eastern Africa (%)
Place of birth for the foreign-born population - Cameroon (%)
Place of birth for the foreign-born population - Congo (%)
Place of birth for the foreign-born population - Democratic Republic of Congo (Zaire) (%)
Place of birth for the foreign-born population - Other Middle Africa (%)
Place of birth for the foreign-born population - Egypt (%)
Place of birth for the foreign-born population - Morocco (%)
Place of birth for the foreign-born population - Sudan (%)
Place of birth for the foreign-born population - Other Northern Africa (%)
Place of birth for the foreign-born population - South Africa (%)
Place of birth for the foreign-born population - Other Southern Africa (%)
Place of birth for the foreign-born population - Cabo Verde (%)
Place of birth for the foreign-born population - Ghana (%)
Place of birth for the foreign-born population - Liberia (%)
Place of birth for the foreign-born population - Nigeria (%)
Place of birth for the foreign-born population - Senegal (%)
Place of birth for the foreign-born population - Sierra Leone (%)
Place of birth for the foreign-born population - Other Western Africa (%)
Place of birth for the foreign-born population - Australia (%)
Place of birth for the foreign-born population - New Zealand (%)
Place of birth for the foreign-born population - Fiji (%)
Place of birth for the foreign-born population - Micronesia (%)
Place of birth for the foreign-born population - Bahamas (%)
Place of birth for the foreign-born population - Barbados (%)
Place of birth for the foreign-born population - Cuba (%)
Place of birth for the foreign-born population - Dominica (%)
Place of birth for the foreign-born population - Dominican Republic (%)
Place of birth for the foreign-born population - Grenada (%)
Place of birth for the foreign-born population - Haiti (%)
Place of birth for the foreign-born population - Jamaica (%)
Place of birth for the foreign-born population - St. Vincent and the Grenadines (%)
Place of birth for the foreign-born population - Trinidad and Tobago (%)
Place of birth for the foreign-born population - West Indies (%)
Place of birth for the foreign-born population - Other Caribbean (%)
Place of birth for the foreign-born population - Belize (%)
Place of birth for the foreign-born population - Costa Rica (%)
Place of birth for the foreign-born population - El Salvador (%)
Place of birth for the foreign-born population - Guatemala (%)
Place of birth for the foreign-born population - Honduras (%)
Place of birth for the foreign-born population - Mexico (%)
Place of birth for the foreign-born population - Nicaragua (%)
Place of birth for the foreign-born population - Panama (%)
Place of birth for the foreign-born population - Other Central America (%)
Place of birth for the foreign-born population - Argentina (%)
Place of birth for the foreign-born population - Bolivia (%)
Place of birth for the foreign-born population - Brazil (%)
Place of birth for the foreign-born population - Chile (%)
Place of birth for the foreign-born population - Colombia (%)
Place of birth for the foreign-born population - Ecuador (%)
Place of birth for the foreign-born population - Guyana (%)
Place of birth for the foreign-born population - Peru (%)
Place of birth for the foreign-born population - Uruguay (%)
Place of birth for the foreign-born population - Venezuela (%)
Place of birth for the foreign-born population - Other South America (%)
Place of birth for the foreign-born population - Canada (%)
Place of birth for the foreign-born population - Other Northern America (%)
Place of birth for the foreign-born population - Other (%)
Latest news about races in Mukilteo, WA collected exclusively by city-data.com from local newspapers, TV, and radio stations
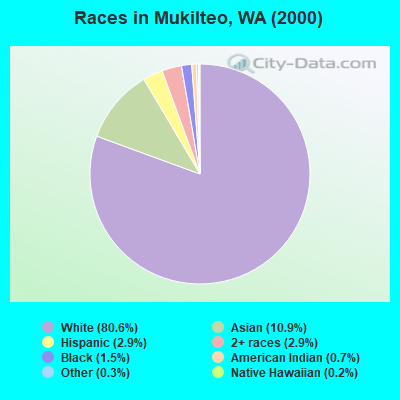
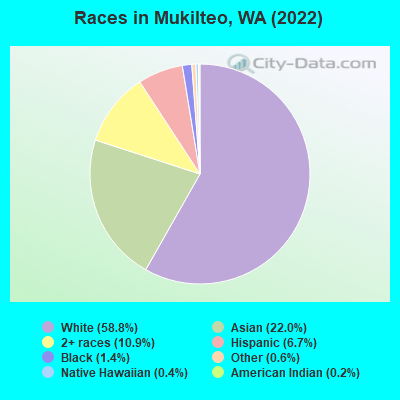
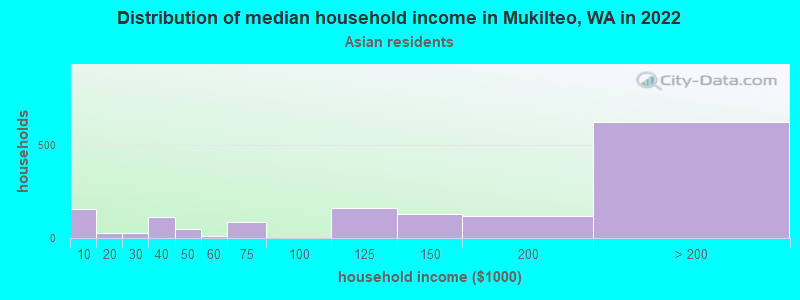
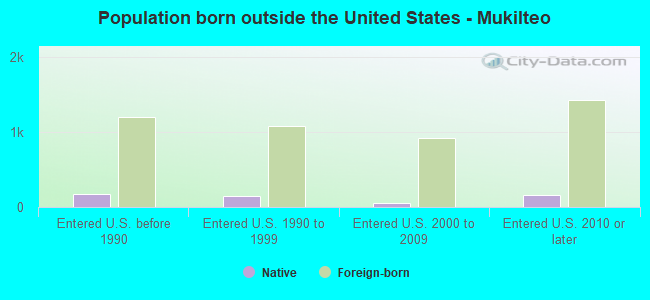
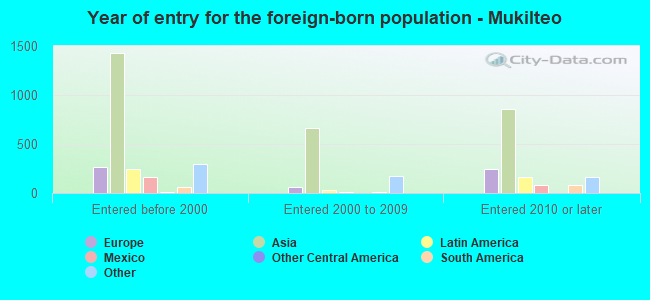
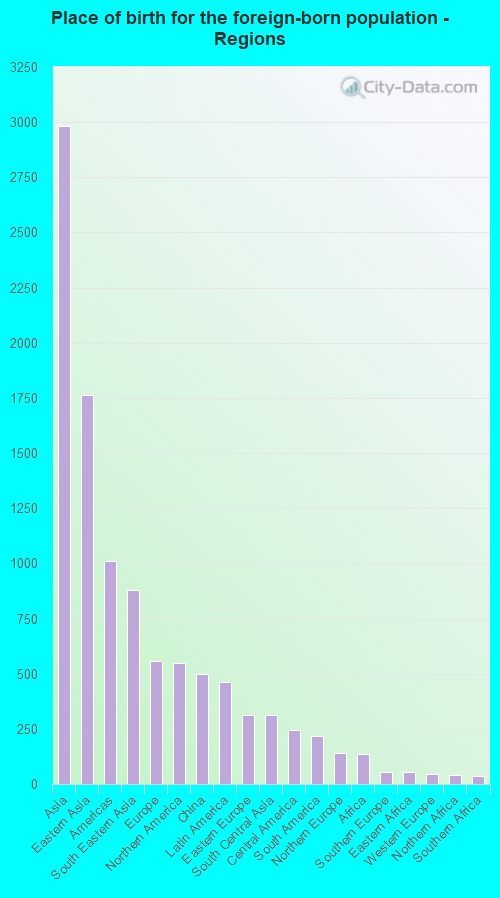
According to 2022 data, the most numerous races in Mukilteo, WA are White alone (12,739 residents), Hispanic (1,445 residents), and Asian alone (4,762 residents). 76.8% of Mukilteo residents speak English at home. 21.7% of Mukilteo, WA residents are foreign-born (13.4% born in Asia, 2.5% born in Europe, 2.5% born in North America), which is 30.9% greater than the foreign-born rate of 15.0% across the entire state of Washington.
Race distribution in Mukilteo
2000 2022
4,652,490 78.9% White alone 441,509 7.5% Hispanic 319,401 5.4% Asian alone 184,631 3.1% Black alone 175,926 3.0% Two or more races 85,396 1.4% American Indian alone 22,779 0.4% Native Hawaiian and Other 11,989 0.2% Other race alone
4,941,456 63.5% White alone 1,093,313 14.0% Hispanic 755,832 9.7% Asian alone 523,448 6.7% Two or more races 299,537 3.8% Black alone 69,024 0.9% American Indian alone 52,231 0.7% Native Hawaiian and Other 50,945 0.7% Other race alone
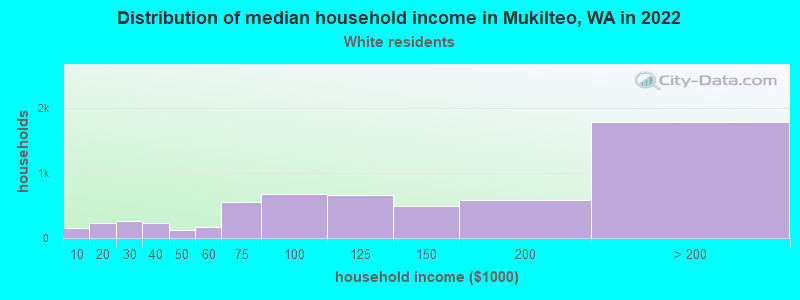
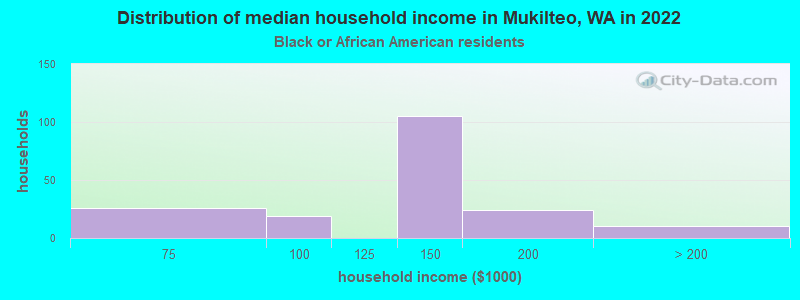
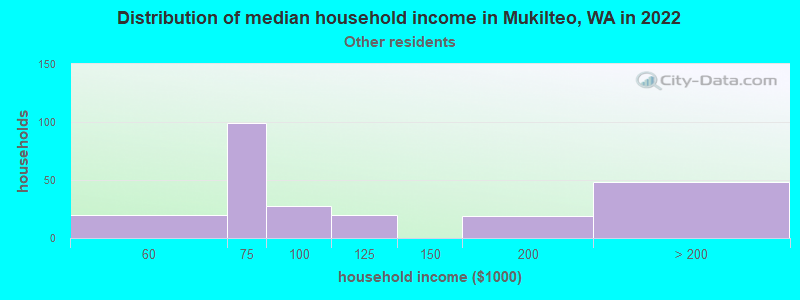
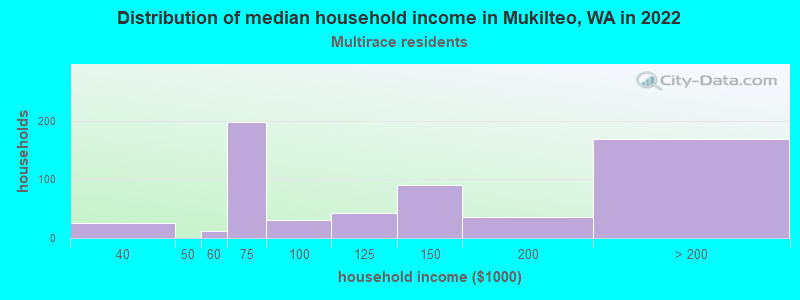
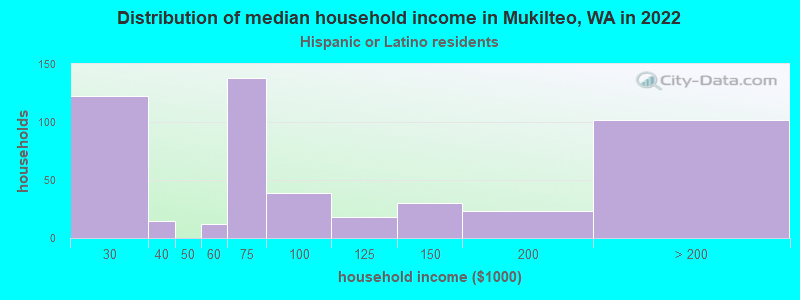
Income and house value in Mukilteo Median household income in 2022 $112,696 White non-Hispanic householders$144,243 Black householders$143,001 Asian householders$78,324 Some other race householders$132,720 Two or more races householders$75,914 Hispanic or Latino race householdersMedian 2022 house value $947,849 White Non-Hispanic householdersover $1,000,000 Black or African American householders$714,100 American Indian or Alaska Native householders $966,952 Asian householders$651,234 Native Hawaiian and other Pacific Islander householdersover $1,000,000 Some other race householders$738,065 Two or more races householders$835,663 Hispanic or Latino householders
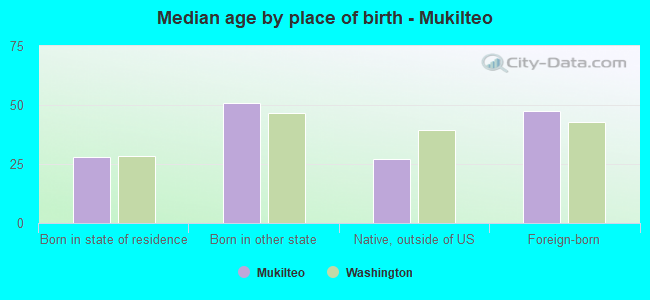
Median age by race in Mukilteo
50.2 Median age for White residents46.5 54.0 41.3 Median age for Black or African American residents34.0 75.2 -644,308,942.4 Median age for American Indian / Alaska Native residents-736,637,511.4 -589,658,965.3 45.0 Median age for Asian residents43.0 45.0 -677,839,850.3 Median age for Native Hawaiian / Pacific Islander residents-661,202,185.1 -844,317,095.6 35.7 Median age for Other race residents36.8 34.9 16.2 Median age for Two or more races residents15.7 16.8 51.1 Median age for White alone residents46.7 54.4 36.2 Median age for Hispanic or Latino residents38.8 28.2
Owner/renter occupied households by race in Mukilteo
House owners and renters - White residents 4,157 69.6% Owner occupied1,813 30.4% Renter occupiedHouse owners and renters - Black or African American residents 24 17.1% Owner occupied116 82.9% Renter occupiedHouse owners and renters - American Indian / Alaska Native residents 26 100.0% Renter occupiedHouse owners and renters - Asian residents 1,241 86.3% Owner occupied197 13.7% Renter occupiedHouse owners and renters - Native Hawaiian / Pacific Islander residents 83 100.0% Renter occupiedHouse owners and renters - Other race residents 102 40.2% Owner occupied152 59.8% Renter occupiedHouse owners and renters - Two or more races residents 366 62.1% Owner occupied223 37.9% Renter occupiedHouse owners and renters - White alone residents 4,103 70.3% Owner occupied1,733 29.7% Renter occupiedHouse owners and renters - Hispanic or Latino residents 203 44.3% Owner occupied255 55.7% Renter occupied
Language usage in Mukilteo
English speakers - Total 76.8% of residents of Mukilteo speak English at home.
3.7% of residents speak Spanish at home 639 84.3% Speak English very well119 15.7% Speak English less than very well19.6% of residents speak other language at home 1,908 47.7% Speak English very well2,096 52.3% Speak English less than very well
English speakers - Born in the United States 89.4% of residents of Mukilteo speak English at home.
4.4% of residents speak Spanish at home 324 100.0% Speak English very well6.0% of residents speak other language at home 253 57.6% Speak English very well186 42.4% Speak English less than very well
English speakers - Native, born elsewhere 91.0% of residents of Mukilteo speak English at home.
3.0% of residents speak Spanish at home 16 100.0% Speak English very well6.8% of residents speak other language at home 36 100.0% Speak English very well
English speakers - Foreign-born 28.9% of residents of Mukilteo speak English at home.
6.4% of residents speak Spanish at home 206 68.4% Speak English very well95 31.6% Speak English less than very well66.2% of residents speak other language at home 1,341 43.0% Speak English very well1,777 57.0% Speak English less than very well
White (Caucasian) - Speak only English Native:
96.5% (11,146)Foreign-born:
58.3% (595)
White (Caucasian) - Speak another language Native:
3.5% (405)Foreign-born:
43.4% (442)
Black or African American - Speak only English Native:
100.0% (187)Foreign-born:
14.6% (16)
Black or African American - Speak another language Native:
10.1% (19)Foreign-born:
76.0% (83)
Asian - Speak only English Native:
63.4% (940)Foreign-born:
14.9% (458)
Asian - Speak another language Native:
36.5% (541)Foreign-born:
85.3% (2,623)
Other race - Speak only English Native:
47.4% (220)Foreign-born:
33.3% (102)
Other race - Speak another language Native:
50.6% (235)Foreign-born:
75.0% (231)
Two or more races - Speak only English Native:
95.9% (1,809)Foreign-born:
34.8% (45)
Two or more races - Speak another language Native:
4.8% (91)Foreign-born:
68.5% (89)
White alone - Speak only English Native:
96.7% (10,980)Foreign-born:
54.2% (586)
White alone - Speak another language Native:
3.3% (371)Foreign-born:
42.8% (462)
Hispanic or Latino - Speak only English Native:
61.0% (487)Foreign-born:
22.0% (83)
Hispanic or Latino - Speak another language Native:
38.7% (309)Foreign-born:
79.0% (298)
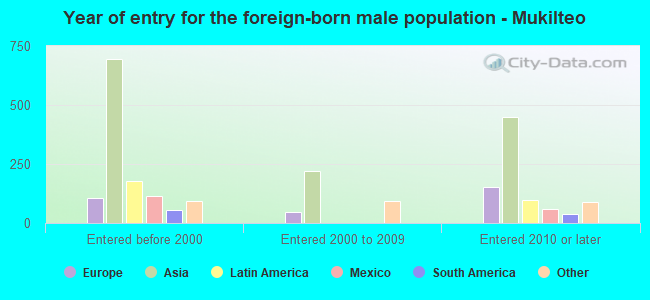
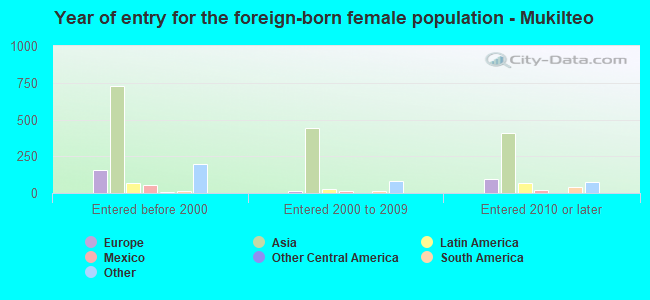
Foreign-born residents in Mukilteo 4,701 residents are foreign born (13.4% Asia , 2.5% Europe , 2.5% North America ).
This city:
21.7%Washington:
14.9%
Marital status for residents in Mukilteo Marital status - White (Caucasian) population 15 years and over
Males 30.3% Never married57.9% Now married0.4% Separated4.0% Widowed7.3% DivorcedFemales 17.9% Never married52.4% Now married2.9% Separated7.2% Widowed19.6% DivorcedWomen who gave birth in the past 12 months Now married:
100.0% (73)Unmarried:
0.0% (0)
Women who did not give birth in the past 12 months Now married:
56.6% (1,235)Unmarried:
43.4% (946)
Marital status - Black or African American population 15 years and over
Males 28.8% Never married71.2% Now married0.0% Separated0.0% Widowed0.0% DivorcedFemales 0.0% Never married100.0% Now married0.0% Separated0.0% Widowed0.0% DivorcedWomen who did not give birth in the past 12 months Now married:
100.0% (11)Unmarried:
0.0% (0)
Marital status - Asian population 15 years and over
Males 27.1% Never married68.1% Now married1.6% Separated0.0% Widowed3.2% DivorcedFemales 24.6% Never married60.1% Now married1.2% Separated5.9% Widowed8.2% DivorcedWomen who gave birth in the past 12 months Now married:
100.0% (47)Unmarried:
0.0% (0)
Women who did not give birth in the past 12 months Now married:
50.8% (683)Unmarried:
49.2% (662)
Marital status - Other race population 15 years and over
Males 27.6% Never married60.1% Now married0.0% Separated0.0% Widowed12.4% DivorcedFemales 22.6% Never married77.4% Now married0.0% Separated0.0% Widowed0.0% DivorcedWomen who did not give birth in the past 12 months Now married:
74.4% (185)Unmarried:
25.6% (63)
Marital status - Two or more races population 15 years and over
Males 33.2% Never married51.4% Now married0.0% Separated3.2% Widowed12.2% DivorcedFemales 44.3% Never married40.6% Now married0.0% Separated3.0% Widowed12.1% DivorcedWomen who did not give birth in the past 12 months Now married:
32.3% (154)Unmarried:
67.7% (322)
Marital status - White alone, not Hispanic / Latino population 15 years and over
Males 29.8% Never married58.3% Now married0.4% Separated4.2% Widowed7.4% DivorcedFemales 18.1% Never married51.3% Now married3.0% Separated7.4% Widowed20.2% DivorcedWomen who gave birth in the past 12 months Now married:
100.0% (75)Unmarried:
0.0% (0)
Women who did not give birth in the past 12 months Now married:
54.5% (1,133)Unmarried:
45.5% (947)
Marital status - Hispanic or Latino population 15 years and over
Males 38.2% Never married48.7% Now married0.0% Separated0.0% Widowed13.1% DivorcedFemales 14.9% Never married80.1% Now married0.0% Separated0.2% Widowed4.8% DivorcedWomen who did not give birth in the past 12 months Now married:
80.2% (286)Unmarried:
19.8% (71)
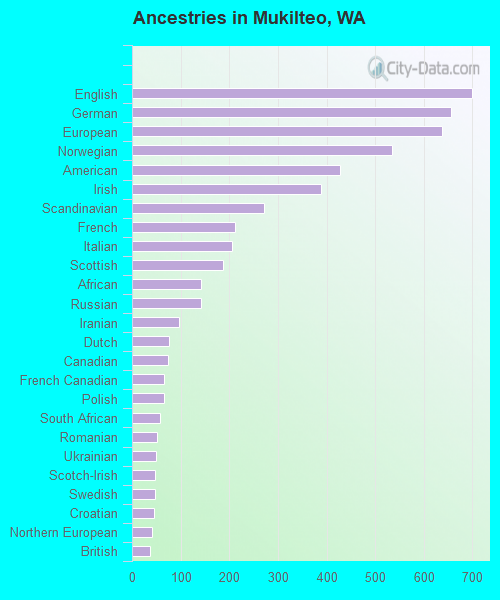
Ancestries in Mukilteo
699 6.4% English655 6.0% German637 5.8% European534 4.9% Norwegian428 3.9% American388 3.6% Irish272 2.5% Scandinavian211 1.9% French205 1.9% Italian187 1.7% Scottish142 1.3% African141 1.3% Russian96 0.9% Iranian76 0.7% Dutch75 0.7% Canadian66 0.6% French Canadian65 0.6% Polish58 0.5% South African52 0.5% Romanian50 0.5% Ukrainian47 0.4% Scotch-Irish47 0.4% Swedish46 0.4% Croatian42 0.4% Northern European37 0.3% British31 0.3% Portuguese28 0.3% Turkish27 0.2% Czech27 0.2% Greek23 0.2% Finnish21 0.2% Albanian20 0.2% Basque20 0.2% Welsh16 0.1% Danish11 0.1% Australian10 0.09% Yugoslavian9 0.08% Sudanese7 0.06% Lithuanian6 0.06% Eastern European6 0.06% Pennsylvania German
Geographical mobility in Mukilteo Same house 1 year ago 11,501 87.7% White (Caucasian)314 100.0% Black or African American60 100.0% American Indian / Alaska Native4,049 86.0% Asian68 100.0% Native Hawaiian / Pacific Islander707 87.4% Other race1,779 71.2% Two or more races11,164 87.6% White alone, not Hispanic / Latino1,300 89.2% Hispanic or LatinoMoved within same county 975 7.4% White / Caucasian388 8.2% Asian47 5.8% Other race420 16.8% Two or more races943 7.4% White alone, not Hispanic / Latino104 7.2% Hispanic or LatinoMoved within same state 317 2.4% White / Caucasian134 2.9% Asian38 4.7% Other race15 0.6% Two or more races329 2.6% White alone, not Hispanic / Latino34 2.3% Hispanic or LatinoMoved from different state 211 1.6% White / Caucasian20 0.4% Asian79 3.2% Two or more races202 1.6% White alone, not Hispanic / LatinoMoved from abroad 25 0.2% White80 1.7% Asian26 0.2% White alone, not Hispanic / Latino
Children Nativity (place of birth) in Mukilteo
Children under 6 years - Living with two parents Both parents native 722 100.0% NativeBoth parents foreign-born 120 77.9% Native34 22.1% Foreign-bornOne native, one foreign-born parent 395 100.0% NativeChildren under 6 years - Living with one parent Native parent 114 100.0% NativeChildren 6 to 17 years - Living with two parents Both parents native 1,239 100.0% NativeBoth parents foreign-born 624 73.0% Native231 27.0% Foreign-bornOne native, one foreign-born parent 587 100.0% NativeChildren 6 to 17 years - Living with one parent Native parent 470 100.0% NativeForeign-born parent 55 49.1% Native57 50.9% Foreign-born
Grandparents responsible for own grandchildren in Mukilteo
Grandparents (30 to 59 years) White / Caucasian 5 100.0% Responsible for grandchildrenWhite alone, not Hispanic / Latino 5 100.0% Responsible for grandchildrenGrandparents (60 years and over) White / Caucasian 43 36.2% Responsible for grandchildren76 63.8% Not responsible for grandchildrenWhite alone, not Hispanic / Latino 43 35.3% Responsible for grandchildren79 64.7% Not responsible for grandchildren