Races in Muncie, Indiana (IN) Detailed Stats
Data:
Races - White alone (%)
Races - White alone (% change since 2000)
Races - Black alone (%)
Races - Black alone (% change since 2000)
Races - American Indian alone (%)
Races - American Indian alone (% change since 2000)
Races - Asian alone (%)
Races - Asian alone (% change since 2000)
Races - Hispanic (%)
Races - Hispanic (% change since 2000)
Races - Native Hawaiian and Other Pacific Islander alone (%)
Races - Native Hawaiian and Other Pacific Islander alone (% change since 2000)
Races - Two or more races(%)
Races - Two or more races(% change since 2000)
Races - Other race alone (%)
Races - Other race alone (% change since 2000)
Racial diversity
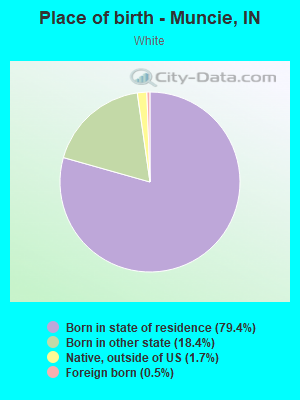
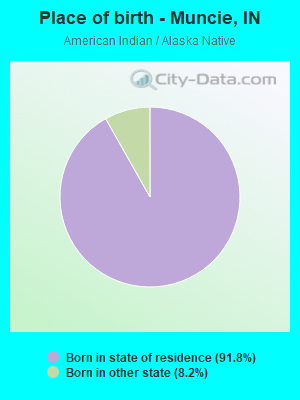
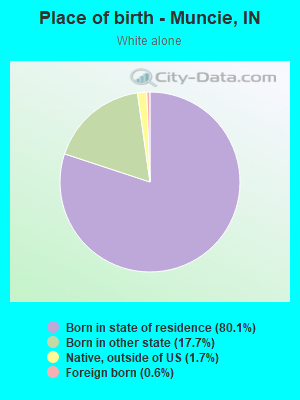
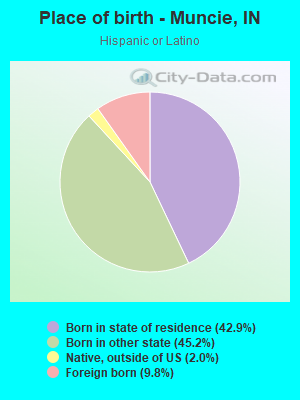
Place of birth - Born in state of residence (%)
Place of birth - Born in state of residence (%) - White
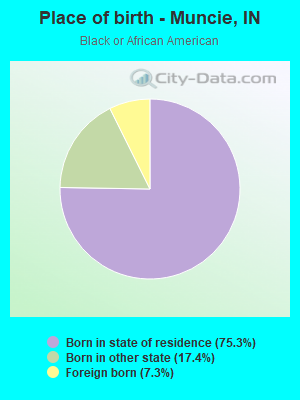
Place of birth - Born in state of residence (%) - Black or African American
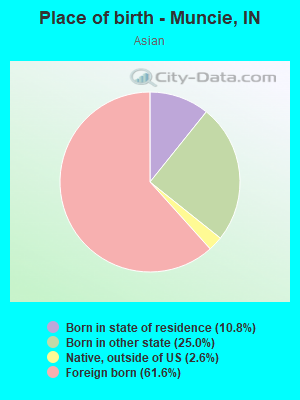
Place of birth - Born in state of residence (%) - Asian
Place of birth - Born in state of residence (%) - Hispanic or Latino
Place of birth - Born in state of residence (%) - American Indian and Alaska Native
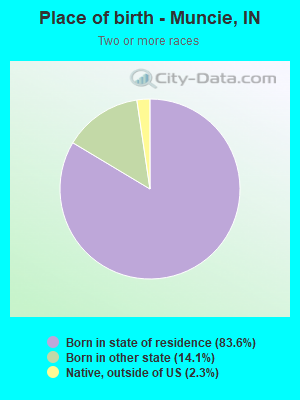
Place of birth - Born in state of residence (%) - Multirace
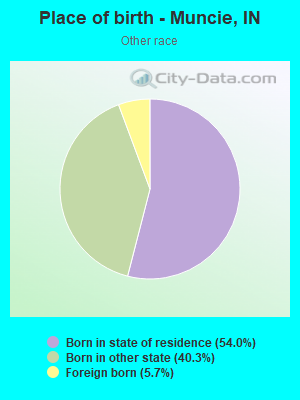
Place of birth - Born in state of residence (%) - Other Race
Place of birth - Born in other state (%)
Place of birth - Born in other state (%) - White
Place of birth - Born in other state (%) - Black or African American
Place of birth - Born in other state (%) - Asian
Place of birth - Born in other state (%) - Hispanic or Latino
Place of birth - Born in other state (%) - American Indian and Alaska Native
Place of birth - Born in other state (%) - Multirace
Place of birth - Born in other state (%) - Other Race
Place of birth - Native, outside of US (%)
Place of birth - Native, outside of US (%) - White
Place of birth - Native, outside of US (%) - Black or African American
Place of birth - Native, outside of US (%) - Asian
Place of birth - Native, outside of US (%) - Hispanic or Latino
Place of birth - Native, outside of US (%) - American Indian and Alaska Native
Place of birth - Native, outside of US (%) - Multirace
Place of birth - Native, outside of US (%) - Other Race
Place of birth - Foreign born (%)
Place of birth - Foreign born (%) - White
Place of birth - Foreign born (%) - Black or African American
Place of birth - Foreign born (%) - Asian
Place of birth - Foreign born (%) - Hispanic or Latino
Place of birth - Foreign born (%) - American Indian and Alaska Native
Place of birth - Foreign born (%) - Multirace
Place of birth - Foreign born (%) - Other Race
Residents speaking English at home (%)
Residents speaking English at home - Born in the United States (%)
Residents speaking English at home - Native, born elsewhere (%)
Residents speaking English at home - Foreign born (%)
Residents speaking Spanish at home (%)
Residents speaking Spanish at home - Born in the United States (%)
Residents speaking Spanish at home - Native, born elsewhere (%)
Residents speaking Spanish at home - Foreign born (%)
Residents speaking other language at home (%)
Residents speaking other language at home - Born in the United States (%)
Residents speaking other language at home - Native, born elsewhere (%)
Residents speaking other language at home - Foreign born (%)
Marital status - Never married (%)
Marital status - Now married (%)
Marital status - Separated (%)
Marital status - Widowed (%)
Marital status - Divorced (%)
Ancestries Reported - Arab (%)
Ancestries Reported - Czech (%)
Ancestries Reported - Danish (%)
Ancestries Reported - Dutch (%)
Ancestries Reported - English (%)
Ancestries Reported - French (%)
Ancestries Reported - French Canadian (%)
Ancestries Reported - German (%)
Ancestries Reported - Greek (%)
Ancestries Reported - Hungarian (%)
Ancestries Reported - Irish (%)
Ancestries Reported - Italian (%)
Ancestries Reported - Lithuanian (%)
Ancestries Reported - Norwegian (%)
Ancestries Reported - Polish (%)
Ancestries Reported - Portuguese (%)
Ancestries Reported - Russian (%)
Ancestries Reported - Scotch-Irish (%)
Ancestries Reported - Scottish (%)
Ancestries Reported - Slovak (%)
Ancestries Reported - Subsaharan African (%)
Ancestries Reported - Swedish (%)
Ancestries Reported - Swiss (%)
Ancestries Reported - Ukrainian (%)
Ancestries Reported - United States (%)
Ancestries Reported - Welsh (%)
Ancestries Reported - West Indian (%)
Ancestries Reported - Other (%)
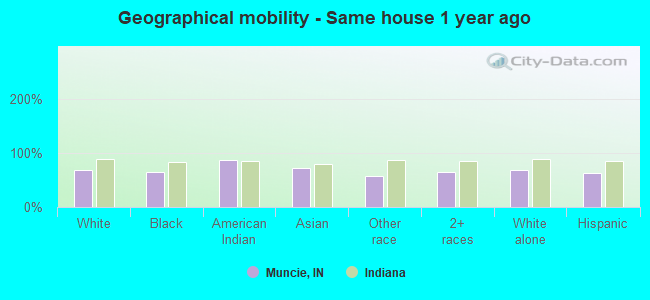
Geographical mobility - Same house 1 year ago (%)
Geographical mobility - Same house 1 year ago (%) - White
Geographical mobility - Same house 1 year ago (%) - Black or African American
Geographical mobility - Same house 1 year ago (%) - Asian
Geographical mobility - Same house 1 year ago (%) - Hispanic or Latino
Geographical mobility - Same house 1 year ago (%) - American Indian and Alaska Native
Geographical mobility - Same house 1 year ago (%) - Multirace
Geographical mobility - Same house 1 year ago (%) - Other Race
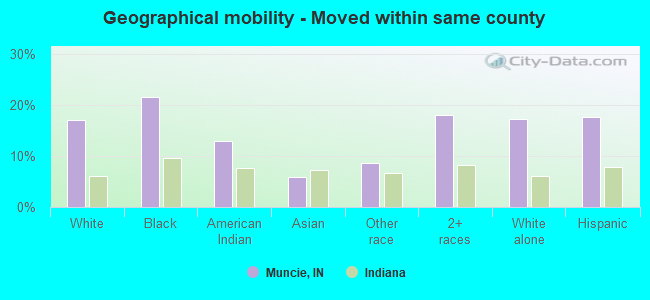
Geographical mobility - Moved within same county (%)
Geographical mobility - Moved within same county (%) - White
Geographical mobility - Moved within same county (%) - Black or African American
Geographical mobility - Moved within same county (%) - Asian
Geographical mobility - Moved within same county (%) - Hispanic or Latino
Geographical mobility - Moved within same county (%) - American Indian and Alaska Native
Geographical mobility - Moved within same county (%) - Multirace
Geographical mobility - Moved within same county (%) - Other Race
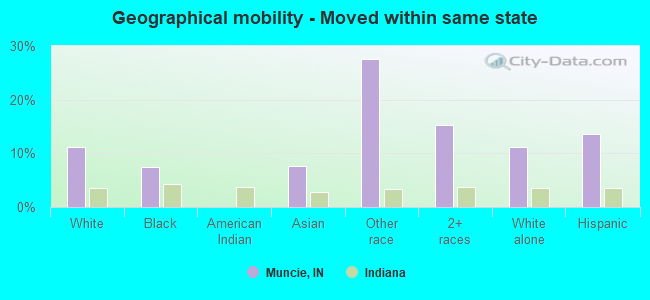
Geographical mobility - Moved from different county within same state (%)
Geographical mobility - Moved from different county within same state (%) - White
Geographical mobility - Moved from different county within same state (%) - Black or African American
Geographical mobility - Moved from different county within same state (%) - Asian
Geographical mobility - Moved from different county within same state (%) - Hispanic or Latino
Geographical mobility - Moved from different county within same state (%) - American Indian and Alaska Native
Geographical mobility - Moved from different county within same state (%) - Multirace
Geographical mobility - Moved from different county within same state (%) - Other Race
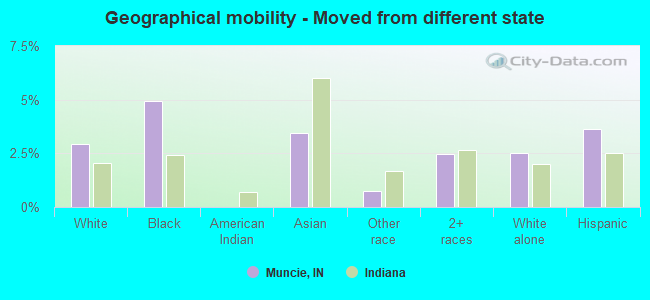
Geographical mobility - Moved from different state (%)
Geographical mobility - Moved from different state (%) - White
Geographical mobility - Moved from different state (%) - Black or African American
Geographical mobility - Moved from different state (%) - Asian
Geographical mobility - Moved from different state (%) - Hispanic or Latino
Geographical mobility - Moved from different state (%) - American Indian and Alaska Native
Geographical mobility - Moved from different state (%) - Multirace
Geographical mobility - Moved from different state (%) - Other Race
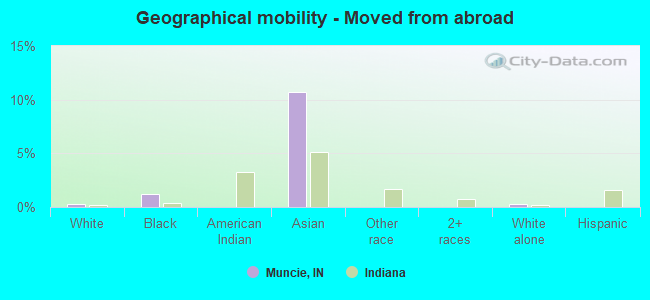
Geographical mobility - Moved from abroad (%)
Geographical mobility - Moved from abroad (%) - White
Geographical mobility - Moved from abroad (%) - Black or African American
Geographical mobility - Moved from abroad (%) - Asian
Geographical mobility - Moved from abroad (%) - Hispanic or Latino
Geographical mobility - Moved from abroad (%) - American Indian and Alaska Native
Geographical mobility - Moved from abroad (%) - Multirace
Geographical mobility - Moved from abroad (%) - Other Race
Place of birth for the foreign-born population - Ireland (%)
Place of birth for the foreign-born population - Denmark (%)
Place of birth for the foreign-born population - Norway (%)
Place of birth for the foreign-born population - Sweden (%)
Place of birth for the foreign-born population - United Kingdom (%)
Place of birth for the foreign-born population - England (%)
Place of birth for the foreign-born population - Scotland (%)
Place of birth for the foreign-born population - Other Northern Europe (%)
Place of birth for the foreign-born population - Austria (%)
Place of birth for the foreign-born population - Belgium (%)
Place of birth for the foreign-born population - France (%)
Place of birth for the foreign-born population - Germany (%)
Place of birth for the foreign-born population - Netherlands (%)
Place of birth for the foreign-born population - Switzerland (%)
Place of birth for the foreign-born population - Other Western Europe (%)
Place of birth for the foreign-born population - Greece (%)
Place of birth for the foreign-born population - Italy (%)
Place of birth for the foreign-born population - Portugal (%)
Place of birth for the foreign-born population - Spain (%)
Place of birth for the foreign-born population - Other Southern Europe (%)
Place of birth for the foreign-born population - Albania (%)
Place of birth for the foreign-born population - Belarus (%)
Place of birth for the foreign-born population - Bosnia and Herzegovina (%)
Place of birth for the foreign-born population - Bulgaria (%)
Place of birth for the foreign-born population - Croatia (%)
Place of birth for the foreign-born population - Czechoslovakia (%)
Place of birth for the foreign-born population - Hungary (%)
Place of birth for the foreign-born population - Latvia (%)
Place of birth for the foreign-born population - Lithuania (%)
Place of birth for the foreign-born population - North Macedonia (Macedonia) (%)
Place of birth for the foreign-born population - Moldova (%)
Place of birth for the foreign-born population - Poland (%)
Place of birth for the foreign-born population - Romania (%)
Place of birth for the foreign-born population - Russia (%)
Place of birth for the foreign-born population - Serbia (%)
Place of birth for the foreign-born population - Ukraine (%)
Place of birth for the foreign-born population - Other Eastern Europe (%)
Place of birth for the foreign-born population - China (%)
Place of birth for the foreign-born population - Hong Kong (%)
Place of birth for the foreign-born population - Taiwan (%)
Place of birth for the foreign-born population - Japan (%)
Place of birth for the foreign-born population - Korea (%)
Place of birth for the foreign-born population - Other Eastern Asia (%)
Place of birth for the foreign-born population - Afghanistan (%)
Place of birth for the foreign-born population - Bangladesh (%)
Place of birth for the foreign-born population - India (%)
Place of birth for the foreign-born population - Iran (%)
Place of birth for the foreign-born population - Kazakhstan (%)
Place of birth for the foreign-born population - Nepal (%)
Place of birth for the foreign-born population - Pakistan (%)
Place of birth for the foreign-born population - Sri Lanka (%)
Place of birth for the foreign-born population - Uzbekistan (%)
Place of birth for the foreign-born population - Other South Central Asia (%)
Place of birth for the foreign-born population - Burma (%)
Place of birth for the foreign-born population - Cambodia (%)
Place of birth for the foreign-born population - Indonesia (%)
Place of birth for the foreign-born population - Laos (%)
Place of birth for the foreign-born population - Malaysia (%)
Place of birth for the foreign-born population - Philippines (%)
Place of birth for the foreign-born population - Singapore (%)
Place of birth for the foreign-born population - Thailand (%)
Place of birth for the foreign-born population - Vietnam (%)
Place of birth for the foreign-born population - Other South Eastern Asia (%)
Place of birth for the foreign-born population - Armenia (%)
Place of birth for the foreign-born population - Iraq (%)
Place of birth for the foreign-born population - Israel (%)
Place of birth for the foreign-born population - Jordan (%)
Place of birth for the foreign-born population - Kuwait (%)
Place of birth for the foreign-born population - Lebanon (%)
Place of birth for the foreign-born population - Saudi Arabia (%)
Place of birth for the foreign-born population - Syria (%)
Place of birth for the foreign-born population - Turkey (%)
Place of birth for the foreign-born population - Yemen (%)
Place of birth for the foreign-born population - Other Western Asia (%)
Place of birth for the foreign-born population - Eritrea (%)
Place of birth for the foreign-born population - Ethiopia (%)
Place of birth for the foreign-born population - Kenya (%)
Place of birth for the foreign-born population - Somalia (%)
Place of birth for the foreign-born population - Uganda (%)
Place of birth for the foreign-born population - Zimbabwe (%)
Place of birth for the foreign-born population - Other Eastern Africa (%)
Place of birth for the foreign-born population - Cameroon (%)
Place of birth for the foreign-born population - Congo (%)
Place of birth for the foreign-born population - Democratic Republic of Congo (Zaire) (%)
Place of birth for the foreign-born population - Other Middle Africa (%)
Place of birth for the foreign-born population - Egypt (%)
Place of birth for the foreign-born population - Morocco (%)
Place of birth for the foreign-born population - Sudan (%)
Place of birth for the foreign-born population - Other Northern Africa (%)
Place of birth for the foreign-born population - South Africa (%)
Place of birth for the foreign-born population - Other Southern Africa (%)
Place of birth for the foreign-born population - Cabo Verde (%)
Place of birth for the foreign-born population - Ghana (%)
Place of birth for the foreign-born population - Liberia (%)
Place of birth for the foreign-born population - Nigeria (%)
Place of birth for the foreign-born population - Senegal (%)
Place of birth for the foreign-born population - Sierra Leone (%)
Place of birth for the foreign-born population - Other Western Africa (%)
Place of birth for the foreign-born population - Australia (%)
Place of birth for the foreign-born population - New Zealand (%)
Place of birth for the foreign-born population - Fiji (%)
Place of birth for the foreign-born population - Micronesia (%)
Place of birth for the foreign-born population - Bahamas (%)
Place of birth for the foreign-born population - Barbados (%)
Place of birth for the foreign-born population - Cuba (%)
Place of birth for the foreign-born population - Dominica (%)
Place of birth for the foreign-born population - Dominican Republic (%)
Place of birth for the foreign-born population - Grenada (%)
Place of birth for the foreign-born population - Haiti (%)
Place of birth for the foreign-born population - Jamaica (%)
Place of birth for the foreign-born population - St. Vincent and the Grenadines (%)
Place of birth for the foreign-born population - Trinidad and Tobago (%)
Place of birth for the foreign-born population - West Indies (%)
Place of birth for the foreign-born population - Other Caribbean (%)
Place of birth for the foreign-born population - Belize (%)
Place of birth for the foreign-born population - Costa Rica (%)
Place of birth for the foreign-born population - El Salvador (%)
Place of birth for the foreign-born population - Guatemala (%)
Place of birth for the foreign-born population - Honduras (%)
Place of birth for the foreign-born population - Mexico (%)
Place of birth for the foreign-born population - Nicaragua (%)
Place of birth for the foreign-born population - Panama (%)
Place of birth for the foreign-born population - Other Central America (%)
Place of birth for the foreign-born population - Argentina (%)
Place of birth for the foreign-born population - Bolivia (%)
Place of birth for the foreign-born population - Brazil (%)
Place of birth for the foreign-born population - Chile (%)
Place of birth for the foreign-born population - Colombia (%)
Place of birth for the foreign-born population - Ecuador (%)
Place of birth for the foreign-born population - Guyana (%)
Place of birth for the foreign-born population - Peru (%)
Place of birth for the foreign-born population - Uruguay (%)
Place of birth for the foreign-born population - Venezuela (%)
Place of birth for the foreign-born population - Other South America (%)
Place of birth for the foreign-born population - Canada (%)
Place of birth for the foreign-born population - Other Northern America (%)
Place of birth for the foreign-born population - Other (%)
Latest news about races in Muncie, IN collected exclusively by city-data.com from local newspapers, TV, and radio stations
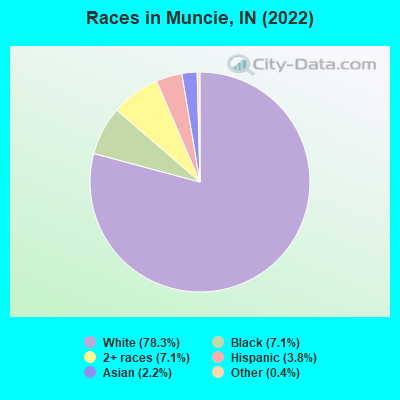
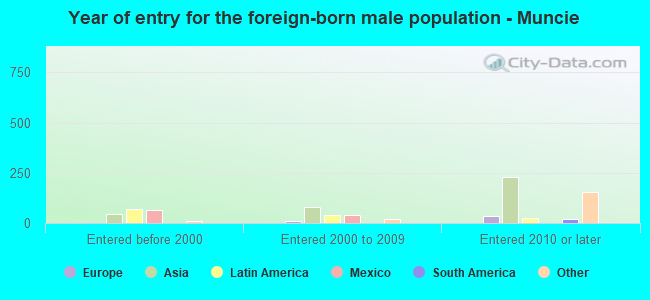
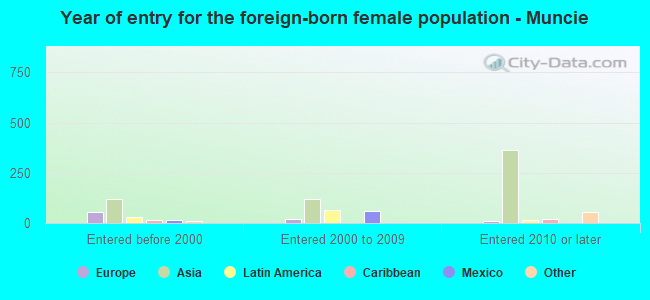
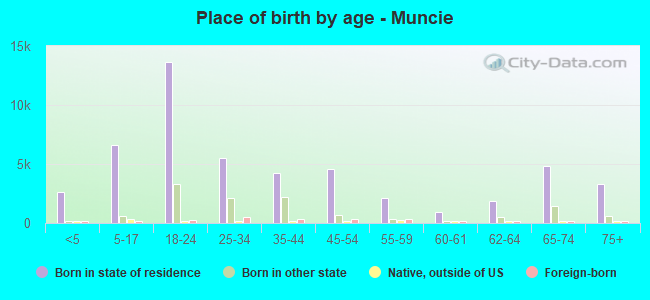
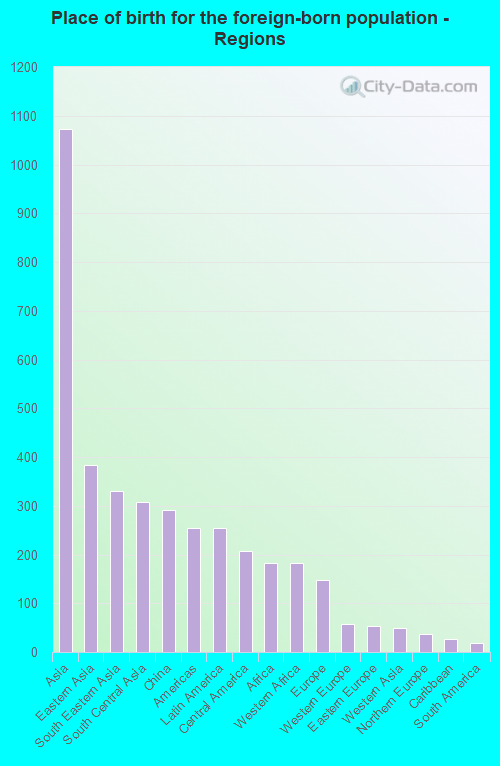
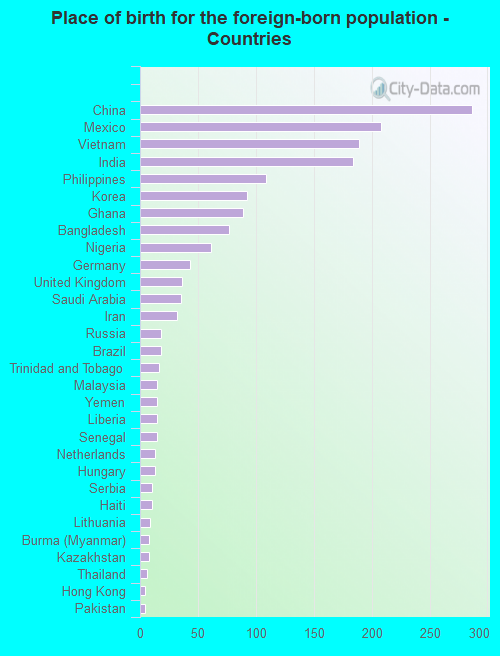
According to 2022 data, the most numerous races in Muncie, IN are White alone (51,001 residents), Black alone (4,626 residents), and Hispanic (2,489 residents). 95.1% of Muncie residents speak English at home. 2.5% of Muncie, IN residents are foreign-born (1.5% born in Asia, 0.4% born in Latin America), which is 135.4% less than the foreign-born rate of 6.0% across the entire state of Indiana.
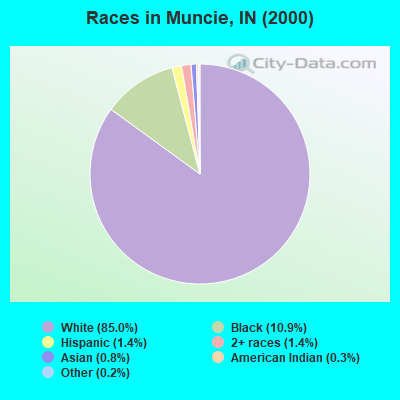
Race distribution in Muncie
2000 2022
5,219,373 85.8% White alone 505,462 8.3% Black alone 214,536 3.5% Hispanic 61,115 1.0% Two or more races 58,424 1.0% Asian alone 13,654 0.2% American Indian alone 6,348 0.1% Other race alone 1,573 0.03% Native Hawaiian and Other
5,192,455 76.0% White alone 628,054 9.2% Black alone 534,528 7.8% Hispanic 263,242 3.9% Two or more races 172,880 2.5% Asian alone 33,467 0.5% Other race alone 5,866 0.09% American Indian alone 2,545 0.04% Native Hawaiian and Other
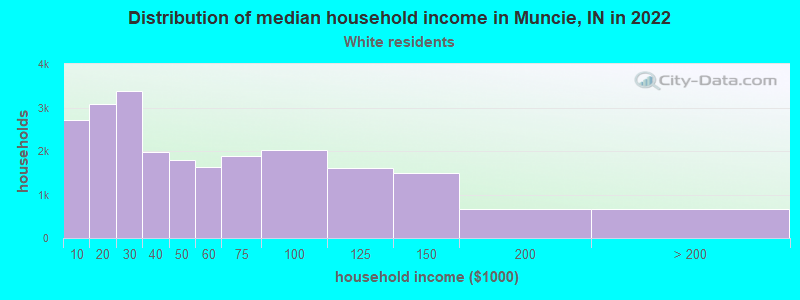
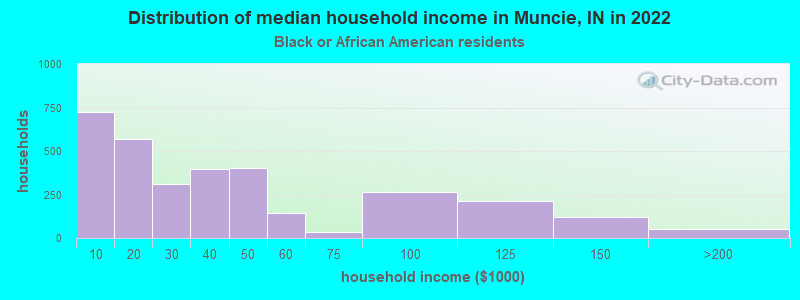
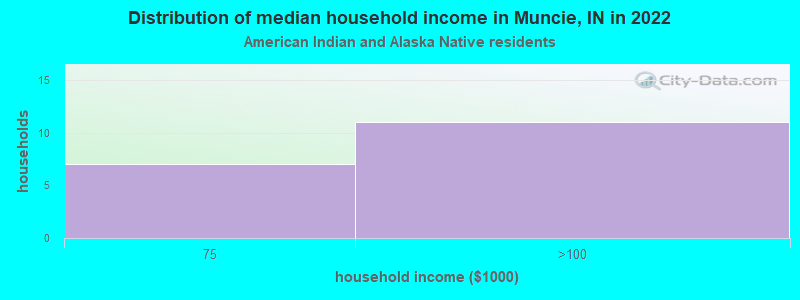
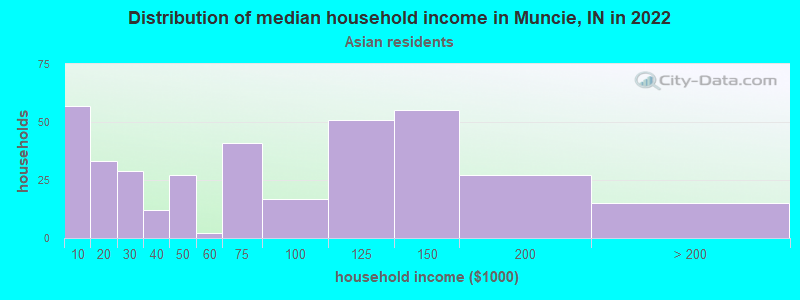
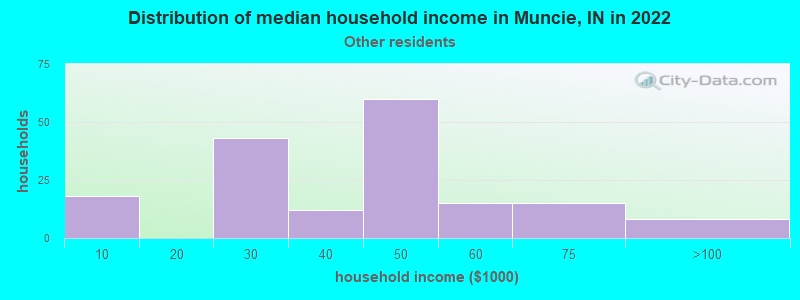
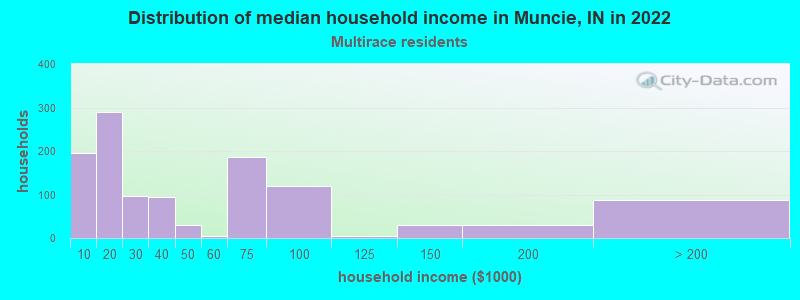
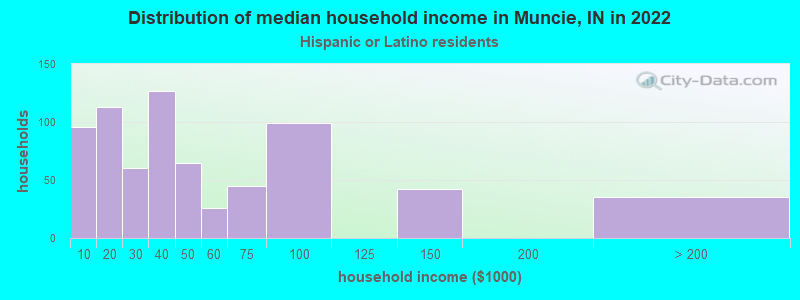
Income and house value in Muncie Median household income in 2022 $41,538 White non-Hispanic householders$40,224 Black householders$83,263 Asian householders$41,049 Some other race householders$30,471 Two or more races householders$30,014 Hispanic or Latino race householdersMedian 2022 house value $99,655 White Non-Hispanic householders$75,810 Black or African American householders $142,741 Asian householders$99,655 Some other race householders$100,971 Two or more races householders$88,966 Hispanic or Latino householders
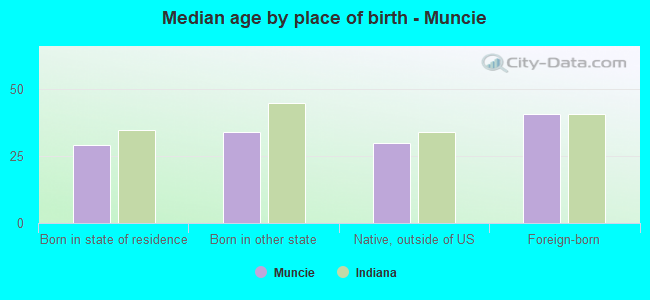
Median age by race in Muncie
33.2 Median age for White residents31.5 33.9 29.8 Median age for Black or African American residents31.9 29.2 24.1 Median age for American Indian / Alaska Native residents-666,666,666.0 -666,666,666.0 36.9 Median age for Asian residents40.4 36.3 -666,666,666.0 Median age for Native Hawaiian / Pacific Islander residents-666,666,666.0 -666,666,666.0 29.5 Median age for Other race residents43.5 15.6 20.7 Median age for Two or more races residents20.8 20.7 33.6 Median age for White alone residents32.0 34.1 21.3 Median age for Hispanic or Latino residents25.2 20.8
Owner/renter occupied households by race in Muncie
House owners and renters - White residents 12,405 54.1% Owner occupied10,525 45.9% Renter occupiedHouse owners and renters - Black or African American residents 743 32.3% Owner occupied1,554 67.7% Renter occupiedHouse owners and renters - American Indian / Alaska Native residents 16 100.0% Renter occupiedHouse owners and renters - Asian residents 118 28.0% Owner occupied305 72.0% Renter occupiedHouse owners and renters - Other race residents 78 45.2% Owner occupied95 54.8% Renter occupiedHouse owners and renters - Two or more races residents 760 42.2% Owner occupied1,043 57.8% Renter occupiedHouse owners and renters - White alone residents 12,201 54.1% Owner occupied10,333 45.9% Renter occupiedHouse owners and renters - Hispanic or Latino residents 274 42.6% Owner occupied369 57.4% Renter occupied
Language usage in Muncie
English speakers - Total 95.1% of residents of Muncie speak English at home.
1.5% of residents speak Spanish at home 760 79.6% Speak English very well195 20.4% Speak English less than very well2.9% of residents speak other language at home 1,255 68.5% Speak English very well578 31.5% Speak English less than very well
English speakers - Born in the United States 95.0% of residents of Muncie speak English at home.
2.9% of residents speak Spanish at home 388 93.5% Speak English very well27 6.5% Speak English less than very well2.1% of residents speak other language at home 296 99.0% Speak English very well3 1.0% Speak English less than very well
English speakers - Native, born elsewhere 75.5% of residents of Muncie speak English at home.
2.9% of residents speak Spanish at home 13 100.0% Speak English very well27.3% of residents speak other language at home 121 100.0% Speak English very well
English speakers - Foreign-born 16.6% of residents of Muncie speak English at home.
12.0% of residents speak Spanish at home 56 28.0% Speak English very well144 72.0% Speak English less than very well72.4% of residents speak other language at home 675 56.1% Speak English very well529 43.9% Speak English less than very well
White (Caucasian) - Speak only English Native:
97.8% (49,042)Foreign-born:
24.2% (73)
White (Caucasian) - Speak another language Native:
2.4% (1,198)Foreign-born:
70.8% (215)
Black or African American - Speak only English Native:
99.0% (5,834)Foreign-born:
23.2% (53)
Black or African American - Speak another language Native:
0.7% (39)Foreign-born:
75.2% (171)
Asian - Speak only English Native:
91.3% (472)Foreign-born:
15.3% (206)
Asian - Speak another language Native:
8.7% (45)Foreign-born:
84.7% (1,138)
Other race - Speak only English Native:
62.5% (326)Foreign-born:
20.3% (7)
Other race - Speak another language Native:
38.9% (203)Foreign-born:
81.4% (29)
Two or more races - Speak only English Native:
94.1% (3,761)Foreign-born:
34.1% (35)
Two or more races - Speak another language Native:
3.6% (146)Foreign-born:
67.5% (69)
White alone - Speak only English Native:
98.2% (48,027)Foreign-born:
28.5% (71)
White alone - Speak another language Native:
2.1% (1,017)Foreign-born:
75.2% (188)
Hispanic or Latino - Speak only English Native:
73.3% (1,527)Foreign-born:
4.4% (9)
Hispanic or Latino - Speak another language Native:
25.6% (534)Foreign-born:
95.3% (199)
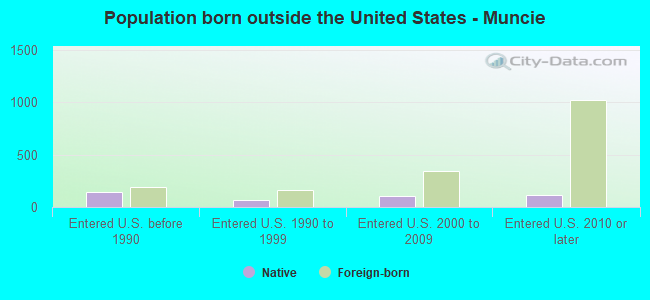
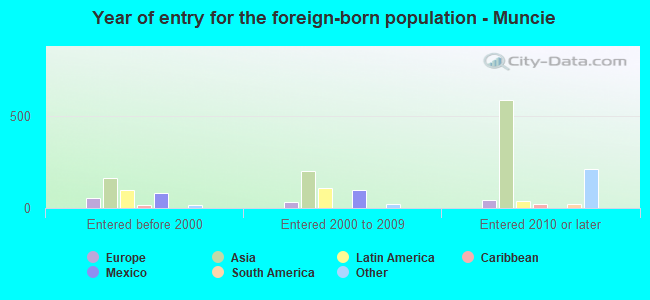
Foreign-born residents in Muncie 1,659 residents are foreign born (1.5% Asia , 0.4% Latin America ).
This city:
2.5%Indiana:
5.6%
Marital status for residents in Muncie Marital status - White (Caucasian) population 15 years and over
Males 48.6% Never married34.3% Now married3.2% Separated3.4% Widowed10.5% DivorcedFemales 49.8% Never married26.3% Now married1.4% Separated9.1% Widowed13.4% DivorcedWomen who gave birth in the past 12 months Now married:
29.2% (226)Unmarried:
70.8% (547)
Women who did not give birth in the past 12 months Now married:
21.5% (3,411)Unmarried:
78.5% (12,434)
Marital status - Black or African American population 15 years and over
Males 62.2% Never married21.6% Now married0.0% Separated2.3% Widowed13.9% DivorcedFemales 74.3% Never married13.2% Now married0.0% Separated9.6% Widowed3.0% DivorcedWomen who gave birth in the past 12 months Now married:
38.6% (49)Unmarried:
61.4% (78)
Women who did not give birth in the past 12 months Now married:
7.3% (132)Unmarried:
92.7% (1,666)
Marital status - American Indian / Alaska Native population 15 years and over
Males 100.0% Never married0.0% Now married0.0% Separated0.0% Widowed0.0% DivorcedFemales 100.0% Never married0.0% Now married0.0% Separated0.0% Widowed0.0% DivorcedWomen who did not give birth in the past 12 months Now married:
0.0% (0)Unmarried:
100.0% (113)
Marital status - Asian population 15 years and over
Males 31.4% Never married68.6% Now married0.0% Separated0.0% Widowed0.0% DivorcedFemales 58.6% Never married34.1% Now married0.0% Separated5.1% Widowed2.2% DivorcedWomen who gave birth in the past 12 months Now married:
100.0% (4)Unmarried:
0.0% (0)
Women who did not give birth in the past 12 months Now married:
26.3% (155)Unmarried:
73.7% (434)
Marital status - Other race population 15 years and over
Males 48.9% Never married30.5% Now married0.0% Separated0.0% Widowed20.5% DivorcedFemales 77.9% Never married22.1% Now married0.0% Separated0.0% Widowed0.0% DivorcedWomen who gave birth in the past 12 months Now married:
63.6% (17)Unmarried:
36.4% (10)
Women who did not give birth in the past 12 months Now married:
4.8% (8)Unmarried:
95.2% (170)
Marital status - Two or more races population 15 years and over
Males 72.5% Never married19.6% Now married0.0% Separated2.1% Widowed5.9% DivorcedFemales 65.7% Never married11.3% Now married0.0% Separated5.4% Widowed17.6% DivorcedWomen who gave birth in the past 12 months Now married:
11.0% (12)Unmarried:
89.0% (100)
Women who did not give birth in the past 12 months Now married:
13.1% (155)Unmarried:
86.9% (1,024)
Marital status - White alone, not Hispanic / Latino population 15 years and over
Males 48.5% Never married34.5% Now married3.3% Separated3.5% Widowed10.3% DivorcedFemales 49.8% Never married26.7% Now married1.4% Separated9.1% Widowed12.9% DivorcedWomen who gave birth in the past 12 months Now married:
29.2% (226)Unmarried:
70.8% (547)
Women who did not give birth in the past 12 months Now married:
21.9% (3,363)Unmarried:
78.1% (11,987)
Marital status - Hispanic or Latino population 15 years and over
Males 61.1% Never married16.3% Now married0.0% Separated0.0% Widowed22.7% DivorcedFemales 67.7% Never married11.1% Now married0.7% Separated5.7% Widowed14.8% DivorcedWomen who gave birth in the past 12 months Now married:
17.1% (6)Unmarried:
82.9% (31)
Women who did not give birth in the past 12 months Now married:
10.6% (76)Unmarried:
89.4% (644)
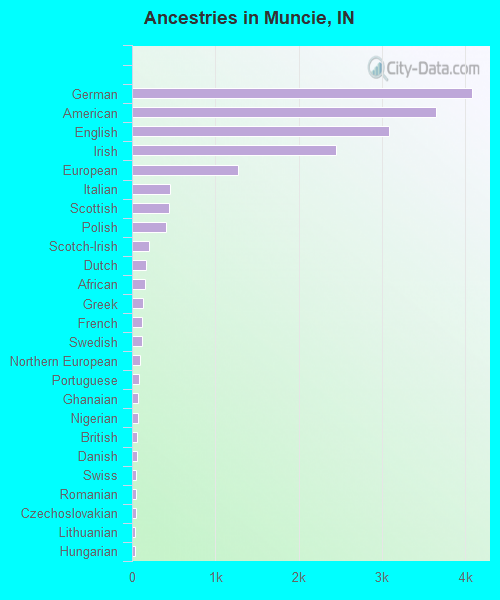
Ancestries in Muncie
4,084 14.0% German3,657 12.6% American3,088 10.6% English2,445 8.4% Irish1,270 4.4% European455 1.6% Italian448 1.5% Scottish405 1.4% Polish205 0.7% Scotch-Irish164 0.6% Dutch162 0.6% African138 0.5% Greek118 0.4% French117 0.4% Swedish91 0.3% Northern European83 0.3% Portuguese72 0.2% Ghanaian70 0.2% Nigerian66 0.2% British58 0.2% Danish48 0.2% Swiss47 0.2% Romanian44 0.2% Czechoslovakian42 0.1% Lithuanian39 0.1% Hungarian34 0.1% Arab34 0.1% Scandinavian33 0.1% Pennsylvania German33 0.1% Eastern European32 0.1% Norwegian30 0.1% Serbian26 0.09% Senegalese24 0.08% French Canadian23 0.08% Iranian21 0.07% Bahamian20 0.07% Czech19 0.07% Brazilian19 0.07% Russian15 0.05% Australian15 0.05% Austrian10 0.03% Kenyan6 0.02% Slovak6 0.02% Welsh6 0.02% Barbadian
Geographical mobility in Muncie Same house 1 year ago 35,398 68.5% White (Caucasian)2,882 65.0% Black or African American96 85.9% American Indian / Alaska Native1,064 71.9% Asian356 57.6% Other race3,477 64.2% Two or more races34,530 68.6% White alone, not Hispanic / Latino1,524 63.1% Hispanic or LatinoMoved within same county 8,813 17.1% White / Caucasian953 21.5% Black or African American14 12.9% American Indian / Alaska Native88 5.9% Asian53 8.5% Other race980 18.1% Two or more races8,709 17.3% White alone, not Hispanic / Latino426 17.6% Hispanic or LatinoMoved within same state 5,759 11.2% White / Caucasian330 7.4% Black or African American114 7.7% Asian171 27.7% Other race827 15.3% Two or more races5,660 11.2% White alone, not Hispanic / Latino330 13.7% Hispanic or LatinoMoved from different state 1,522 2.9% White / Caucasian220 5.0% Black or African American51 3.4% Asian5 0.7% Other race135 2.5% Two or more races1,259 2.5% White alone, not Hispanic / Latino87 3.6% Hispanic or LatinoMoved from abroad 154 0.3% White52 1.2% Black or African American158 10.7% Asian154 0.3% White alone, not Hispanic / Latino
Children Nativity (place of birth) in Muncie
Children under 6 years - Living with two parents Both parents native 1,433 100.0% NativeBoth parents foreign-born 42 100.0% NativeOne native, one foreign-born parent 103 100.0% NativeChildren under 6 years - Living with one parent Native parent 1,712 100.0% NativeForeign-born parent 4 100.0% NativeChildren 6 to 17 years - Living with two parents Both parents native 2,679 100.0% NativeBoth parents foreign-born 41 56.1% Native32 43.9% Foreign-bornOne native, one foreign-born parent 186 100.0% NativeChildren 6 to 17 years - Living with one parent Native parent 3,151 100.0% NativeForeign-born parent 77 52.0% Native71 48.0% Foreign-born
Grandparents responsible for own grandchildren in Muncie
Grandparents (30 to 59 years) White / Caucasian 263 68.8% Responsible for grandchildren119 31.2% Not responsible for grandchildrenBlack or African American 4 25.9% Responsible for grandchildren13 74.1% Not responsible for grandchildrenOther race 16 100.0% Responsible for grandchildrenTwo or more races 11 100.0% Responsible for grandchildrenWhite alone, not Hispanic / Latino 271 68.2% Responsible for grandchildren126 31.8% Not responsible for grandchildrenHispanic or Latino 15 100.0% Responsible for grandchildrenGrandparents (60 years and over) White / Caucasian 128 39.0% Responsible for grandchildren200 61.0% Not responsible for grandchildrenBlack or African American 35 56.2% Responsible for grandchildren27 43.8% Not responsible for grandchildrenWhite alone, not Hispanic / Latino 130 43.4% Responsible for grandchildren169 56.6% Not responsible for grandchildrenHispanic or Latino 33 100.0% Not responsible for grandchildren