Races in Murfreesboro, Tennessee (TN) Detailed Stats
Data:
Races - White alone (%)
Races - White alone (% change since 2000)
Races - Black alone (%)
Races - Black alone (% change since 2000)
Races - American Indian alone (%)
Races - American Indian alone (% change since 2000)
Races - Asian alone (%)
Races - Asian alone (% change since 2000)
Races - Hispanic (%)
Races - Hispanic (% change since 2000)
Races - Native Hawaiian and Other Pacific Islander alone (%)
Races - Native Hawaiian and Other Pacific Islander alone (% change since 2000)
Races - Two or more races(%)
Races - Two or more races(% change since 2000)
Races - Other race alone (%)
Races - Other race alone (% change since 2000)
Racial diversity
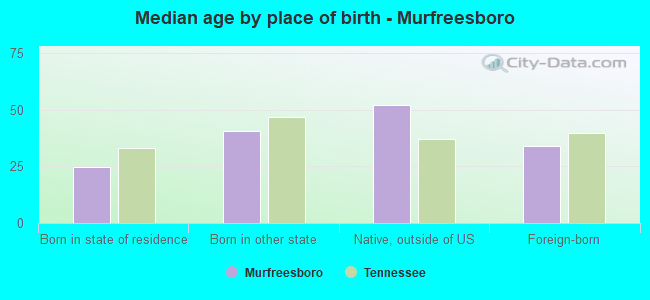
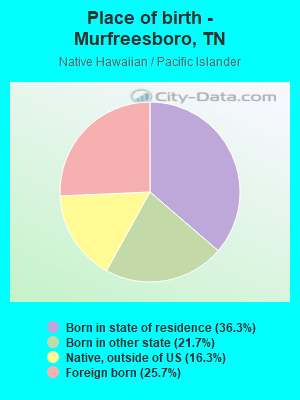
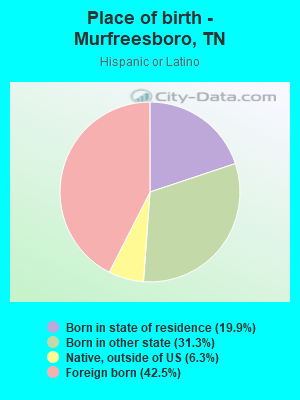
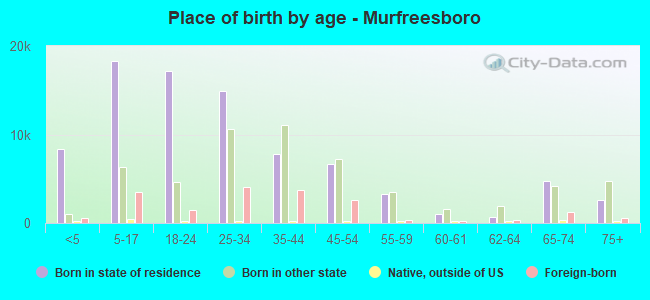
Place of birth - Born in state of residence (%)
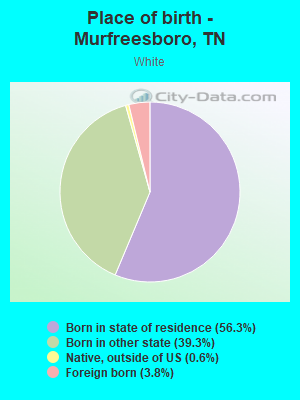
Place of birth - Born in state of residence (%) - White
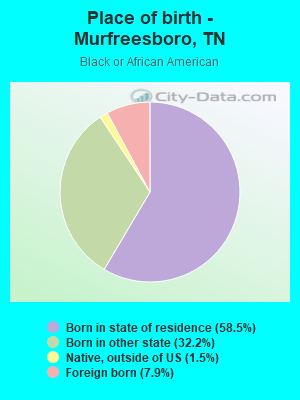
Place of birth - Born in state of residence (%) - Black or African American
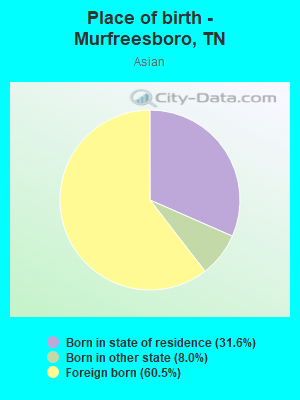
Place of birth - Born in state of residence (%) - Asian
Place of birth - Born in state of residence (%) - Hispanic or Latino
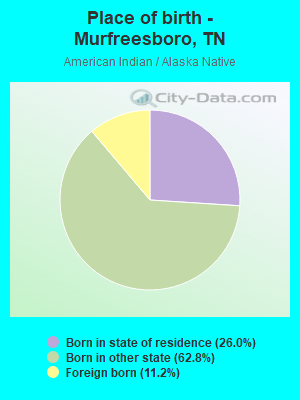
Place of birth - Born in state of residence (%) - American Indian and Alaska Native
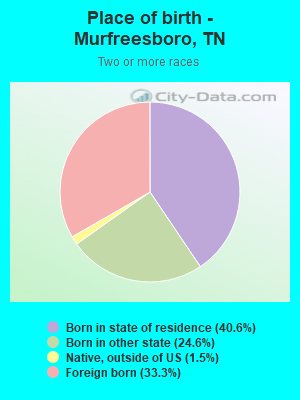
Place of birth - Born in state of residence (%) - Multirace
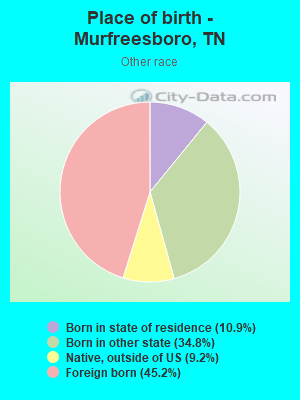
Place of birth - Born in state of residence (%) - Other Race
Place of birth - Born in other state (%)
Place of birth - Born in other state (%) - White
Place of birth - Born in other state (%) - Black or African American
Place of birth - Born in other state (%) - Asian
Place of birth - Born in other state (%) - Hispanic or Latino
Place of birth - Born in other state (%) - American Indian and Alaska Native
Place of birth - Born in other state (%) - Multirace
Place of birth - Born in other state (%) - Other Race
Place of birth - Native, outside of US (%)
Place of birth - Native, outside of US (%) - White
Place of birth - Native, outside of US (%) - Black or African American
Place of birth - Native, outside of US (%) - Asian
Place of birth - Native, outside of US (%) - Hispanic or Latino
Place of birth - Native, outside of US (%) - American Indian and Alaska Native
Place of birth - Native, outside of US (%) - Multirace
Place of birth - Native, outside of US (%) - Other Race
Place of birth - Foreign born (%)
Place of birth - Foreign born (%) - White
Place of birth - Foreign born (%) - Black or African American
Place of birth - Foreign born (%) - Asian
Place of birth - Foreign born (%) - Hispanic or Latino
Place of birth - Foreign born (%) - American Indian and Alaska Native
Place of birth - Foreign born (%) - Multirace
Place of birth - Foreign born (%) - Other Race
Residents speaking English at home (%)
Residents speaking English at home - Born in the United States (%)
Residents speaking English at home - Native, born elsewhere (%)
Residents speaking English at home - Foreign born (%)
Residents speaking Spanish at home (%)
Residents speaking Spanish at home - Born in the United States (%)
Residents speaking Spanish at home - Native, born elsewhere (%)
Residents speaking Spanish at home - Foreign born (%)
Residents speaking other language at home (%)
Residents speaking other language at home - Born in the United States (%)
Residents speaking other language at home - Native, born elsewhere (%)
Residents speaking other language at home - Foreign born (%)
Marital status - Never married (%)
Marital status - Now married (%)
Marital status - Separated (%)
Marital status - Widowed (%)
Marital status - Divorced (%)
Ancestries Reported - Arab (%)
Ancestries Reported - Czech (%)
Ancestries Reported - Danish (%)
Ancestries Reported - Dutch (%)
Ancestries Reported - English (%)
Ancestries Reported - French (%)
Ancestries Reported - French Canadian (%)
Ancestries Reported - German (%)
Ancestries Reported - Greek (%)
Ancestries Reported - Hungarian (%)
Ancestries Reported - Irish (%)
Ancestries Reported - Italian (%)
Ancestries Reported - Lithuanian (%)
Ancestries Reported - Norwegian (%)
Ancestries Reported - Polish (%)
Ancestries Reported - Portuguese (%)
Ancestries Reported - Russian (%)
Ancestries Reported - Scotch-Irish (%)
Ancestries Reported - Scottish (%)
Ancestries Reported - Slovak (%)
Ancestries Reported - Subsaharan African (%)
Ancestries Reported - Swedish (%)
Ancestries Reported - Swiss (%)
Ancestries Reported - Ukrainian (%)
Ancestries Reported - United States (%)
Ancestries Reported - Welsh (%)
Ancestries Reported - West Indian (%)
Ancestries Reported - Other (%)
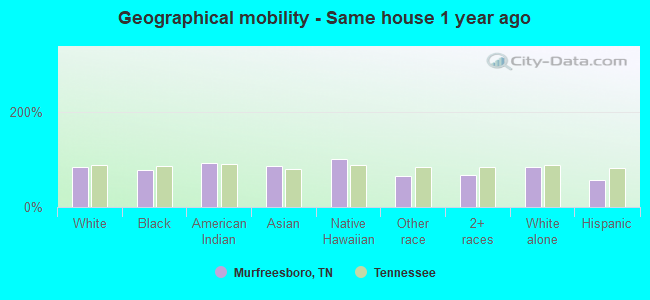
Geographical mobility - Same house 1 year ago (%)
Geographical mobility - Same house 1 year ago (%) - White
Geographical mobility - Same house 1 year ago (%) - Black or African American
Geographical mobility - Same house 1 year ago (%) - Asian
Geographical mobility - Same house 1 year ago (%) - Hispanic or Latino
Geographical mobility - Same house 1 year ago (%) - American Indian and Alaska Native
Geographical mobility - Same house 1 year ago (%) - Multirace
Geographical mobility - Same house 1 year ago (%) - Other Race
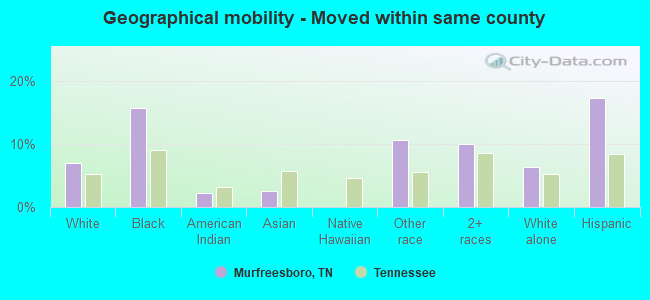
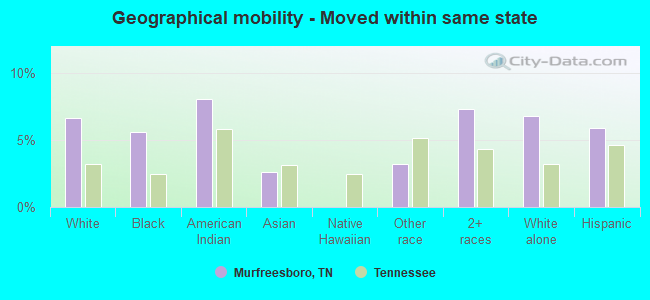
Geographical mobility - Moved within same county (%)
Geographical mobility - Moved within same county (%) - White
Geographical mobility - Moved within same county (%) - Black or African American
Geographical mobility - Moved within same county (%) - Asian
Geographical mobility - Moved within same county (%) - Hispanic or Latino
Geographical mobility - Moved within same county (%) - American Indian and Alaska Native
Geographical mobility - Moved within same county (%) - Multirace
Geographical mobility - Moved within same county (%) - Other Race
Geographical mobility - Moved from different county within same state (%)
Geographical mobility - Moved from different county within same state (%) - White
Geographical mobility - Moved from different county within same state (%) - Black or African American
Geographical mobility - Moved from different county within same state (%) - Asian
Geographical mobility - Moved from different county within same state (%) - Hispanic or Latino
Geographical mobility - Moved from different county within same state (%) - American Indian and Alaska Native
Geographical mobility - Moved from different county within same state (%) - Multirace
Geographical mobility - Moved from different county within same state (%) - Other Race
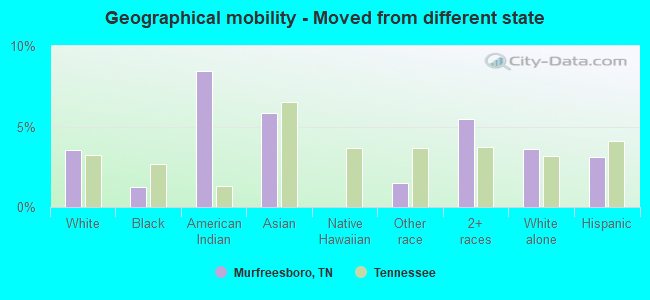
Geographical mobility - Moved from different state (%)
Geographical mobility - Moved from different state (%) - White
Geographical mobility - Moved from different state (%) - Black or African American
Geographical mobility - Moved from different state (%) - Asian
Geographical mobility - Moved from different state (%) - Hispanic or Latino
Geographical mobility - Moved from different state (%) - American Indian and Alaska Native
Geographical mobility - Moved from different state (%) - Multirace
Geographical mobility - Moved from different state (%) - Other Race
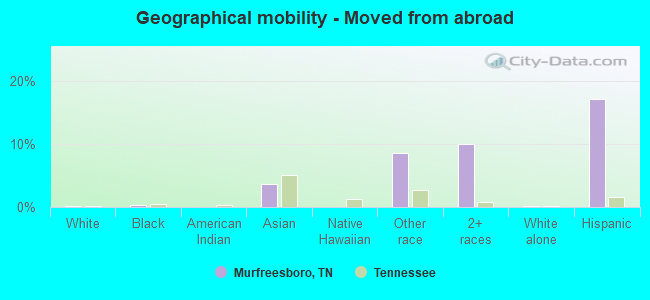
Geographical mobility - Moved from abroad (%)
Geographical mobility - Moved from abroad (%) - White
Geographical mobility - Moved from abroad (%) - Black or African American
Geographical mobility - Moved from abroad (%) - Asian
Geographical mobility - Moved from abroad (%) - Hispanic or Latino
Geographical mobility - Moved from abroad (%) - American Indian and Alaska Native
Geographical mobility - Moved from abroad (%) - Multirace
Geographical mobility - Moved from abroad (%) - Other Race
Place of birth for the foreign-born population - Ireland (%)
Place of birth for the foreign-born population - Denmark (%)
Place of birth for the foreign-born population - Norway (%)
Place of birth for the foreign-born population - Sweden (%)
Place of birth for the foreign-born population - United Kingdom (%)
Place of birth for the foreign-born population - England (%)
Place of birth for the foreign-born population - Scotland (%)
Place of birth for the foreign-born population - Other Northern Europe (%)
Place of birth for the foreign-born population - Austria (%)
Place of birth for the foreign-born population - Belgium (%)
Place of birth for the foreign-born population - France (%)
Place of birth for the foreign-born population - Germany (%)
Place of birth for the foreign-born population - Netherlands (%)
Place of birth for the foreign-born population - Switzerland (%)
Place of birth for the foreign-born population - Other Western Europe (%)
Place of birth for the foreign-born population - Greece (%)
Place of birth for the foreign-born population - Italy (%)
Place of birth for the foreign-born population - Portugal (%)
Place of birth for the foreign-born population - Spain (%)
Place of birth for the foreign-born population - Other Southern Europe (%)
Place of birth for the foreign-born population - Albania (%)
Place of birth for the foreign-born population - Belarus (%)
Place of birth for the foreign-born population - Bosnia and Herzegovina (%)
Place of birth for the foreign-born population - Bulgaria (%)
Place of birth for the foreign-born population - Croatia (%)
Place of birth for the foreign-born population - Czechoslovakia (%)
Place of birth for the foreign-born population - Hungary (%)
Place of birth for the foreign-born population - Latvia (%)
Place of birth for the foreign-born population - Lithuania (%)
Place of birth for the foreign-born population - North Macedonia (Macedonia) (%)
Place of birth for the foreign-born population - Moldova (%)
Place of birth for the foreign-born population - Poland (%)
Place of birth for the foreign-born population - Romania (%)
Place of birth for the foreign-born population - Russia (%)
Place of birth for the foreign-born population - Serbia (%)
Place of birth for the foreign-born population - Ukraine (%)
Place of birth for the foreign-born population - Other Eastern Europe (%)
Place of birth for the foreign-born population - China (%)
Place of birth for the foreign-born population - Hong Kong (%)
Place of birth for the foreign-born population - Taiwan (%)
Place of birth for the foreign-born population - Japan (%)
Place of birth for the foreign-born population - Korea (%)
Place of birth for the foreign-born population - Other Eastern Asia (%)
Place of birth for the foreign-born population - Afghanistan (%)
Place of birth for the foreign-born population - Bangladesh (%)
Place of birth for the foreign-born population - India (%)
Place of birth for the foreign-born population - Iran (%)
Place of birth for the foreign-born population - Kazakhstan (%)
Place of birth for the foreign-born population - Nepal (%)
Place of birth for the foreign-born population - Pakistan (%)
Place of birth for the foreign-born population - Sri Lanka (%)
Place of birth for the foreign-born population - Uzbekistan (%)
Place of birth for the foreign-born population - Other South Central Asia (%)
Place of birth for the foreign-born population - Burma (%)
Place of birth for the foreign-born population - Cambodia (%)
Place of birth for the foreign-born population - Indonesia (%)
Place of birth for the foreign-born population - Laos (%)
Place of birth for the foreign-born population - Malaysia (%)
Place of birth for the foreign-born population - Philippines (%)
Place of birth for the foreign-born population - Singapore (%)
Place of birth for the foreign-born population - Thailand (%)
Place of birth for the foreign-born population - Vietnam (%)
Place of birth for the foreign-born population - Other South Eastern Asia (%)
Place of birth for the foreign-born population - Armenia (%)
Place of birth for the foreign-born population - Iraq (%)
Place of birth for the foreign-born population - Israel (%)
Place of birth for the foreign-born population - Jordan (%)
Place of birth for the foreign-born population - Kuwait (%)
Place of birth for the foreign-born population - Lebanon (%)
Place of birth for the foreign-born population - Saudi Arabia (%)
Place of birth for the foreign-born population - Syria (%)
Place of birth for the foreign-born population - Turkey (%)
Place of birth for the foreign-born population - Yemen (%)
Place of birth for the foreign-born population - Other Western Asia (%)
Place of birth for the foreign-born population - Eritrea (%)
Place of birth for the foreign-born population - Ethiopia (%)
Place of birth for the foreign-born population - Kenya (%)
Place of birth for the foreign-born population - Somalia (%)
Place of birth for the foreign-born population - Uganda (%)
Place of birth for the foreign-born population - Zimbabwe (%)
Place of birth for the foreign-born population - Other Eastern Africa (%)
Place of birth for the foreign-born population - Cameroon (%)
Place of birth for the foreign-born population - Congo (%)
Place of birth for the foreign-born population - Democratic Republic of Congo (Zaire) (%)
Place of birth for the foreign-born population - Other Middle Africa (%)
Place of birth for the foreign-born population - Egypt (%)
Place of birth for the foreign-born population - Morocco (%)
Place of birth for the foreign-born population - Sudan (%)
Place of birth for the foreign-born population - Other Northern Africa (%)
Place of birth for the foreign-born population - South Africa (%)
Place of birth for the foreign-born population - Other Southern Africa (%)
Place of birth for the foreign-born population - Cabo Verde (%)
Place of birth for the foreign-born population - Ghana (%)
Place of birth for the foreign-born population - Liberia (%)
Place of birth for the foreign-born population - Nigeria (%)
Place of birth for the foreign-born population - Senegal (%)
Place of birth for the foreign-born population - Sierra Leone (%)
Place of birth for the foreign-born population - Other Western Africa (%)
Place of birth for the foreign-born population - Australia (%)
Place of birth for the foreign-born population - New Zealand (%)
Place of birth for the foreign-born population - Fiji (%)
Place of birth for the foreign-born population - Micronesia (%)
Place of birth for the foreign-born population - Bahamas (%)
Place of birth for the foreign-born population - Barbados (%)
Place of birth for the foreign-born population - Cuba (%)
Place of birth for the foreign-born population - Dominica (%)
Place of birth for the foreign-born population - Dominican Republic (%)
Place of birth for the foreign-born population - Grenada (%)
Place of birth for the foreign-born population - Haiti (%)
Place of birth for the foreign-born population - Jamaica (%)
Place of birth for the foreign-born population - St. Vincent and the Grenadines (%)
Place of birth for the foreign-born population - Trinidad and Tobago (%)
Place of birth for the foreign-born population - West Indies (%)
Place of birth for the foreign-born population - Other Caribbean (%)
Place of birth for the foreign-born population - Belize (%)
Place of birth for the foreign-born population - Costa Rica (%)
Place of birth for the foreign-born population - El Salvador (%)
Place of birth for the foreign-born population - Guatemala (%)
Place of birth for the foreign-born population - Honduras (%)
Place of birth for the foreign-born population - Mexico (%)
Place of birth for the foreign-born population - Nicaragua (%)
Place of birth for the foreign-born population - Panama (%)
Place of birth for the foreign-born population - Other Central America (%)
Place of birth for the foreign-born population - Argentina (%)
Place of birth for the foreign-born population - Bolivia (%)
Place of birth for the foreign-born population - Brazil (%)
Place of birth for the foreign-born population - Chile (%)
Place of birth for the foreign-born population - Colombia (%)
Place of birth for the foreign-born population - Ecuador (%)
Place of birth for the foreign-born population - Guyana (%)
Place of birth for the foreign-born population - Peru (%)
Place of birth for the foreign-born population - Uruguay (%)
Place of birth for the foreign-born population - Venezuela (%)
Place of birth for the foreign-born population - Other South America (%)
Place of birth for the foreign-born population - Canada (%)
Place of birth for the foreign-born population - Other Northern America (%)
Place of birth for the foreign-born population - Other (%)
Latest news about races in Murfreesboro, TN collected exclusively by city-data.com from local newspapers, TV, and radio stations
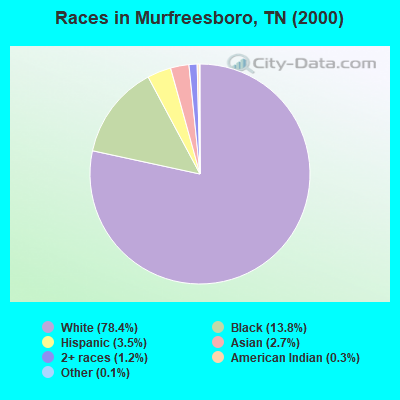
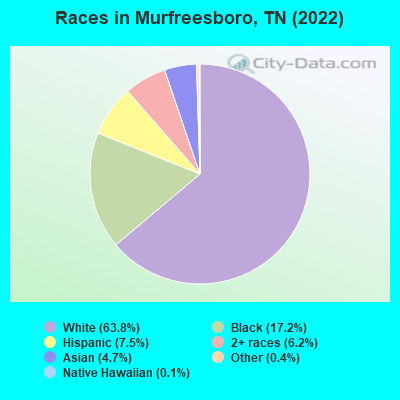
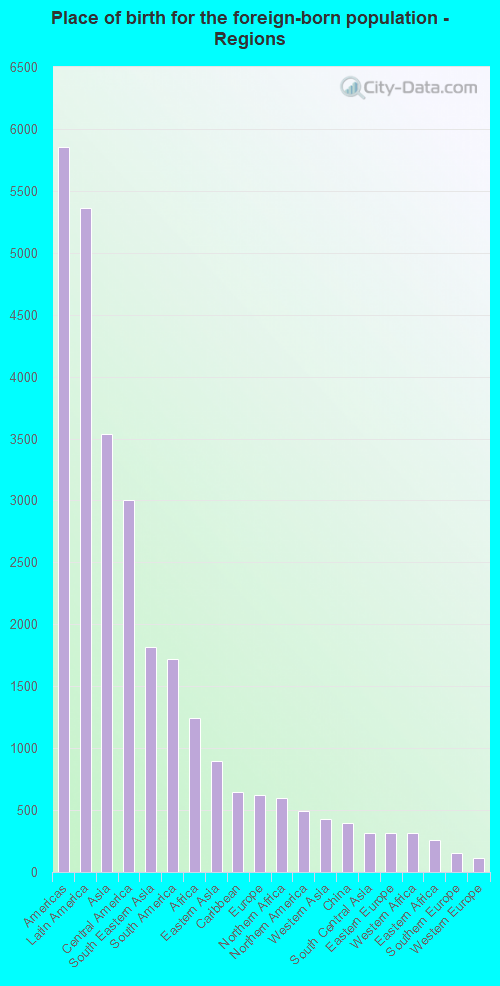
According to 2022 data, the most numerous races in Murfreesboro, TN are White alone (103,547 residents), Black alone (27,993 residents), and Hispanic (12,108 residents). 84.8% of Murfreesboro residents speak English at home. 7.0% of Murfreesboro, TN residents are foreign-born (3.3% born in Latin America, 2.2% born in Asia, 0.8% born in Africa), which is 28.7% greater than the foreign-born rate of 5.0% across the entire state of Tennessee.
Race distribution in Murfreesboro
2000 2022
4,505,930 79.2% White alone 928,204 16.3% Black alone 123,838 2.2% Hispanic 54,824 1.0% Two or more races 56,077 1.0% Asian alone 13,820 0.2% American Indian alone 4,780 0.08% Other race alone 1,810 0.03% Native Hawaiian and Other
5,070,026 71.9% White alone 1,089,738 15.5% Black alone 442,629 6.3% Hispanic 279,381 4.0% Two or more races 131,817 1.9% Asian alone 26,972 0.4% Other race alone 6,387 0.09% American Indian alone 4,389 0.06% Native Hawaiian and Other
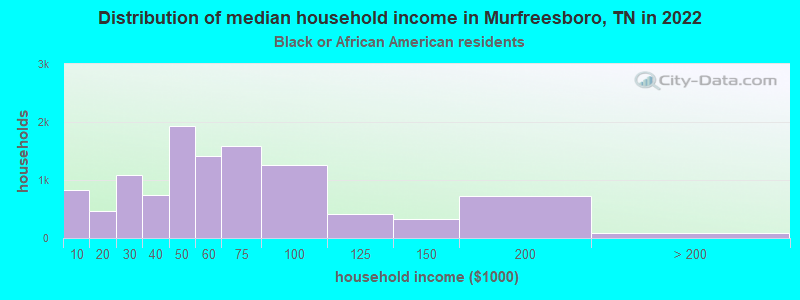
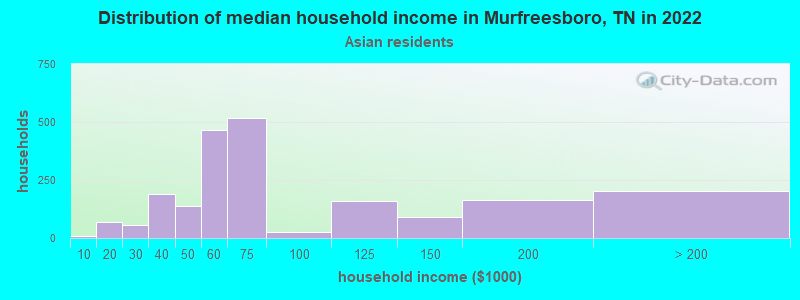
Income and house value in Murfreesboro Median household income in 2022 $77,191 White non-Hispanic householders$51,223 Black householders$46,750 Asian householders$36,746 Some other race householders$69,077 Two or more races householders$64,574 Hispanic or Latino race householdersMedian 2022 house value $433,179 White Non-Hispanic householders$311,162 Black or African American householders$312,560 American Indian or Alaska Native householders $456,953 Asian householders$334,236 Some other race householders$353,116 Two or more races householders$345,424 Hispanic or Latino householders
Median age by race in Murfreesboro
33.5 Median age for White residents30.9 36.7 28.3 Median age for Black or African American residents26.8 29.8 19.3 Median age for American Indian / Alaska Native residents16.8 38.3 31.5 Median age for Asian residents34.0 31.4 -666,666,666.0 Median age for Native Hawaiian / Pacific Islander residents-666,666,666.0 -666,666,666.0 26.3 Median age for Other race residents26.6 25.7 24.7 Median age for Two or more races residents24.6 25.6 33.9 Median age for White alone residents31.1 37.3 25.8 Median age for Hispanic or Latino residents26.2 25.4
Owner/renter occupied households by race in Murfreesboro
House owners and renters - White residents 26,510 61.5% Owner occupied16,603 38.5% Renter occupiedHouse owners and renters - Black or African American residents 2,876 26.5% Owner occupied7,974 73.5% Renter occupiedHouse owners and renters - American Indian / Alaska Native residents 14 58.3% Owner occupied10 41.7% Renter occupiedHouse owners and renters - Asian residents 1,955 77.7% Owner occupied562 22.3% Renter occupiedHouse owners and renters - Native Hawaiian / Pacific Islander residents 70 100.0% Owner occupiedHouse owners and renters - Other race residents 272 27.4% Owner occupied721 72.6% Renter occupiedHouse owners and renters - Two or more races residents 1,487 32.0% Owner occupied3,166 68.0% Renter occupiedHouse owners and renters - White alone residents 26,301 61.9% Owner occupied16,207 38.1% Renter occupiedHouse owners and renters - Hispanic or Latino residents 634 21.3% Owner occupied2,343 78.7% Renter occupied
Language usage in Murfreesboro
English speakers - Total 84.8% of residents of Murfreesboro speak English at home.
4.6% of residents speak Spanish at home 2,888 41.4% Speak English very well4,096 58.6% Speak English less than very well10.7% of residents speak other language at home 10,004 61.5% Speak English very well6,265 38.5% Speak English less than very well
English speakers - Born in the United States 96.1% of residents of Murfreesboro speak English at home.
1.9% of residents speak Spanish at home 967 90.8% Speak English very well98 9.2% Speak English less than very well2.0% of residents speak other language at home 957 86.5% Speak English very well149 13.5% Speak English less than very well
English speakers - Native, born elsewhere 72.7% of residents of Murfreesboro speak English at home.
23.5% of residents speak Spanish at home 129 32.2% Speak English very well271 67.8% Speak English less than very well3.7% of residents speak other language at home 63 100.0% Speak English very well
English speakers - Foreign-born 9.8% of residents of Murfreesboro speak English at home.
25.9% of residents speak Spanish at home 1,092 23.7% Speak English very well3,519 76.3% Speak English less than very well64.3% of residents speak other language at home 6,398 56.0% Speak English very well5,026 44.0% Speak English less than very well
White (Caucasian) - Speak only English Native:
96.8% (93,321)Foreign-born:
14.5% (579)
White (Caucasian) - Speak another language Native:
3.2% (3,122)Foreign-born:
85.5% (3,414)
Black or African American - Speak only English Native:
94.4% (22,921)Foreign-born:
57.9% (1,199)
Black or African American - Speak another language Native:
6.2% (1,495)Foreign-born:
16.2% (335)
American Indian / Alaska Native - Speak another language Native:
8.5% (13)Foreign-born:
100.0% (23)
Asian - Speak only English Native:
26.1% (632)Foreign-born:
3.3% (152)
Asian - Speak another language Native:
73.9% (1,790)Foreign-born:
96.7% (4,501)
Native Hawaiian / Pacific Islander - Speak another language Native:
37.3% (77)Foreign-born:
100.0% (103)
Other race - Speak only English Native:
62.9% (1,030)Foreign-born:
10.7% (193)
Other race - Speak another language Native:
43.1% (706)Foreign-born:
91.6% (1,647)
Two or more races - Speak only English Native:
88.6% (8,816)Foreign-born:
2.8% (130)
Two or more races - Speak another language Native:
9.9% (988)Foreign-born:
97.0% (4,537)
White alone - Speak only English Native:
97.3% (91,980)Foreign-born:
14.7% (579)
White alone - Speak another language Native:
2.7% (2,528)Foreign-born:
85.3% (3,371)
Hispanic or Latino - Speak another language Native:
29.6% (1,863)Foreign-born:
100.0% (4,634)
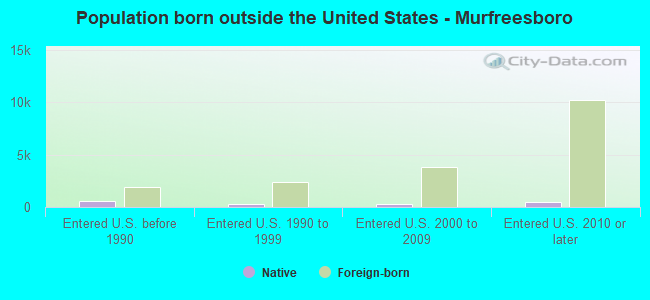
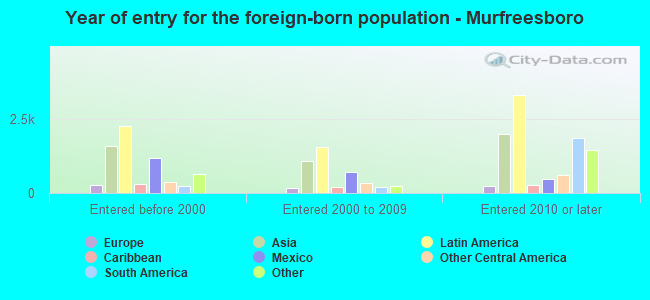
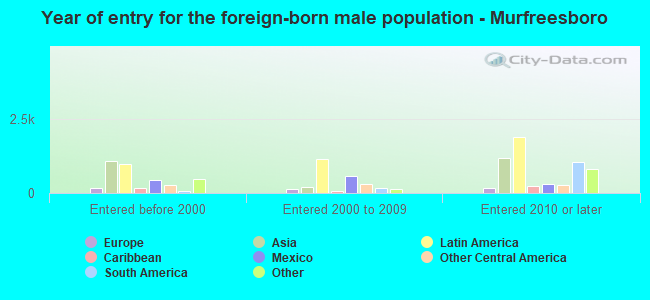
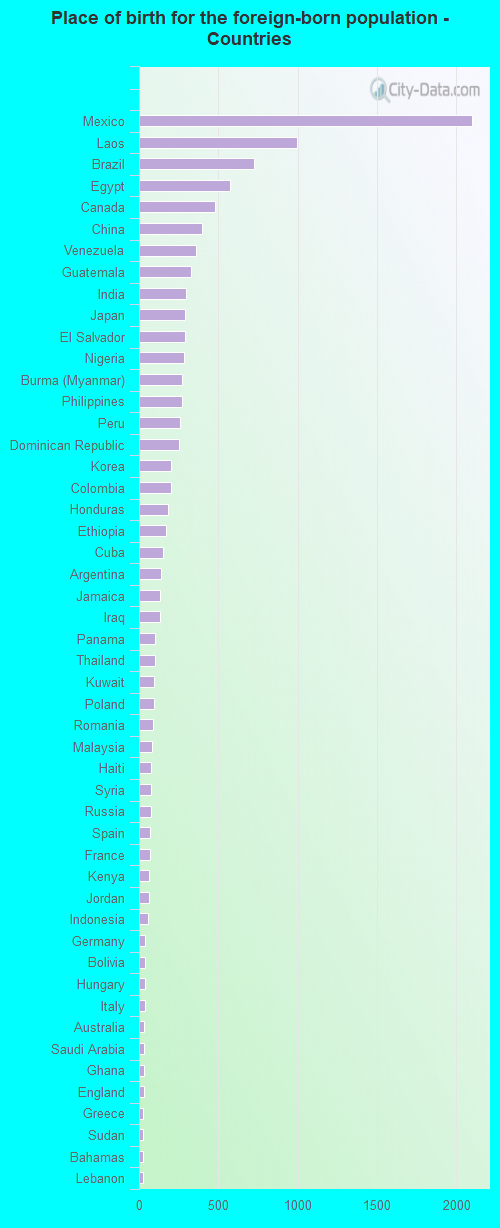
Foreign-born residents in Murfreesboro 11,290 residents are foreign born (3.3% Latin America , 2.2% Asia , 0.8% Africa ).
This city:
7.0%Tennessee:
5.4%
Marital status for residents in Murfreesboro Marital status - White (Caucasian) population 15 years and over
Males 43.9% Never married48.1% Now married0.1% Separated1.8% Widowed6.1% DivorcedFemales 26.9% Never married45.5% Now married1.4% Separated10.4% Widowed15.8% DivorcedWomen who gave birth in the past 12 months Now married:
100.0% (1,121)Unmarried:
0.0% (0)
Women who did not give birth in the past 12 months Now married:
46.4% (12,044)Unmarried:
53.6% (13,900)
Marital status - Black or African American population 15 years and over
Males 59.4% Never married33.3% Now married0.8% Separated1.9% Widowed4.6% DivorcedFemales 67.1% Never married22.6% Now married3.4% Separated0.7% Widowed6.2% DivorcedWomen who gave birth in the past 12 months Now married:
10.7% (56)Unmarried:
89.3% (469)
Women who did not give birth in the past 12 months Now married:
20.2% (1,810)Unmarried:
79.8% (7,165)
Marital status - American Indian / Alaska Native population 15 years and over
Males 86.5% Never married13.5% Now married0.0% Separated0.0% Widowed0.0% DivorcedFemales 66.7% Never married28.7% Now married0.0% Separated0.0% Widowed4.6% DivorcedWomen who did not give birth in the past 12 months Now married:
13.3% (13)Unmarried:
86.7% (85)
Marital status - Asian population 15 years and over
Males 48.7% Never married38.9% Now married6.5% Separated0.0% Widowed5.9% DivorcedFemales 31.4% Never married60.8% Now married1.1% Separated2.1% Widowed4.6% DivorcedWomen who gave birth in the past 12 months Now married:
60.7% (20)Unmarried:
39.3% (13)
Women who did not give birth in the past 12 months Now married:
61.1% (1,233)Unmarried:
38.9% (786)
Marital status - Native Hawaiian / Pacific Islander population 15 years and over
Males 0.0% Never married100.0% Now married0.0% Separated0.0% Widowed0.0% DivorcedFemales 41.1% Never married58.9% Now married0.0% Separated0.0% Widowed0.0% DivorcedWomen who gave birth in the past 12 months Now married:
100.0% (68)Unmarried:
0.0% (0)
Women who did not give birth in the past 12 months Now married:
14.7% (9)Unmarried:
85.3% (54)
Marital status - Other race population 15 years and over
Males 48.8% Never married47.1% Now married0.0% Separated1.7% Widowed2.4% DivorcedFemales 38.9% Never married53.8% Now married3.1% Separated3.3% Widowed0.8% DivorcedWomen who gave birth in the past 12 months Now married:
100.0% (274)Unmarried:
0.0% (0)
Women who did not give birth in the past 12 months Now married:
40.7% (316)Unmarried:
59.3% (460)
Marital status - Two or more races population 15 years and over
Males 74.8% Never married16.2% Now married0.0% Separated2.9% Widowed6.1% DivorcedFemales 37.6% Never married32.0% Now married0.0% Separated3.6% Widowed26.9% DivorcedWomen who gave birth in the past 12 months Now married:
68.0% (394)Unmarried:
32.0% (185)
Women who did not give birth in the past 12 months Now married:
32.5% (1,084)Unmarried:
67.5% (2,246)
Marital status - White alone, not Hispanic / Latino population 15 years and over
Males 43.8% Never married48.1% Now married0.1% Separated1.8% Widowed6.2% DivorcedFemales 27.0% Never married45.4% Now married1.4% Separated10.6% Widowed15.6% DivorcedWomen who gave birth in the past 12 months Now married:
100.0% (1,121)Unmarried:
0.0% (0)
Women who did not give birth in the past 12 months Now married:
46.3% (11,779)Unmarried:
53.7% (13,654)
Marital status - Hispanic or Latino population 15 years and over
Males 55.8% Never married37.3% Now married2.4% Separated1.6% Widowed2.9% DivorcedFemales 32.6% Never married57.6% Now married3.3% Separated3.2% Widowed3.3% DivorcedWomen who gave birth in the past 12 months Now married:
95.4% (508)Unmarried:
4.6% (25)
Women who did not give birth in the past 12 months Now married:
46.8% (1,213)Unmarried:
53.2% (1,377)
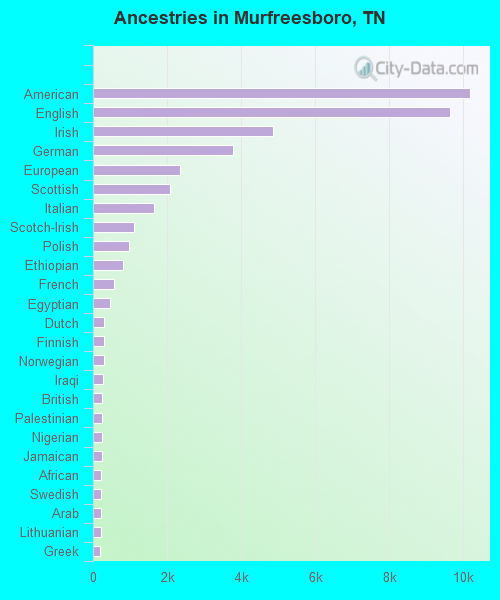
Ancestries in Murfreesboro
10,189 12.6% American9,633 11.9% English4,868 6.0% Irish3,775 4.7% German2,357 2.9% European2,084 2.6% Scottish1,636 2.0% Italian1,099 1.4% Scotch-Irish978 1.2% Polish815 1.0% Ethiopian564 0.7% French467 0.6% Egyptian302 0.4% Dutch287 0.4% Finnish285 0.4% Norwegian281 0.3% Iraqi252 0.3% British248 0.3% Palestinian237 0.3% Nigerian230 0.3% Jamaican226 0.3% African225 0.3% Swedish218 0.3% Arab212 0.3% Lithuanian179 0.2% Greek168 0.2% Kenyan146 0.2% Welsh146 0.2% Hungarian140 0.2% French Canadian136 0.2% Scandinavian127 0.2% Russian106 0.1% Danish105 0.1% Portuguese74 0.09% Czech70 0.09% Romanian59 0.07% Jordanian59 0.07% Eastern European57 0.07% Bulgarian55 0.07% Haitian54 0.07% West Indian53 0.07% Sudanese44 0.05% Slovak41 0.05% Armenian37 0.05% Lebanese30 0.04% Icelander30 0.04% Swiss28 0.03% Ukrainian27 0.03% Yugoslavian23 0.03% Northern European18 0.02% Bahamian15 0.02% Canadian15 0.02% Austrian15 0.02% U.S. Virgin Islander10 0.01% Czechoslovakian10 0.01% Celtic10 0.01% Liberian
Geographical mobility in Murfreesboro Same house 1 year ago 86,644 82.7% White (Caucasian)21,622 77.2% Black or African American156 91.5% American Indian / Alaska Native4,860 85.3% Asian435 100.0% Native Hawaiian / Pacific Islander2,351 63.7% Other race10,341 67.3% Two or more races85,477 83.2% White alone, not Hispanic / Latino6,661 56.6% Hispanic or LatinoMoved within same county 7,351 7.0% White / Caucasian4,400 15.7% Black or African American4 2.2% American Indian / Alaska Native144 2.5% Asian390 10.6% Other race1,527 9.9% Two or more races6,453 6.3% White alone, not Hispanic / Latino2,031 17.3% Hispanic or LatinoMoved within same state 6,961 6.6% White / Caucasian1,564 5.6% Black or African American14 8.0% American Indian / Alaska Native147 2.6% Asian119 3.2% Other race1,121 7.3% Two or more races6,961 6.8% White alone, not Hispanic / Latino690 5.9% Hispanic or LatinoMoved from different state 3,685 3.5% White / Caucasian347 1.2% Black or African American14 8.5% American Indian / Alaska Native331 5.8% Asian55 1.5% Other race839 5.5% Two or more races3,685 3.6% White alone, not Hispanic / Latino363 3.1% Hispanic or LatinoMoved from abroad 133 0.1% White87 0.3% Black or African American210 3.7% Asian314 8.5% Other race1,534 10.0% Two or more races133 0.1% White alone, not Hispanic / Latino2,014 17.1% Hispanic or Latino
Children Nativity (place of birth) in Murfreesboro
Children under 6 years - Living with two parents Both parents native 6,649 100.0% NativeBoth parents foreign-born 622 54.8% Native514 45.2% Foreign-bornOne native, one foreign-born parent 884 100.0% NativeChildren under 6 years - Living with one parent Native parent 2,352 100.0% NativeForeign-born parent 1,229 100.0% NativeChildren 6 to 17 years - Living with two parents Both parents native 11,409 100.0% NativeBoth parents foreign-born 1,728 43.8% Native2,218 56.2% Foreign-bornOne native, one foreign-born parent 630 100.0% NativeChildren 6 to 17 years - Living with one parent Native parent 5,816 100.0% NativeForeign-born parent 2,337 61.7% Native1,449 38.3% Foreign-born
Grandparents responsible for own grandchildren in Murfreesboro
Grandparents (30 to 59 years) White / Caucasian 152 32.0% Responsible for grandchildren324 68.0% Not responsible for grandchildrenBlack or African American 230 66.5% Responsible for grandchildren116 33.5% Not responsible for grandchildrenAsian 11 100.0% Responsible for grandchildrenNative Hawaiian / Pacific Islander 37 100.0% Not responsible for grandchildrenTwo or more races 43 69.2% Responsible for grandchildren19 30.8% Not responsible for grandchildrenWhite alone, not Hispanic / Latino 146 33.7% Responsible for grandchildren288 66.3% Not responsible for grandchildrenHispanic or Latino 13 22.4% Responsible for grandchildren46 77.6% Not responsible for grandchildrenGrandparents (60 years and over) White / Caucasian 293 54.0% Responsible for grandchildren250 46.0% Not responsible for grandchildrenBlack or African American 146 40.0% Responsible for grandchildren220 60.0% Not responsible for grandchildrenAsian 15 100.0% Not responsible for grandchildrenTwo or more races 3 3.2% Responsible for grandchildren77 96.8% Not responsible for grandchildrenWhite alone, not Hispanic / Latino 297 52.1% Responsible for grandchildren274 47.9% Not responsible for grandchildrenHispanic or Latino 1 2.4% Responsible for grandchildren46 97.6% Not responsible for grandchildren