Races in Murraysville, North Carolina (NC) Detailed Stats
Data:
Races - White alone (%)
Races - White alone (% change since 2000)
Races - Black alone (%)
Races - Black alone (% change since 2000)
Races - American Indian alone (%)
Races - American Indian alone (% change since 2000)
Races - Asian alone (%)
Races - Asian alone (% change since 2000)
Races - Hispanic (%)
Races - Hispanic (% change since 2000)
Races - Native Hawaiian and Other Pacific Islander alone (%)
Races - Native Hawaiian and Other Pacific Islander alone (% change since 2000)
Races - Two or more races(%)
Races - Two or more races(% change since 2000)
Races - Other race alone (%)
Races - Other race alone (% change since 2000)
Racial diversity
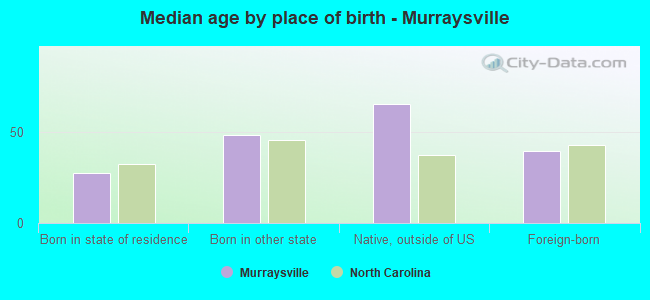
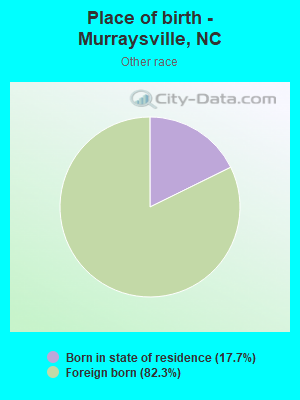
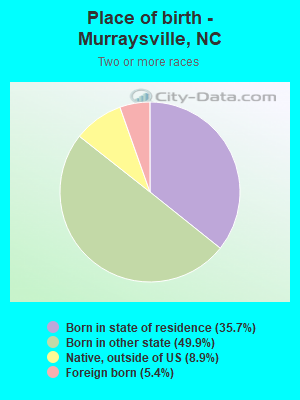
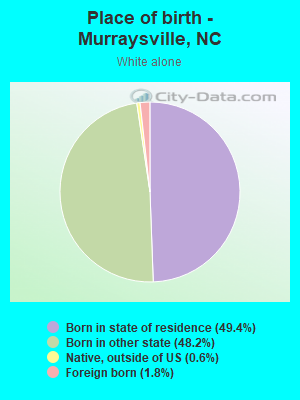
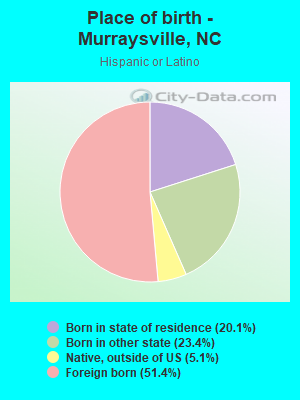
Place of birth - Born in state of residence (%)
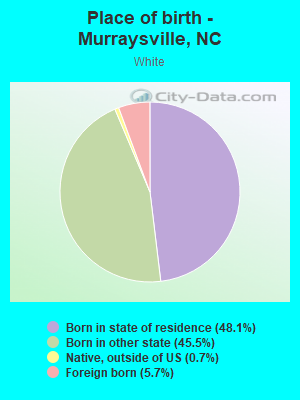
Place of birth - Born in state of residence (%) - White
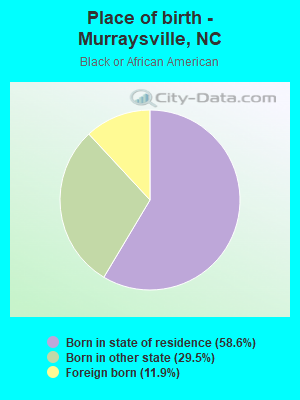
Place of birth - Born in state of residence (%) - Black or African American
Place of birth - Born in state of residence (%) - Asian
Place of birth - Born in state of residence (%) - Hispanic or Latino
Place of birth - Born in state of residence (%) - American Indian and Alaska Native
Place of birth - Born in state of residence (%) - Multirace
Place of birth - Born in state of residence (%) - Other Race
Place of birth - Born in other state (%)
Place of birth - Born in other state (%) - White
Place of birth - Born in other state (%) - Black or African American
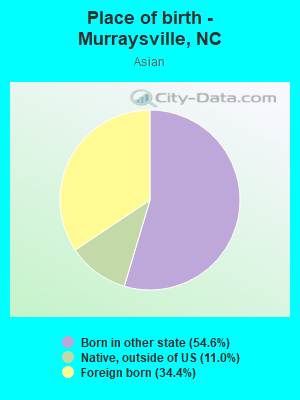
Place of birth - Born in other state (%) - Asian
Place of birth - Born in other state (%) - Hispanic or Latino
Place of birth - Born in other state (%) - American Indian and Alaska Native
Place of birth - Born in other state (%) - Multirace
Place of birth - Born in other state (%) - Other Race
Place of birth - Native, outside of US (%)
Place of birth - Native, outside of US (%) - White
Place of birth - Native, outside of US (%) - Black or African American
Place of birth - Native, outside of US (%) - Asian
Place of birth - Native, outside of US (%) - Hispanic or Latino
Place of birth - Native, outside of US (%) - American Indian and Alaska Native
Place of birth - Native, outside of US (%) - Multirace
Place of birth - Native, outside of US (%) - Other Race
Place of birth - Foreign born (%)
Place of birth - Foreign born (%) - White
Place of birth - Foreign born (%) - Black or African American
Place of birth - Foreign born (%) - Asian
Place of birth - Foreign born (%) - Hispanic or Latino
Place of birth - Foreign born (%) - American Indian and Alaska Native
Place of birth - Foreign born (%) - Multirace
Place of birth - Foreign born (%) - Other Race
Residents speaking English at home (%)
Residents speaking English at home - Born in the United States (%)
Residents speaking English at home - Native, born elsewhere (%)
Residents speaking English at home - Foreign born (%)
Residents speaking Spanish at home (%)
Residents speaking Spanish at home - Born in the United States (%)
Residents speaking Spanish at home - Native, born elsewhere (%)
Residents speaking Spanish at home - Foreign born (%)
Residents speaking other language at home (%)
Residents speaking other language at home - Born in the United States (%)
Residents speaking other language at home - Native, born elsewhere (%)
Residents speaking other language at home - Foreign born (%)
Marital status - Never married (%)
Marital status - Now married (%)
Marital status - Separated (%)
Marital status - Widowed (%)
Marital status - Divorced (%)
Ancestries Reported - Arab (%)
Ancestries Reported - Czech (%)
Ancestries Reported - Danish (%)
Ancestries Reported - Dutch (%)
Ancestries Reported - English (%)
Ancestries Reported - French (%)
Ancestries Reported - French Canadian (%)
Ancestries Reported - German (%)
Ancestries Reported - Greek (%)
Ancestries Reported - Hungarian (%)
Ancestries Reported - Irish (%)
Ancestries Reported - Italian (%)
Ancestries Reported - Lithuanian (%)
Ancestries Reported - Norwegian (%)
Ancestries Reported - Polish (%)
Ancestries Reported - Portuguese (%)
Ancestries Reported - Russian (%)
Ancestries Reported - Scotch-Irish (%)
Ancestries Reported - Scottish (%)
Ancestries Reported - Slovak (%)
Ancestries Reported - Subsaharan African (%)
Ancestries Reported - Swedish (%)
Ancestries Reported - Swiss (%)
Ancestries Reported - Ukrainian (%)
Ancestries Reported - United States (%)
Ancestries Reported - Welsh (%)
Ancestries Reported - West Indian (%)
Ancestries Reported - Other (%)
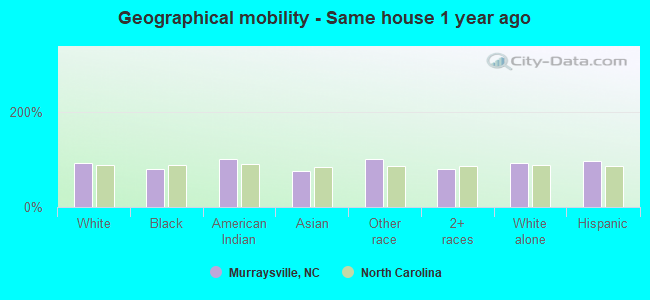
Geographical mobility - Same house 1 year ago (%)
Geographical mobility - Same house 1 year ago (%) - White
Geographical mobility - Same house 1 year ago (%) - Black or African American
Geographical mobility - Same house 1 year ago (%) - Asian
Geographical mobility - Same house 1 year ago (%) - Hispanic or Latino
Geographical mobility - Same house 1 year ago (%) - American Indian and Alaska Native
Geographical mobility - Same house 1 year ago (%) - Multirace
Geographical mobility - Same house 1 year ago (%) - Other Race
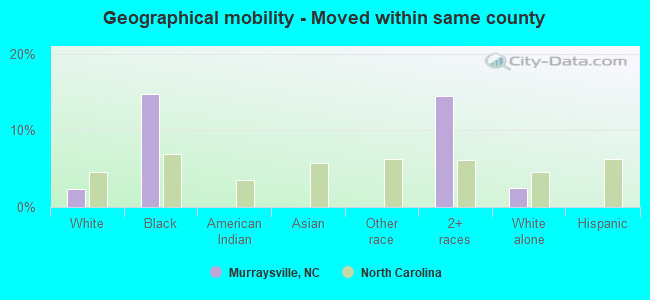
Geographical mobility - Moved within same county (%)
Geographical mobility - Moved within same county (%) - White
Geographical mobility - Moved within same county (%) - Black or African American
Geographical mobility - Moved within same county (%) - Asian
Geographical mobility - Moved within same county (%) - Hispanic or Latino
Geographical mobility - Moved within same county (%) - American Indian and Alaska Native
Geographical mobility - Moved within same county (%) - Multirace
Geographical mobility - Moved within same county (%) - Other Race
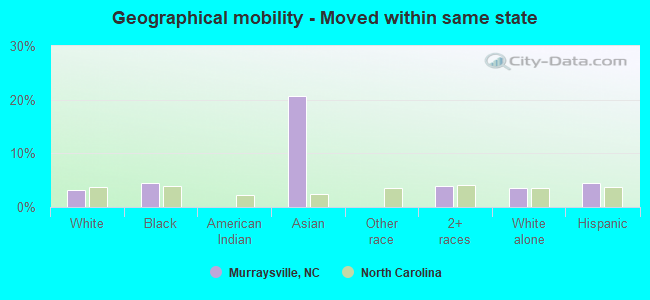
Geographical mobility - Moved from different county within same state (%)
Geographical mobility - Moved from different county within same state (%) - White
Geographical mobility - Moved from different county within same state (%) - Black or African American
Geographical mobility - Moved from different county within same state (%) - Asian
Geographical mobility - Moved from different county within same state (%) - Hispanic or Latino
Geographical mobility - Moved from different county within same state (%) - American Indian and Alaska Native
Geographical mobility - Moved from different county within same state (%) - Multirace
Geographical mobility - Moved from different county within same state (%) - Other Race
Geographical mobility - Moved from different state (%)
Geographical mobility - Moved from different state (%) - White
Geographical mobility - Moved from different state (%) - Black or African American
Geographical mobility - Moved from different state (%) - Asian
Geographical mobility - Moved from different state (%) - Hispanic or Latino
Geographical mobility - Moved from different state (%) - American Indian and Alaska Native
Geographical mobility - Moved from different state (%) - Multirace
Geographical mobility - Moved from different state (%) - Other Race
Geographical mobility - Moved from abroad (%)
Geographical mobility - Moved from abroad (%) - White
Geographical mobility - Moved from abroad (%) - Black or African American
Geographical mobility - Moved from abroad (%) - Asian
Geographical mobility - Moved from abroad (%) - Hispanic or Latino
Geographical mobility - Moved from abroad (%) - American Indian and Alaska Native
Geographical mobility - Moved from abroad (%) - Multirace
Geographical mobility - Moved from abroad (%) - Other Race
Place of birth for the foreign-born population - Ireland (%)
Place of birth for the foreign-born population - Denmark (%)
Place of birth for the foreign-born population - Norway (%)
Place of birth for the foreign-born population - Sweden (%)
Place of birth for the foreign-born population - United Kingdom (%)
Place of birth for the foreign-born population - England (%)
Place of birth for the foreign-born population - Scotland (%)
Place of birth for the foreign-born population - Other Northern Europe (%)
Place of birth for the foreign-born population - Austria (%)
Place of birth for the foreign-born population - Belgium (%)
Place of birth for the foreign-born population - France (%)
Place of birth for the foreign-born population - Germany (%)
Place of birth for the foreign-born population - Netherlands (%)
Place of birth for the foreign-born population - Switzerland (%)
Place of birth for the foreign-born population - Other Western Europe (%)
Place of birth for the foreign-born population - Greece (%)
Place of birth for the foreign-born population - Italy (%)
Place of birth for the foreign-born population - Portugal (%)
Place of birth for the foreign-born population - Spain (%)
Place of birth for the foreign-born population - Other Southern Europe (%)
Place of birth for the foreign-born population - Albania (%)
Place of birth for the foreign-born population - Belarus (%)
Place of birth for the foreign-born population - Bosnia and Herzegovina (%)
Place of birth for the foreign-born population - Bulgaria (%)
Place of birth for the foreign-born population - Croatia (%)
Place of birth for the foreign-born population - Czechoslovakia (%)
Place of birth for the foreign-born population - Hungary (%)
Place of birth for the foreign-born population - Latvia (%)
Place of birth for the foreign-born population - Lithuania (%)
Place of birth for the foreign-born population - North Macedonia (Macedonia) (%)
Place of birth for the foreign-born population - Moldova (%)
Place of birth for the foreign-born population - Poland (%)
Place of birth for the foreign-born population - Romania (%)
Place of birth for the foreign-born population - Russia (%)
Place of birth for the foreign-born population - Serbia (%)
Place of birth for the foreign-born population - Ukraine (%)
Place of birth for the foreign-born population - Other Eastern Europe (%)
Place of birth for the foreign-born population - China (%)
Place of birth for the foreign-born population - Hong Kong (%)
Place of birth for the foreign-born population - Taiwan (%)
Place of birth for the foreign-born population - Japan (%)
Place of birth for the foreign-born population - Korea (%)
Place of birth for the foreign-born population - Other Eastern Asia (%)
Place of birth for the foreign-born population - Afghanistan (%)
Place of birth for the foreign-born population - Bangladesh (%)
Place of birth for the foreign-born population - India (%)
Place of birth for the foreign-born population - Iran (%)
Place of birth for the foreign-born population - Kazakhstan (%)
Place of birth for the foreign-born population - Nepal (%)
Place of birth for the foreign-born population - Pakistan (%)
Place of birth for the foreign-born population - Sri Lanka (%)
Place of birth for the foreign-born population - Uzbekistan (%)
Place of birth for the foreign-born population - Other South Central Asia (%)
Place of birth for the foreign-born population - Burma (%)
Place of birth for the foreign-born population - Cambodia (%)
Place of birth for the foreign-born population - Indonesia (%)
Place of birth for the foreign-born population - Laos (%)
Place of birth for the foreign-born population - Malaysia (%)
Place of birth for the foreign-born population - Philippines (%)
Place of birth for the foreign-born population - Singapore (%)
Place of birth for the foreign-born population - Thailand (%)
Place of birth for the foreign-born population - Vietnam (%)
Place of birth for the foreign-born population - Other South Eastern Asia (%)
Place of birth for the foreign-born population - Armenia (%)
Place of birth for the foreign-born population - Iraq (%)
Place of birth for the foreign-born population - Israel (%)
Place of birth for the foreign-born population - Jordan (%)
Place of birth for the foreign-born population - Kuwait (%)
Place of birth for the foreign-born population - Lebanon (%)
Place of birth for the foreign-born population - Saudi Arabia (%)
Place of birth for the foreign-born population - Syria (%)
Place of birth for the foreign-born population - Turkey (%)
Place of birth for the foreign-born population - Yemen (%)
Place of birth for the foreign-born population - Other Western Asia (%)
Place of birth for the foreign-born population - Eritrea (%)
Place of birth for the foreign-born population - Ethiopia (%)
Place of birth for the foreign-born population - Kenya (%)
Place of birth for the foreign-born population - Somalia (%)
Place of birth for the foreign-born population - Uganda (%)
Place of birth for the foreign-born population - Zimbabwe (%)
Place of birth for the foreign-born population - Other Eastern Africa (%)
Place of birth for the foreign-born population - Cameroon (%)
Place of birth for the foreign-born population - Congo (%)
Place of birth for the foreign-born population - Democratic Republic of Congo (Zaire) (%)
Place of birth for the foreign-born population - Other Middle Africa (%)
Place of birth for the foreign-born population - Egypt (%)
Place of birth for the foreign-born population - Morocco (%)
Place of birth for the foreign-born population - Sudan (%)
Place of birth for the foreign-born population - Other Northern Africa (%)
Place of birth for the foreign-born population - South Africa (%)
Place of birth for the foreign-born population - Other Southern Africa (%)
Place of birth for the foreign-born population - Cabo Verde (%)
Place of birth for the foreign-born population - Ghana (%)
Place of birth for the foreign-born population - Liberia (%)
Place of birth for the foreign-born population - Nigeria (%)
Place of birth for the foreign-born population - Senegal (%)
Place of birth for the foreign-born population - Sierra Leone (%)
Place of birth for the foreign-born population - Other Western Africa (%)
Place of birth for the foreign-born population - Australia (%)
Place of birth for the foreign-born population - New Zealand (%)
Place of birth for the foreign-born population - Fiji (%)
Place of birth for the foreign-born population - Micronesia (%)
Place of birth for the foreign-born population - Bahamas (%)
Place of birth for the foreign-born population - Barbados (%)
Place of birth for the foreign-born population - Cuba (%)
Place of birth for the foreign-born population - Dominica (%)
Place of birth for the foreign-born population - Dominican Republic (%)
Place of birth for the foreign-born population - Grenada (%)
Place of birth for the foreign-born population - Haiti (%)
Place of birth for the foreign-born population - Jamaica (%)
Place of birth for the foreign-born population - St. Vincent and the Grenadines (%)
Place of birth for the foreign-born population - Trinidad and Tobago (%)
Place of birth for the foreign-born population - West Indies (%)
Place of birth for the foreign-born population - Other Caribbean (%)
Place of birth for the foreign-born population - Belize (%)
Place of birth for the foreign-born population - Costa Rica (%)
Place of birth for the foreign-born population - El Salvador (%)
Place of birth for the foreign-born population - Guatemala (%)
Place of birth for the foreign-born population - Honduras (%)
Place of birth for the foreign-born population - Mexico (%)
Place of birth for the foreign-born population - Nicaragua (%)
Place of birth for the foreign-born population - Panama (%)
Place of birth for the foreign-born population - Other Central America (%)
Place of birth for the foreign-born population - Argentina (%)
Place of birth for the foreign-born population - Bolivia (%)
Place of birth for the foreign-born population - Brazil (%)
Place of birth for the foreign-born population - Chile (%)
Place of birth for the foreign-born population - Colombia (%)
Place of birth for the foreign-born population - Ecuador (%)
Place of birth for the foreign-born population - Guyana (%)
Place of birth for the foreign-born population - Peru (%)
Place of birth for the foreign-born population - Uruguay (%)
Place of birth for the foreign-born population - Venezuela (%)
Place of birth for the foreign-born population - Other South America (%)
Place of birth for the foreign-born population - Canada (%)
Place of birth for the foreign-born population - Other Northern America (%)
Place of birth for the foreign-born population - Other (%)
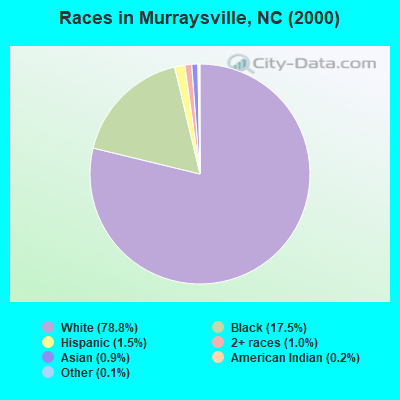
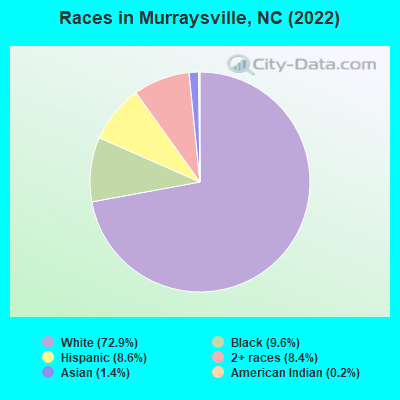
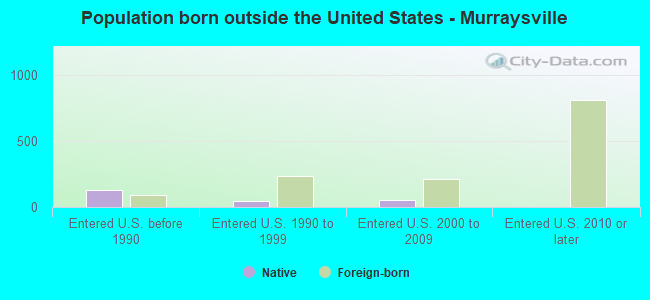
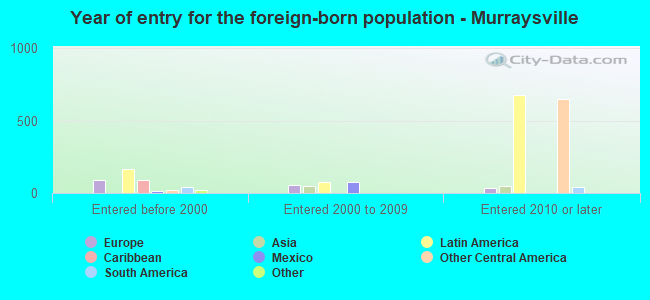
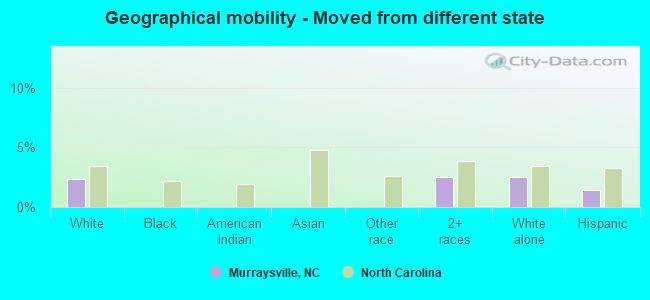
According to 2022 data, the most numerous races in Murraysville, NC are White alone (12,522 residents), Black alone (1,652 residents), and Hispanic (1,476 residents). 90.2% of Murraysville residents speak English at home. 6.3% of Murraysville, NC residents are foreign-born (4.6% born in Latin America, 0.9% born in Europe), which is 27.8% less than the foreign-born rate of 8.0% across the entire state of North Carolina.
Race distribution in Murraysville
2000 2022
5,647,155 70.2% White alone 1,723,301 21.4% Black alone 378,963 4.7% Hispanic 112,416 1.4% Asian alone 95,333 1.2% American Indian alone 79,965 1.0% Two or more races 9,015 0.1% Other race alone 3,165 0.04% Native Hawaiian and Other
6,497,519 60.7% White alone 2,155,650 20.1% Black alone 1,114,799 10.4% Hispanic 438,061 4.1% Two or more races 341,052 3.2% Asian alone 91,758 0.9% American Indian alone 50,180 0.5% Other race alone 9,954 0.09% Native Hawaiian and Other
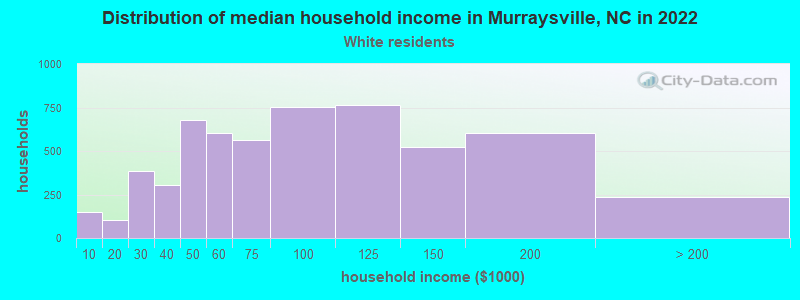
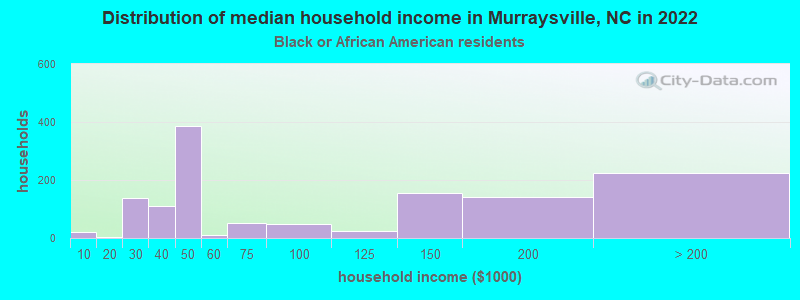
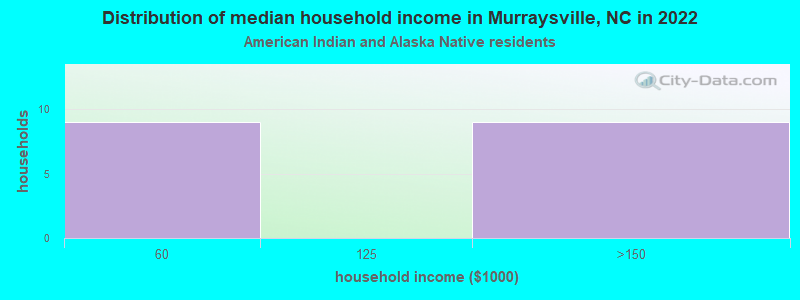
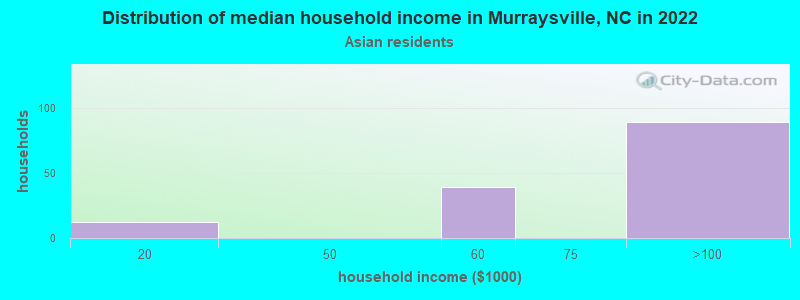
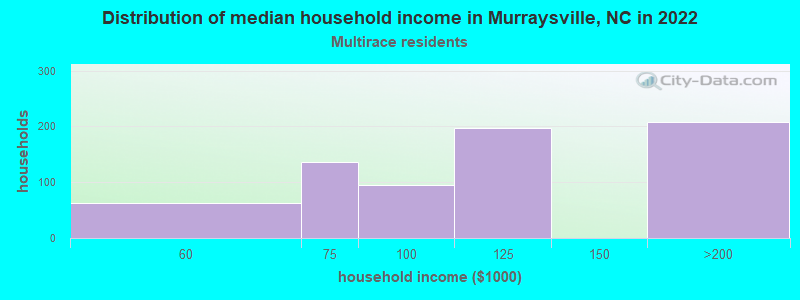
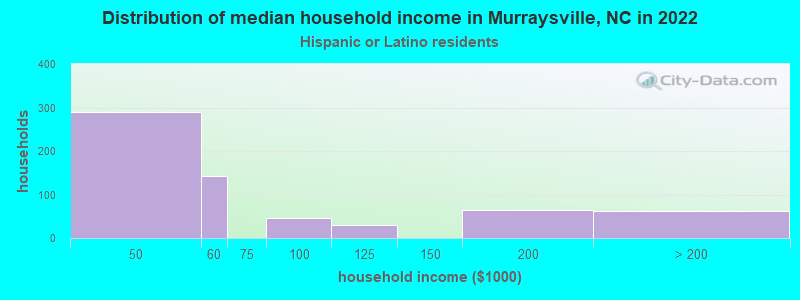
Income and house value in Murraysville Median household income in 2022 $76,800 White non-Hispanic householders$63,699 Asian householders$166,290 Two or more races householders$66,538 Hispanic or Latino race householdersMedian 2022 house value $294,670 White Non-Hispanic householders$319,140 Black or African American householders $289,776 Asian householders$289,776 Some other race householders$272,518 Two or more races householders$289,776 Hispanic or Latino householders
Median age by race in Murraysville
36.9 Median age for White residents33.6 38.8 45.0 Median age for Black or African American residents48.0 39.1 47.7 Median age for American Indian / Alaska Native residents-967,619,046.7 -901,433,690.9 30.5 Median age for Asian residents15.3 31.5 -666,666,666.0 Median age for Native Hawaiian / Pacific Islander residents-666,666,666.0 -666,666,666.0 79.8 Median age for Other race residents-678,082,191.1 48.4 33.2 Median age for Two or more races residents31.9 39.8 37.5 Median age for White alone residents33.5 40.8 39.9 Median age for Hispanic or Latino residents29.9 41.8
Owner/renter occupied households by race in Murraysville
House owners and renters - White residents 4,240 73.8% Owner occupied1,504 26.2% Renter occupiedHouse owners and renters - Black or African American residents 808 69.4% Owner occupied356 30.6% Renter occupiedHouse owners and renters - American Indian / Alaska Native residents 11 60.0% Owner occupied7 40.0% Renter occupiedHouse owners and renters - Asian residents 54 39.9% Owner occupied82 60.1% Renter occupiedHouse owners and renters - Other race residents 44 100.0% Owner occupiedHouse owners and renters - Two or more races residents 845 95.0% Owner occupied44 5.0% Renter occupiedHouse owners and renters - White alone residents 4,165 74.2% Owner occupied1,445 25.8% Renter occupiedHouse owners and renters - Hispanic or Latino residents 230 40.8% Owner occupied335 59.2% Renter occupied
Language usage in Murraysville
English speakers - Total 90.2% of residents of Murraysville speak English at home.
7.4% of residents speak Spanish at home 469 38.3% Speak English very well754 61.7% Speak English less than very well2.2% of residents speak other language at home 367 100.0% Speak English very well
English speakers - Born in the United States 94.9% of residents of Murraysville speak English at home.
4.0% of residents speak Spanish at home 293 100.0% Speak English very well1.6% of residents speak other language at home 114 100.0% Speak English very well
English speakers - Native, born elsewhere 79.0% of residents of Murraysville speak English at home.
12.0% of residents speak Spanish at home 40 100.0% Speak English very well
English speakers - Foreign-born 9.7% of residents of Murraysville speak English at home.
58.1% of residents speak Spanish at home 84 11.3% Speak English very well662 88.7% Speak English less than very well27.4% of residents speak other language at home 352 100.0% Speak English very well
White (Caucasian) - Speak only English Native:
99.6% (11,891)Foreign-born:
13.3% (97)
White (Caucasian) - Speak another language Native:
0.7% (89)Foreign-born:
85.3% (622)
Black or African American - Speak another language Native:
14.3% (246)Foreign-born:
99.2% (106)
Asian - Speak another language Native:
26.9% (39)Foreign-born:
94.3% (81)
Other race - Speak another language Native:
100.0% (21)Foreign-born:
94.1% (108)
Two or more races - Speak another language Native:
10.6% (193)Foreign-born:
95.7% (102)
White alone - Speak only English Native:
99.8% (11,757)Foreign-born:
20.6% (44)
White alone - Speak another language Native:
0.5% (55)Foreign-born:
88.2% (188)
Hispanic or Latino - Speak only English Native:
42.6% (324)Foreign-born:
10.3% (77)
Hispanic or Latino - Speak another language Native:
49.1% (374)Foreign-born:
89.5% (667)
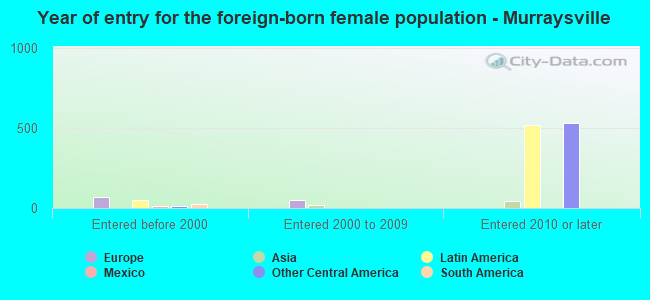
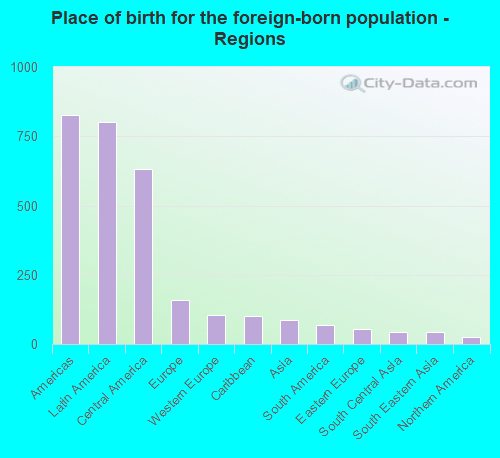
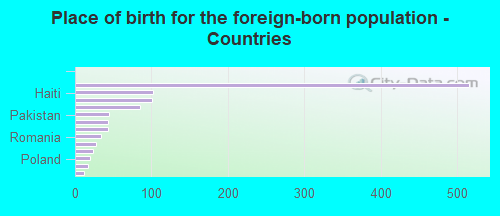
Foreign-born residents in Murraysville 1,075 residents are foreign born (4.6% Latin America , 0.9% Europe ).
This city:
6.3%North Carolina:
8.3%
Marital status for residents in Murraysville Marital status - White (Caucasian) population 15 years and over
Males 38.6% Never married51.7% Now married1.7% Separated0.7% Widowed7.3% DivorcedFemales 23.3% Never married52.3% Now married2.6% Separated8.0% Widowed13.9% DivorcedWomen who gave birth in the past 12 months Now married:
100.0% (90)Unmarried:
0.0% (0)
Women who did not give birth in the past 12 months Now married:
57.0% (2,044)Unmarried:
43.0% (1,539)
Marital status - Black or African American population 15 years and over
Males 45.9% Never married38.0% Now married0.0% Separated0.0% Widowed16.1% DivorcedFemales 23.1% Never married49.0% Now married0.0% Separated7.1% Widowed20.9% DivorcedWomen who did not give birth in the past 12 months Now married:
63.0% (338)Unmarried:
37.0% (199)
Marital status - American Indian / Alaska Native population 15 years and over
Males 100.0% Never married0.0% Now married0.0% Separated0.0% Widowed0.0% DivorcedFemales 0.0% Never married41.2% Now married0.0% Separated0.0% Widowed58.8% DivorcedWomen who did not give birth in the past 12 months Now married:
100.0% (7)Unmarried:
0.0% (0)
Marital status - Asian population 15 years and over
Males 51.7% Never married48.3% Now married0.0% Separated0.0% Widowed0.0% DivorcedFemales 37.1% Never married62.9% Now married0.0% Separated0.0% Widowed0.0% DivorcedWomen who did not give birth in the past 12 months Now married:
56.6% (63)Unmarried:
43.4% (48)
Marital status - Other race population 15 years and over
Males 0.0% Never married100.0% Now married0.0% Separated0.0% Widowed0.0% DivorcedFemales 0.0% Never married69.2% Now married0.0% Separated30.8% Widowed0.0% DivorcedWomen who did not give birth in the past 12 months Now married:
100.0% (16)Unmarried:
0.0% (0)
Marital status - Two or more races population 15 years and over
Males 69.7% Never married30.3% Now married0.0% Separated0.0% Widowed0.0% DivorcedFemales 48.0% Never married6.2% Now married0.0% Separated25.4% Widowed20.4% DivorcedWomen who did not give birth in the past 12 months Now married:
11.4% (36)Unmarried:
88.6% (276)
Marital status - White alone, not Hispanic / Latino population 15 years and over
Males 38.6% Never married52.2% Now married0.8% Separated0.7% Widowed7.7% DivorcedFemales 22.8% Never married51.6% Now married2.7% Separated8.4% Widowed14.6% DivorcedWomen who gave birth in the past 12 months Now married:
100.0% (63)Unmarried:
0.0% (0)
Women who did not give birth in the past 12 months Now married:
56.6% (1,924)Unmarried:
43.4% (1,473)
Marital status - Hispanic or Latino population 15 years and over
Males 43.1% Never married45.1% Now married11.7% Separated0.0% Widowed0.0% DivorcedFemales 14.3% Never married74.4% Now married0.0% Separated11.3% Widowed0.0% DivorcedWomen who gave birth in the past 12 months Now married:
100.0% (31)Unmarried:
0.0% (0)
Women who did not give birth in the past 12 months Now married:
82.3% (481)Unmarried:
17.7% (103)
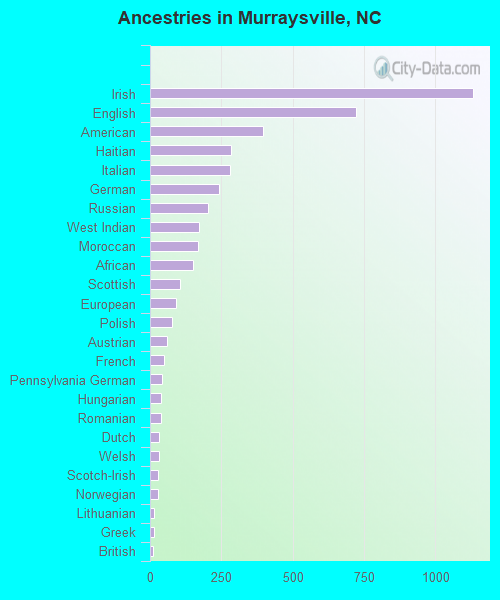
Ancestries in Murraysville
1,132 17.7% Irish721 11.3% English396 6.2% American285 4.5% Haitian282 4.4% Italian241 3.8% German205 3.2% Russian171 2.7% West Indian170 2.7% Moroccan152 2.4% African106 1.7% Scottish92 1.4% European77 1.2% Polish60 0.9% Austrian48 0.8% French43 0.7% Pennsylvania German40 0.6% Hungarian37 0.6% Romanian33 0.5% Dutch31 0.5% Welsh28 0.4% Scotch-Irish27 0.4% Norwegian15 0.2% Lithuanian13 0.2% Greek12 0.2% British
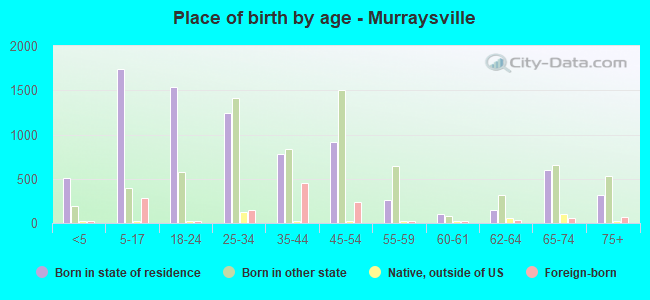
Children Nativity (place of birth) in Murraysville
Children under 6 years - Living with two parents Both parents native 698 100.0% NativeOne native, one foreign-born parent 48 100.0% NativeChildren under 6 years - Living with one parent Native parent 229 100.0% NativeChildren 6 to 17 years - Living with two parents Both parents native 1,246 100.0% NativeBoth parents foreign-born 16 100.0% NativeOne native, one foreign-born parent 38 100.0% NativeChildren 6 to 17 years - Living with one parent Native parent 246 61.1% Native157 38.9% Foreign-bornForeign-born parent 268 88.3% Native36 11.7% Foreign-born
Grandparents responsible for own grandchildren in Murraysville
Grandparents (30 to 59 years) White / Caucasian 5 100.0% Not responsible for grandchildrenWhite alone, not Hispanic / Latino 5 100.0% Not responsible for grandchildren
Grandparents (60 years and over) White / Caucasian 25 100.0% Not responsible for grandchildrenWhite alone, not Hispanic / Latino 25 100.0% Not responsible for grandchildren