Races in Myers Corner, New York (NY) Detailed Stats
Data:
Races - White alone (%)
Races - White alone (% change since 2000)
Races - Black alone (%)
Races - Black alone (% change since 2000)
Races - American Indian alone (%)
Races - American Indian alone (% change since 2000)
Races - Asian alone (%)
Races - Asian alone (% change since 2000)
Races - Hispanic (%)
Races - Hispanic (% change since 2000)
Races - Native Hawaiian and Other Pacific Islander alone (%)
Races - Native Hawaiian and Other Pacific Islander alone (% change since 2000)
Races - Two or more races(%)
Races - Two or more races(% change since 2000)
Races - Other race alone (%)
Races - Other race alone (% change since 2000)
Racial diversity
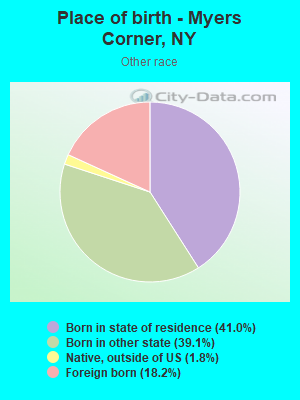
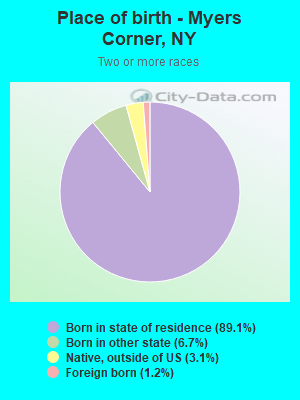
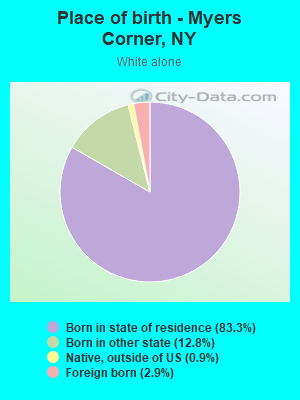
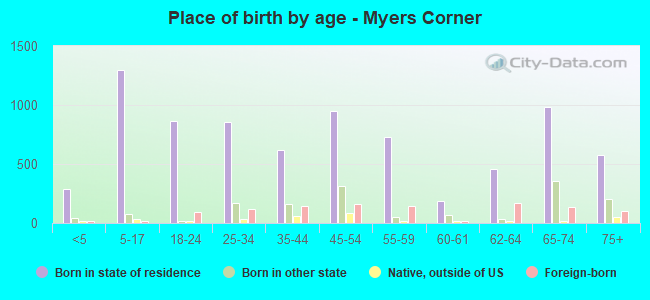
Place of birth - Born in state of residence (%)
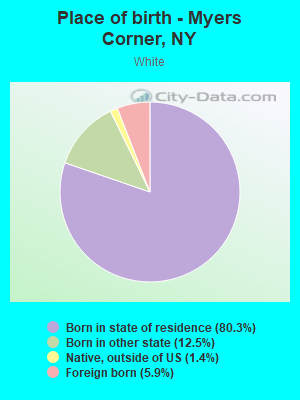
Place of birth - Born in state of residence (%) - White
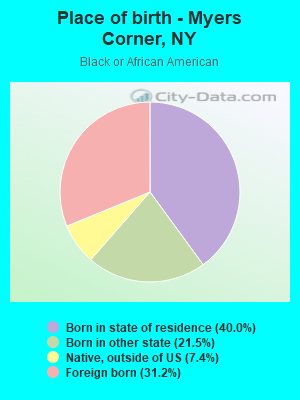
Place of birth - Born in state of residence (%) - Black or African American
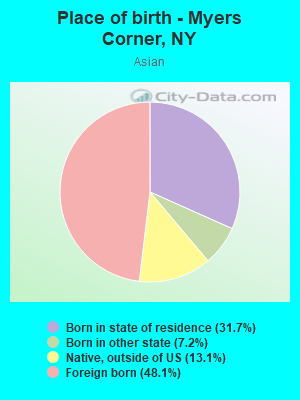
Place of birth - Born in state of residence (%) - Asian
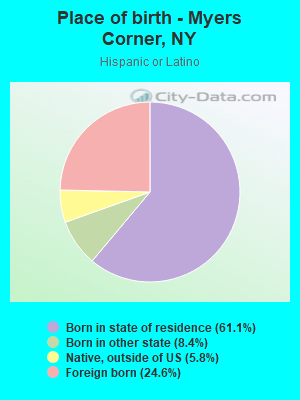
Place of birth - Born in state of residence (%) - Hispanic or Latino
Place of birth - Born in state of residence (%) - American Indian and Alaska Native
Place of birth - Born in state of residence (%) - Multirace
Place of birth - Born in state of residence (%) - Other Race
Place of birth - Born in other state (%)
Place of birth - Born in other state (%) - White
Place of birth - Born in other state (%) - Black or African American
Place of birth - Born in other state (%) - Asian
Place of birth - Born in other state (%) - Hispanic or Latino
Place of birth - Born in other state (%) - American Indian and Alaska Native
Place of birth - Born in other state (%) - Multirace
Place of birth - Born in other state (%) - Other Race
Place of birth - Native, outside of US (%)
Place of birth - Native, outside of US (%) - White
Place of birth - Native, outside of US (%) - Black or African American
Place of birth - Native, outside of US (%) - Asian
Place of birth - Native, outside of US (%) - Hispanic or Latino
Place of birth - Native, outside of US (%) - American Indian and Alaska Native
Place of birth - Native, outside of US (%) - Multirace
Place of birth - Native, outside of US (%) - Other Race
Place of birth - Foreign born (%)
Place of birth - Foreign born (%) - White
Place of birth - Foreign born (%) - Black or African American
Place of birth - Foreign born (%) - Asian
Place of birth - Foreign born (%) - Hispanic or Latino
Place of birth - Foreign born (%) - American Indian and Alaska Native
Place of birth - Foreign born (%) - Multirace
Place of birth - Foreign born (%) - Other Race
Residents speaking English at home (%)
Residents speaking English at home - Born in the United States (%)
Residents speaking English at home - Native, born elsewhere (%)
Residents speaking English at home - Foreign born (%)
Residents speaking Spanish at home (%)
Residents speaking Spanish at home - Born in the United States (%)
Residents speaking Spanish at home - Native, born elsewhere (%)
Residents speaking Spanish at home - Foreign born (%)
Residents speaking other language at home (%)
Residents speaking other language at home - Born in the United States (%)
Residents speaking other language at home - Native, born elsewhere (%)
Residents speaking other language at home - Foreign born (%)
Marital status - Never married (%)
Marital status - Now married (%)
Marital status - Separated (%)
Marital status - Widowed (%)
Marital status - Divorced (%)
Ancestries Reported - Arab (%)
Ancestries Reported - Czech (%)
Ancestries Reported - Danish (%)
Ancestries Reported - Dutch (%)
Ancestries Reported - English (%)
Ancestries Reported - French (%)
Ancestries Reported - French Canadian (%)
Ancestries Reported - German (%)
Ancestries Reported - Greek (%)
Ancestries Reported - Hungarian (%)
Ancestries Reported - Irish (%)
Ancestries Reported - Italian (%)
Ancestries Reported - Lithuanian (%)
Ancestries Reported - Norwegian (%)
Ancestries Reported - Polish (%)
Ancestries Reported - Portuguese (%)
Ancestries Reported - Russian (%)
Ancestries Reported - Scotch-Irish (%)
Ancestries Reported - Scottish (%)
Ancestries Reported - Slovak (%)
Ancestries Reported - Subsaharan African (%)
Ancestries Reported - Swedish (%)
Ancestries Reported - Swiss (%)
Ancestries Reported - Ukrainian (%)
Ancestries Reported - United States (%)
Ancestries Reported - Welsh (%)
Ancestries Reported - West Indian (%)
Ancestries Reported - Other (%)
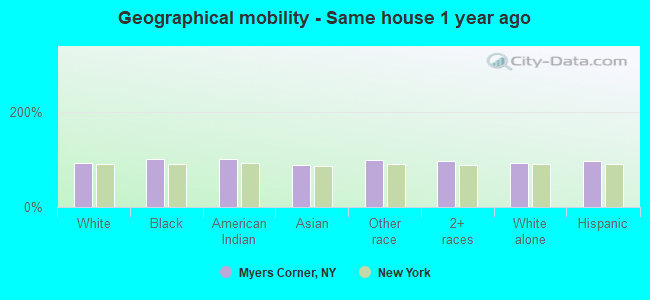
Geographical mobility - Same house 1 year ago (%)
Geographical mobility - Same house 1 year ago (%) - White
Geographical mobility - Same house 1 year ago (%) - Black or African American
Geographical mobility - Same house 1 year ago (%) - Asian
Geographical mobility - Same house 1 year ago (%) - Hispanic or Latino
Geographical mobility - Same house 1 year ago (%) - American Indian and Alaska Native
Geographical mobility - Same house 1 year ago (%) - Multirace
Geographical mobility - Same house 1 year ago (%) - Other Race
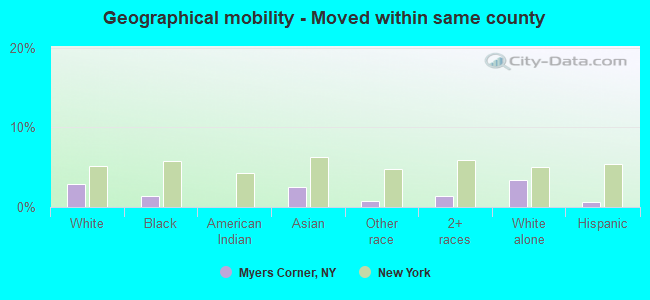
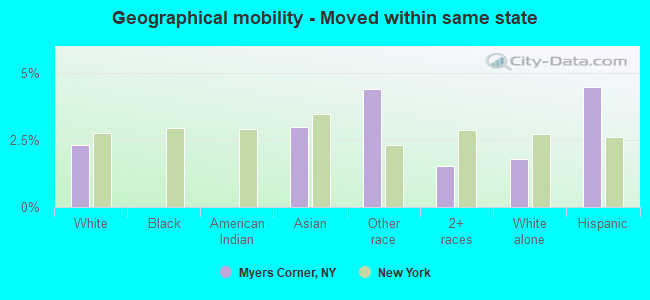
Geographical mobility - Moved within same county (%)
Geographical mobility - Moved within same county (%) - White
Geographical mobility - Moved within same county (%) - Black or African American
Geographical mobility - Moved within same county (%) - Asian
Geographical mobility - Moved within same county (%) - Hispanic or Latino
Geographical mobility - Moved within same county (%) - American Indian and Alaska Native
Geographical mobility - Moved within same county (%) - Multirace
Geographical mobility - Moved within same county (%) - Other Race
Geographical mobility - Moved from different county within same state (%)
Geographical mobility - Moved from different county within same state (%) - White
Geographical mobility - Moved from different county within same state (%) - Black or African American
Geographical mobility - Moved from different county within same state (%) - Asian
Geographical mobility - Moved from different county within same state (%) - Hispanic or Latino
Geographical mobility - Moved from different county within same state (%) - American Indian and Alaska Native
Geographical mobility - Moved from different county within same state (%) - Multirace
Geographical mobility - Moved from different county within same state (%) - Other Race
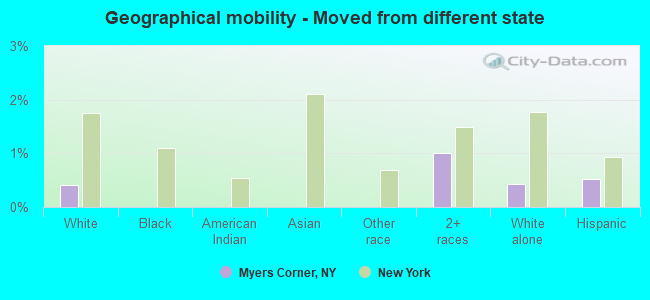
Geographical mobility - Moved from different state (%)
Geographical mobility - Moved from different state (%) - White
Geographical mobility - Moved from different state (%) - Black or African American
Geographical mobility - Moved from different state (%) - Asian
Geographical mobility - Moved from different state (%) - Hispanic or Latino
Geographical mobility - Moved from different state (%) - American Indian and Alaska Native
Geographical mobility - Moved from different state (%) - Multirace
Geographical mobility - Moved from different state (%) - Other Race
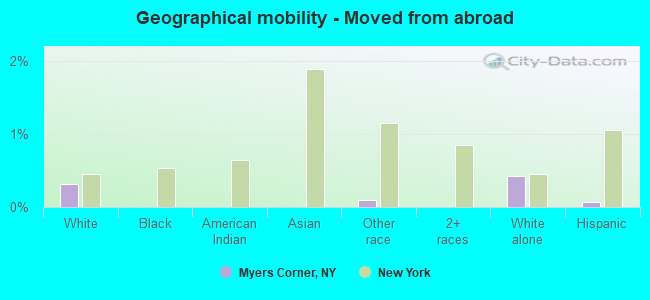
Geographical mobility - Moved from abroad (%)
Geographical mobility - Moved from abroad (%) - White
Geographical mobility - Moved from abroad (%) - Black or African American
Geographical mobility - Moved from abroad (%) - Asian
Geographical mobility - Moved from abroad (%) - Hispanic or Latino
Geographical mobility - Moved from abroad (%) - American Indian and Alaska Native
Geographical mobility - Moved from abroad (%) - Multirace
Geographical mobility - Moved from abroad (%) - Other Race
Place of birth for the foreign-born population - Ireland (%)
Place of birth for the foreign-born population - Denmark (%)
Place of birth for the foreign-born population - Norway (%)
Place of birth for the foreign-born population - Sweden (%)
Place of birth for the foreign-born population - United Kingdom (%)
Place of birth for the foreign-born population - England (%)
Place of birth for the foreign-born population - Scotland (%)
Place of birth for the foreign-born population - Other Northern Europe (%)
Place of birth for the foreign-born population - Austria (%)
Place of birth for the foreign-born population - Belgium (%)
Place of birth for the foreign-born population - France (%)
Place of birth for the foreign-born population - Germany (%)
Place of birth for the foreign-born population - Netherlands (%)
Place of birth for the foreign-born population - Switzerland (%)
Place of birth for the foreign-born population - Other Western Europe (%)
Place of birth for the foreign-born population - Greece (%)
Place of birth for the foreign-born population - Italy (%)
Place of birth for the foreign-born population - Portugal (%)
Place of birth for the foreign-born population - Spain (%)
Place of birth for the foreign-born population - Other Southern Europe (%)
Place of birth for the foreign-born population - Albania (%)
Place of birth for the foreign-born population - Belarus (%)
Place of birth for the foreign-born population - Bosnia and Herzegovina (%)
Place of birth for the foreign-born population - Bulgaria (%)
Place of birth for the foreign-born population - Croatia (%)
Place of birth for the foreign-born population - Czechoslovakia (%)
Place of birth for the foreign-born population - Hungary (%)
Place of birth for the foreign-born population - Latvia (%)
Place of birth for the foreign-born population - Lithuania (%)
Place of birth for the foreign-born population - North Macedonia (Macedonia) (%)
Place of birth for the foreign-born population - Moldova (%)
Place of birth for the foreign-born population - Poland (%)
Place of birth for the foreign-born population - Romania (%)
Place of birth for the foreign-born population - Russia (%)
Place of birth for the foreign-born population - Serbia (%)
Place of birth for the foreign-born population - Ukraine (%)
Place of birth for the foreign-born population - Other Eastern Europe (%)
Place of birth for the foreign-born population - China (%)
Place of birth for the foreign-born population - Hong Kong (%)
Place of birth for the foreign-born population - Taiwan (%)
Place of birth for the foreign-born population - Japan (%)
Place of birth for the foreign-born population - Korea (%)
Place of birth for the foreign-born population - Other Eastern Asia (%)
Place of birth for the foreign-born population - Afghanistan (%)
Place of birth for the foreign-born population - Bangladesh (%)
Place of birth for the foreign-born population - India (%)
Place of birth for the foreign-born population - Iran (%)
Place of birth for the foreign-born population - Kazakhstan (%)
Place of birth for the foreign-born population - Nepal (%)
Place of birth for the foreign-born population - Pakistan (%)
Place of birth for the foreign-born population - Sri Lanka (%)
Place of birth for the foreign-born population - Uzbekistan (%)
Place of birth for the foreign-born population - Other South Central Asia (%)
Place of birth for the foreign-born population - Burma (%)
Place of birth for the foreign-born population - Cambodia (%)
Place of birth for the foreign-born population - Indonesia (%)
Place of birth for the foreign-born population - Laos (%)
Place of birth for the foreign-born population - Malaysia (%)
Place of birth for the foreign-born population - Philippines (%)
Place of birth for the foreign-born population - Singapore (%)
Place of birth for the foreign-born population - Thailand (%)
Place of birth for the foreign-born population - Vietnam (%)
Place of birth for the foreign-born population - Other South Eastern Asia (%)
Place of birth for the foreign-born population - Armenia (%)
Place of birth for the foreign-born population - Iraq (%)
Place of birth for the foreign-born population - Israel (%)
Place of birth for the foreign-born population - Jordan (%)
Place of birth for the foreign-born population - Kuwait (%)
Place of birth for the foreign-born population - Lebanon (%)
Place of birth for the foreign-born population - Saudi Arabia (%)
Place of birth for the foreign-born population - Syria (%)
Place of birth for the foreign-born population - Turkey (%)
Place of birth for the foreign-born population - Yemen (%)
Place of birth for the foreign-born population - Other Western Asia (%)
Place of birth for the foreign-born population - Eritrea (%)
Place of birth for the foreign-born population - Ethiopia (%)
Place of birth for the foreign-born population - Kenya (%)
Place of birth for the foreign-born population - Somalia (%)
Place of birth for the foreign-born population - Uganda (%)
Place of birth for the foreign-born population - Zimbabwe (%)
Place of birth for the foreign-born population - Other Eastern Africa (%)
Place of birth for the foreign-born population - Cameroon (%)
Place of birth for the foreign-born population - Congo (%)
Place of birth for the foreign-born population - Democratic Republic of Congo (Zaire) (%)
Place of birth for the foreign-born population - Other Middle Africa (%)
Place of birth for the foreign-born population - Egypt (%)
Place of birth for the foreign-born population - Morocco (%)
Place of birth for the foreign-born population - Sudan (%)
Place of birth for the foreign-born population - Other Northern Africa (%)
Place of birth for the foreign-born population - South Africa (%)
Place of birth for the foreign-born population - Other Southern Africa (%)
Place of birth for the foreign-born population - Cabo Verde (%)
Place of birth for the foreign-born population - Ghana (%)
Place of birth for the foreign-born population - Liberia (%)
Place of birth for the foreign-born population - Nigeria (%)
Place of birth for the foreign-born population - Senegal (%)
Place of birth for the foreign-born population - Sierra Leone (%)
Place of birth for the foreign-born population - Other Western Africa (%)
Place of birth for the foreign-born population - Australia (%)
Place of birth for the foreign-born population - New Zealand (%)
Place of birth for the foreign-born population - Fiji (%)
Place of birth for the foreign-born population - Micronesia (%)
Place of birth for the foreign-born population - Bahamas (%)
Place of birth for the foreign-born population - Barbados (%)
Place of birth for the foreign-born population - Cuba (%)
Place of birth for the foreign-born population - Dominica (%)
Place of birth for the foreign-born population - Dominican Republic (%)
Place of birth for the foreign-born population - Grenada (%)
Place of birth for the foreign-born population - Haiti (%)
Place of birth for the foreign-born population - Jamaica (%)
Place of birth for the foreign-born population - St. Vincent and the Grenadines (%)
Place of birth for the foreign-born population - Trinidad and Tobago (%)
Place of birth for the foreign-born population - West Indies (%)
Place of birth for the foreign-born population - Other Caribbean (%)
Place of birth for the foreign-born population - Belize (%)
Place of birth for the foreign-born population - Costa Rica (%)
Place of birth for the foreign-born population - El Salvador (%)
Place of birth for the foreign-born population - Guatemala (%)
Place of birth for the foreign-born population - Honduras (%)
Place of birth for the foreign-born population - Mexico (%)
Place of birth for the foreign-born population - Nicaragua (%)
Place of birth for the foreign-born population - Panama (%)
Place of birth for the foreign-born population - Other Central America (%)
Place of birth for the foreign-born population - Argentina (%)
Place of birth for the foreign-born population - Bolivia (%)
Place of birth for the foreign-born population - Brazil (%)
Place of birth for the foreign-born population - Chile (%)
Place of birth for the foreign-born population - Colombia (%)
Place of birth for the foreign-born population - Ecuador (%)
Place of birth for the foreign-born population - Guyana (%)
Place of birth for the foreign-born population - Peru (%)
Place of birth for the foreign-born population - Uruguay (%)
Place of birth for the foreign-born population - Venezuela (%)
Place of birth for the foreign-born population - Other South America (%)
Place of birth for the foreign-born population - Canada (%)
Place of birth for the foreign-born population - Other Northern America (%)
Place of birth for the foreign-born population - Other (%)
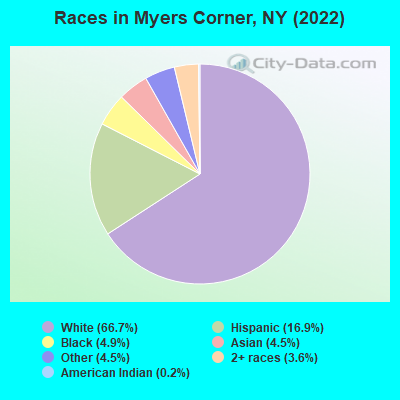
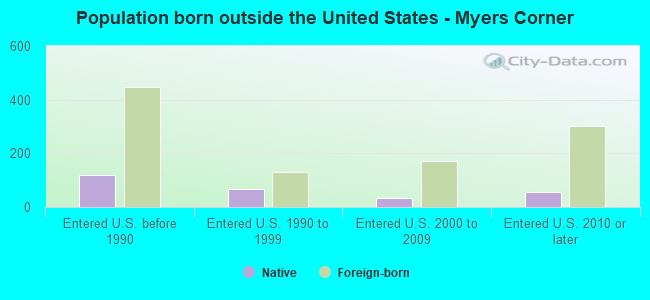
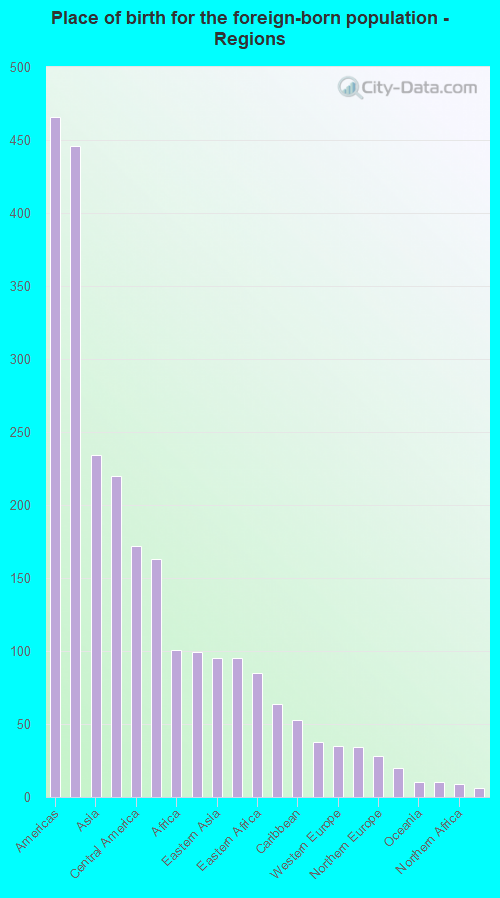
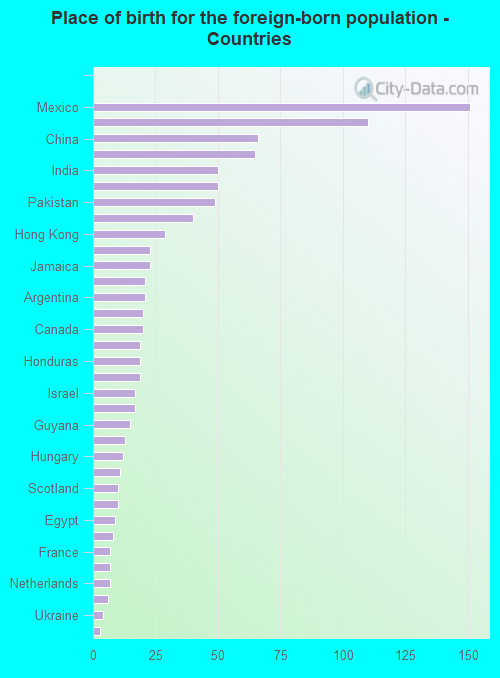
According to 2022 data, the most numerous races in Myers Corner, NY are White alone (7,128 residents), Hispanic (1,804 residents), and Black alone (525 residents). 83.6% of Myers Corner residents speak English at home. 9.1% of Myers Corner, NY residents are foreign-born (4.2% born in Latin America, 2.2% born in Asia, 1.5% born in Europe, 1.0% born in Africa), which is 140.8% less than the foreign-born rate of 22.0% across the entire state of New York.
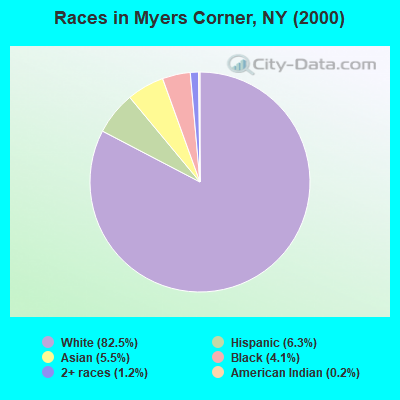
Race distribution in Myers Corner
2000 2022
11,760,981 62.0% White alone 2,867,583 15.1% Hispanic 2,812,623 14.8% Black alone 1,035,926 5.5% Asian alone 366,116 1.9% Two or more races 75,499 0.4% Other race alone 52,499 0.3% American Indian alone 5,230 0.03% Native Hawaiian and Other
10,408,933 52.9% White alone 3,867,299 19.7% Hispanic 2,633,840 13.4% Black alone 1,776,286 9.0% Asian alone 732,670 3.7% Two or more races 216,110 1.1% Other race alone 35,082 0.2% American Indian alone 6,931 0.04% Native Hawaiian and Other
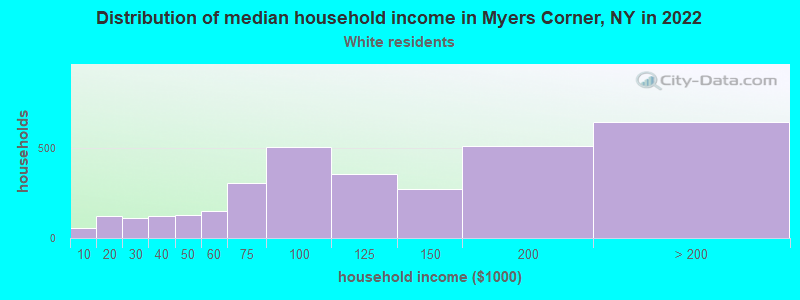
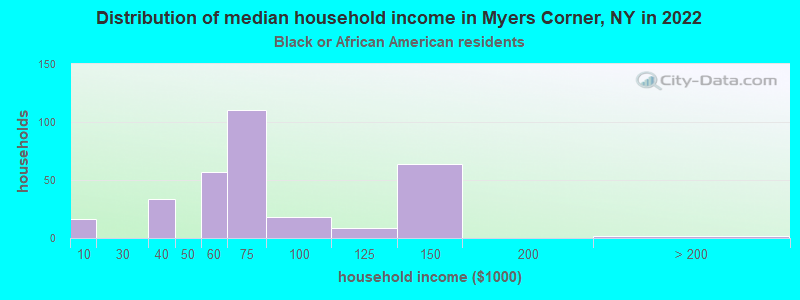
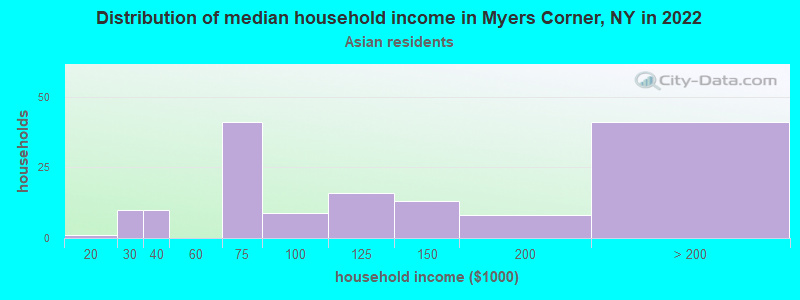
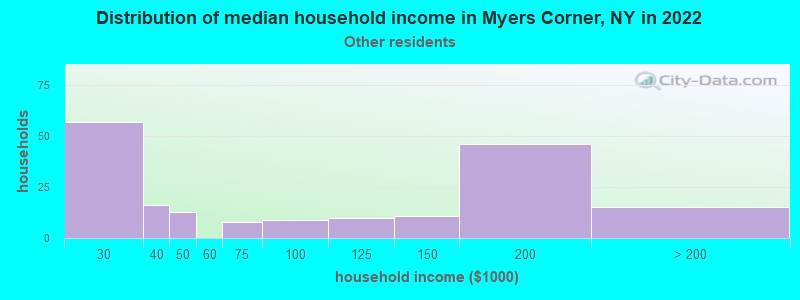
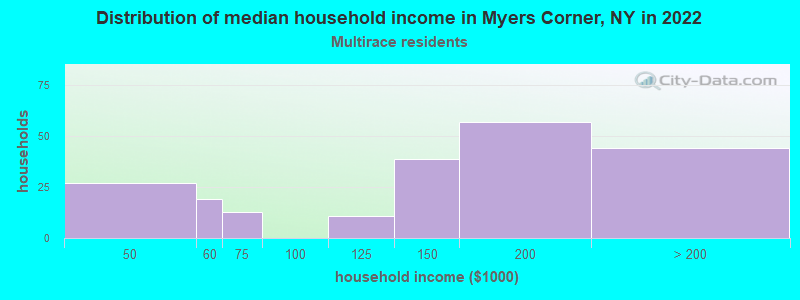
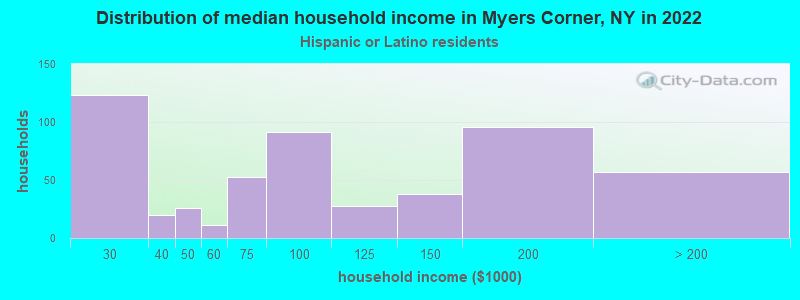
Income and house value in Myers Corner Median household income in 2022 $113,060 White non-Hispanic householders$64,212 Black householders$125,367 Asian householders$104,438 Two or more races householders$64,725 Hispanic or Latino race householdersMedian 2022 house value $390,344 White Non-Hispanic householders$422,911 Black or African American householders $383,107 Asian householders$310,964 Some other race householders$411,151 Two or more races householders$405,723 Hispanic or Latino householders
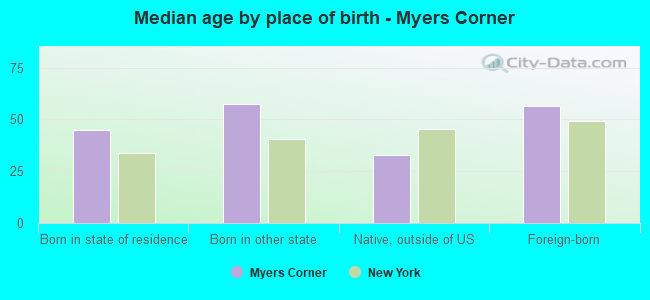
Median age by race in Myers Corner
51.8 Median age for White residents52.1 51.7 47.2 Median age for Black or African American residents45.4 35.9 -815,273,477.0 Median age for American Indian / Alaska Native residents-796,352,582.8 -969,474,968.5 47.7 Median age for Asian residents53.8 47.6 -663,333,332.7 Median age for Native Hawaiian / Pacific Islander residents-477,502,295.2 -497,387,669.3 42.7 Median age for Other race residents31.0 54.0 25.3 Median age for Two or more races residents29.2 22.6 52.3 Median age for White alone residents52.2 52.8 36.9 Median age for Hispanic or Latino residents35.3 37.5
Owner/renter occupied households by race in Myers Corner
House owners and renters - White residents 2,887 88.6% Owner occupied372 11.4% Renter occupiedHouse owners and renters - Black or African American residents 242 86.9% Owner occupied37 13.1% Renter occupiedHouse owners and renters - American Indian / Alaska Native residents 18 100.0% Owner occupiedHouse owners and renters - Asian residents 161 100.0% Owner occupiedHouse owners and renters - Other race residents 174 66.1% Owner occupied89 33.9% Renter occupiedHouse owners and renters - Two or more races residents 236 100.0% Owner occupiedHouse owners and renters - White alone residents 2,701 89.1% Owner occupied331 10.9% Renter occupiedHouse owners and renters - Hispanic or Latino residents 460 79.9% Owner occupied116 20.1% Renter occupied
Language usage in Myers Corner
English speakers - Total 83.6% of residents of Myers Corner speak English at home.
10.3% of residents speak Spanish at home 882 82.8% Speak English very well183 17.2% Speak English less than very well6.4% of residents speak other language at home 397 60.2% Speak English very well262 39.8% Speak English less than very well
English speakers - Born in the United States 96.2% of residents of Myers Corner speak English at home.
2.4% of residents speak Spanish at home 34 100.0% Speak English very well1.6% of residents speak other language at home 12 54.5% Speak English very well10 45.5% Speak English less than very well
English speakers - Native, born elsewhere 31.0% of residents of Myers Corner speak English at home.
24.5% of residents speak Spanish at home 68 100.0% Speak English very well50.2% of residents speak other language at home 139 100.0% Speak English very well
English speakers - Foreign-born 31.5% of residents of Myers Corner speak English at home.
41.0% of residents speak Spanish at home 362 81.9% Speak English very well80 18.1% Speak English less than very well32.3% of residents speak other language at home 124 35.6% Speak English very well224 64.4% Speak English less than very well
White (Caucasian) - Speak only English Native:
94.2% (6,672)Foreign-born:
29.5% (134)
White (Caucasian) - Speak another language Native:
5.5% (388)Foreign-born:
70.6% (319)
Black or African American - Speak only English Native:
95.1% (322)Foreign-born:
47.8% (83)
Black or African American - Speak another language Native:
4.7% (16)Foreign-born:
53.8% (93)
Asian - Speak only English Native:
56.7% (156)Foreign-born:
17.1% (36)
Asian - Speak another language Native:
41.2% (113)Foreign-born:
77.6% (162)
Other race - Speak only English Native:
79.2% (548)Foreign-born:
25.0% (51)
Other race - Speak another language Native:
24.5% (169)Foreign-born:
68.4% (139)
Two or more races - Speak another language Native:
20.1% (213)Foreign-born:
96.4% (12)
White alone - Speak only English Native:
96.4% (6,512)Foreign-born:
55.6% (116)
White alone - Speak another language Native:
3.5% (238)Foreign-born:
39.1% (81)
Hispanic or Latino - Speak only English Native:
56.8% (717)Foreign-born:
9.7% (43)
Hispanic or Latino - Speak another language Native:
43.2% (545)Foreign-born:
87.5% (386)
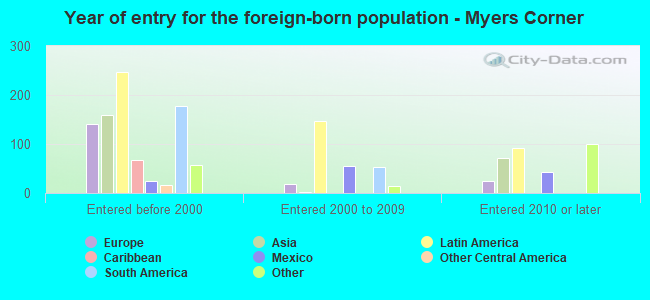
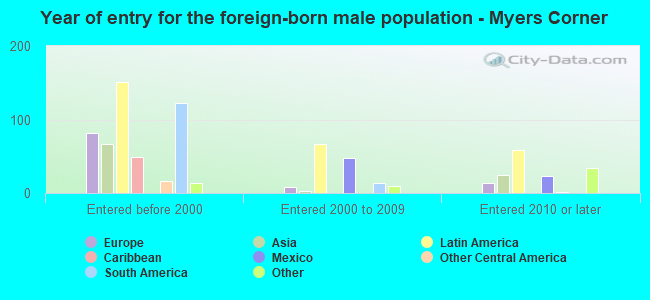
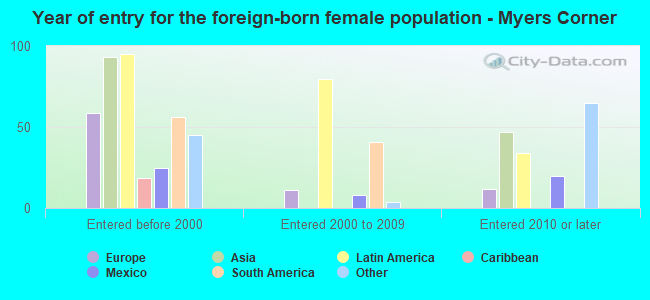
Foreign-born residents in Myers Corner 977 residents are foreign born (4.2% Latin America , 2.2% Asia , 1.5% Europe , 1.0% Africa ).
This city:
9.1%New York:
22.6%
Marital status for residents in Myers Corner Marital status - White (Caucasian) population 15 years and over
Males 30.5% Never married57.8% Now married2.0% Separated5.3% Widowed4.4% DivorcedFemales 29.2% Never married53.8% Now married0.8% Separated7.3% Widowed8.9% DivorcedWomen who gave birth in the past 12 months Now married:
72.9% (41)Unmarried:
27.1% (15)
Women who did not give birth in the past 12 months Now married:
36.5% (530)Unmarried:
63.5% (921)
Marital status - Black or African American population 15 years and over
Males 79.5% Never married20.5% Now married0.0% Separated0.0% Widowed0.0% DivorcedFemales 40.7% Never married38.9% Now married0.0% Separated3.0% Widowed17.4% DivorcedWomen who did not give birth in the past 12 months Now married:
32.3% (38)Unmarried:
67.7% (80)
Marital status - American Indian / Alaska Native population 15 years and over
Males 0.0% Never married100.0% Now married0.0% Separated0.0% Widowed0.0% DivorcedFemales 0.0% Never married100.0% Now married0.0% Separated0.0% Widowed0.0% DivorcedMarital status - Asian population 15 years and over
Males 45.8% Never married52.4% Now married0.0% Separated1.8% Widowed0.0% DivorcedFemales 10.4% Never married68.1% Now married7.4% Separated5.5% Widowed8.6% DivorcedWomen who did not give birth in the past 12 months Now married:
66.2% (46)Unmarried:
33.8% (23)
Marital status - Other race population 15 years and over
Males 58.9% Never married23.2% Now married9.9% Separated7.9% Widowed0.0% DivorcedFemales 26.6% Never married16.9% Now married0.0% Separated51.6% Widowed5.0% DivorcedWomen who gave birth in the past 12 months Now married:
100.0% (19)Unmarried:
0.0% (0)
Women who did not give birth in the past 12 months Now married:
14.3% (31)Unmarried:
85.7% (185)
Marital status - Two or more races population 15 years and over
Males 31.9% Never married52.0% Now married0.0% Separated5.7% Widowed10.4% DivorcedFemales 54.2% Never married36.6% Now married0.0% Separated3.5% Widowed5.6% DivorcedWomen who did not give birth in the past 12 months Now married:
25.7% (72)Unmarried:
74.3% (209)
Marital status - White alone, not Hispanic / Latino population 15 years and over
Males 28.4% Never married59.6% Now married2.2% Separated5.0% Widowed4.8% DivorcedFemales 29.2% Never married54.9% Now married0.4% Separated7.7% Widowed7.8% DivorcedWomen who gave birth in the past 12 months Now married:
72.9% (42)Unmarried:
27.1% (15)
Women who did not give birth in the past 12 months Now married:
37.1% (513)Unmarried:
62.9% (872)
Marital status - Hispanic or Latino population 15 years and over
Males 47.0% Never married43.3% Now married2.1% Separated6.5% Widowed1.0% DivorcedFemales 42.8% Never married39.6% Now married2.4% Separated2.2% Widowed13.1% DivorcedWomen who gave birth in the past 12 months Now married:
100.0% (13)Unmarried:
0.0% (0)
Women who did not give birth in the past 12 months Now married:
26.2% (117)Unmarried:
73.8% (330)
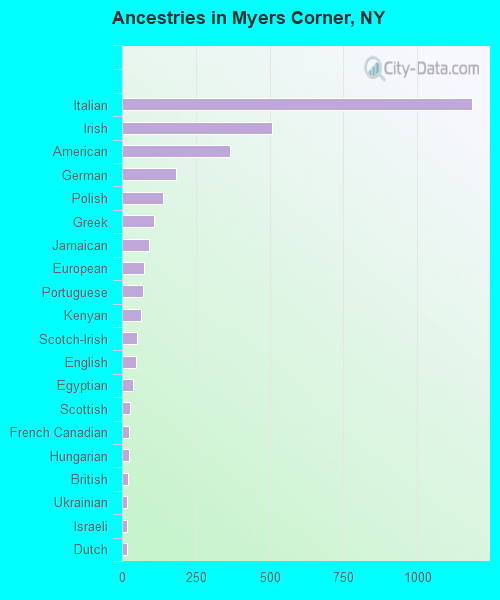
Ancestries in Myers Corner
1,184 27.1% Italian507 11.6% Irish365 8.4% American182 4.2% German138 3.2% Polish108 2.5% Greek92 2.1% Jamaican74 1.7% European70 1.6% Portuguese66 1.5% Kenyan51 1.2% Scotch-Irish49 1.1% English36 0.8% Egyptian27 0.6% Scottish23 0.5% French Canadian23 0.5% Hungarian19 0.4% British18 0.4% Ukrainian17 0.4% Israeli16 0.4% Dutch10 0.2% Welsh9 0.2% Latvian8 0.2% Russian8 0.2% Slovak8 0.2% Swedish5 0.1% Canadian
Children Nativity (place of birth) in Myers Corner
Children under 6 years - Living with two parents Both parents native 247 100.0% NativeOne native, one foreign-born parent 46 100.0% NativeChildren under 6 years - Living with one parent Native parent 129 100.0% NativeChildren 6 to 17 years - Living with two parents Both parents native 705 100.0% NativeBoth parents foreign-born 102 74.6% Native35 25.4% Foreign-bornOne native, one foreign-born parent 128 100.0% NativeChildren 6 to 17 years - Living with one parent Native parent 373 100.0% Native
Grandparents responsible for own grandchildren in Myers Corner
Grandparents (30 to 59 years) White / Caucasian 9 17.1% Responsible for grandchildren43 82.9% Not responsible for grandchildrenWhite alone, not Hispanic / Latino 11 25.8% Responsible for grandchildren32 74.2% Not responsible for grandchildrenHispanic or Latino 14 100.0% Not responsible for grandchildren
Grandparents (60 years and over) White / Caucasian 134 100.0% Not responsible for grandchildrenWhite alone, not Hispanic / Latino 139 100.0% Not responsible for grandchildrenHispanic or Latino 10 100.0% Not responsible for grandchildren