Races in Naneum, Washington (WA) Detailed Stats
Ancestries, Foreign-born residents, place of birth
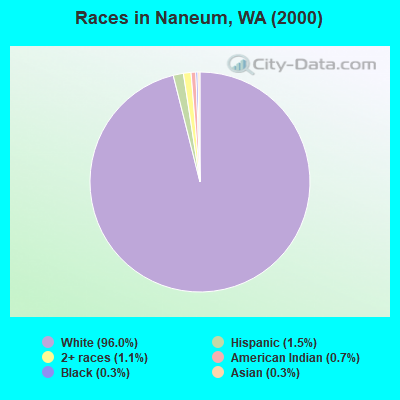
Race distribution in Naneum

- 2,91596.0%White alone
- 451.5%Hispanic
- 341.1%Two or more races
- 210.7%American Indian alone
- 80.3%Asian alone
- 100.3%Black alone
- 30.10%Other race alone
- 20.07%Native Hawaiian and Other
Pacific Islander alone
2000
2022
-
- 4,652,49078.9%White alone
- 441,5097.5%Hispanic
- 319,4015.4%Asian alone
- 184,6313.1%Black alone
- 175,9263.0%Two or more races
- 85,3961.4%American Indian alone
- 22,7790.4%Native Hawaiian and Other
Pacific Islander alone - 11,9890.2%Other race alone

-
- 4,941,45663.5%White alone
- 1,093,31314.0%Hispanic
- 755,8329.7%Asian alone
- 523,4486.7%Two or more races
- 299,5373.8%Black alone
- 69,0240.9%American Indian alone
- 52,2310.7%Native Hawaiian and Other
Pacific Islander alone - 50,9450.7%Other race alone

Income and house value in Naneum
- Median household income in 2022
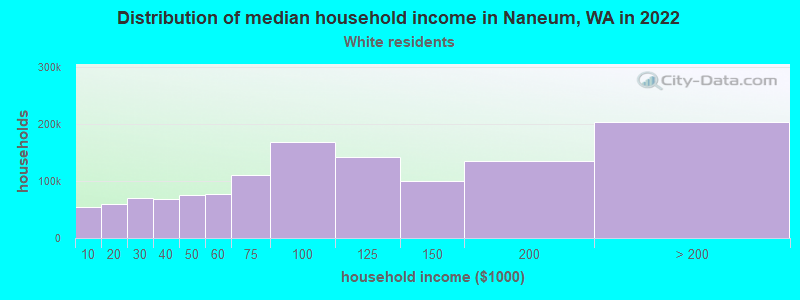
- $101,784White non-Hispanic householders
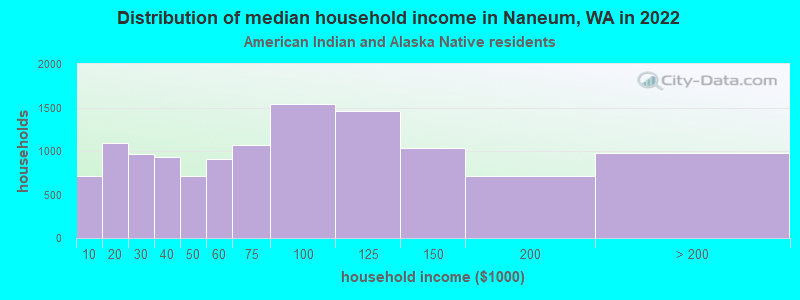
- $50,111American Indian and Alaska Native householders
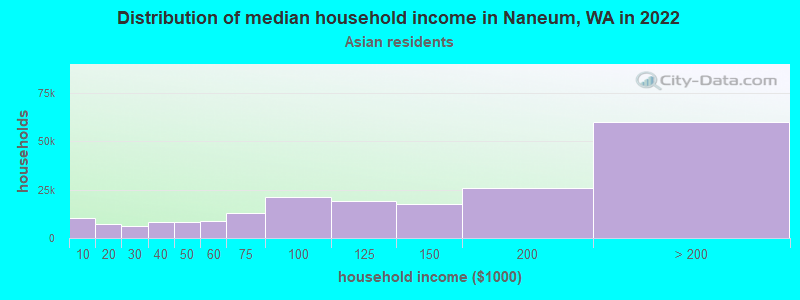
- $124,237Asian householders
- over $200,000Some other race householders
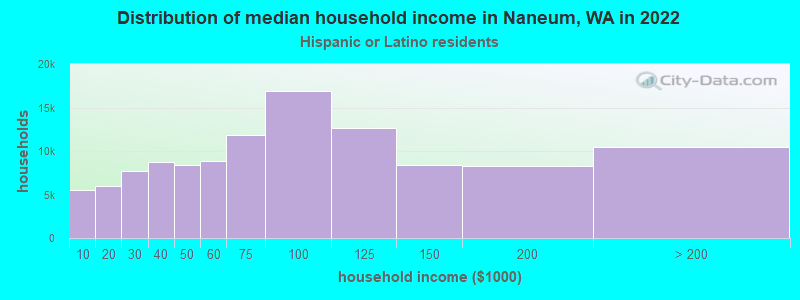
- $56,552Hispanic or Latino race householders
- Median 2022 house value
- $670,954White Non-Hispanic householders
- $842,907American Indian or Alaska Native householders
- over $1,000,000Some other race householders
- over $1,000,000Hispanic or Latino householders
Household income for White non-Hispanic householders
Household income for American Indian and Alaska Native householders
Household income for Asian householders
Household income for Hispanic or Latino race householders
Zip code: 98926