Races in Naples, Maine (ME) Detailed Stats
Ancestries, Foreign-born residents, place of birth

Data:
1.9% of Naples, ME residents are foreign-born , which is 61.0% less than the foreign-born rate of 3.0% across the entire state of Maine.
Race distribution in Naples

- 3,20898.0%White alone
- 270.8%Two or more races
- 100.3%Asian alone
- 100.3%American Indian alone
- 70.2%Hispanic
- 50.2%Black alone
- 70.2%Other race alone
2000
2022
-
- 1,230,29796.5%White alone
- 11,7310.9%Two or more races
- 9,3600.7%Hispanic
- 9,0140.7%Asian alone
- 6,4400.5%Black alone
- 6,9110.5%American Indian alone
- 8360.07%Other race alone
- 3340.03%Native Hawaiian and Other
Pacific Islander alone
-
- 1,249,23390.2%White alone
- 58,3574.2%Two or more races
- 28,7172.1%Hispanic
- 21,5831.6%Black alone
- 16,1511.2%Asian alone
- 5,8730.4%Other race alone
- 5,2050.4%American Indian alone
- 2210.02%Native Hawaiian and Other
Pacific Islander alone
Income and house value in Naples
- Median household income in 2022
- $79,257White non-Hispanic householders
- Median 2022 house value
- $362,222White Non-Hispanic householders
Household income for White non-Hispanic householders

Foreign-born residents in Naples
61 residents are foreign born
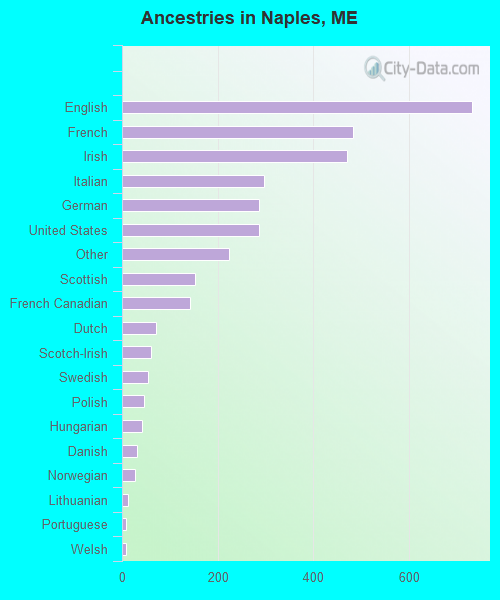
Ancestries in Naples

- 73121.3%English
- 48414.1%French
- 47013.7%Irish
- 2968.6%Italian
- 2878.4%German
- 2878.4%United States
- 2246.5%Other
- 1534.5%Scottish
- 1434.2%French Canadian
- 712.1%Dutch
- 611.8%Scotch-Irish
- 541.6%Swedish
- 451.3%Polish
- 411.2%Hungarian
- 320.9%Danish
- 270.8%Norwegian
- 130.4%Lithuanian
- 90.3%Portuguese
- 80.2%Welsh