Races in Nashua, New Hampshire (NH) Detailed Stats
Data:
Races - White alone (%)
Races - White alone (% change since 2000)
Races - Black alone (%)
Races - Black alone (% change since 2000)
Races - American Indian alone (%)
Races - American Indian alone (% change since 2000)
Races - Asian alone (%)
Races - Asian alone (% change since 2000)
Races - Hispanic (%)
Races - Hispanic (% change since 2000)
Races - Native Hawaiian and Other Pacific Islander alone (%)
Races - Native Hawaiian and Other Pacific Islander alone (% change since 2000)
Races - Two or more races(%)
Races - Two or more races(% change since 2000)
Races - Other race alone (%)
Races - Other race alone (% change since 2000)
Racial diversity
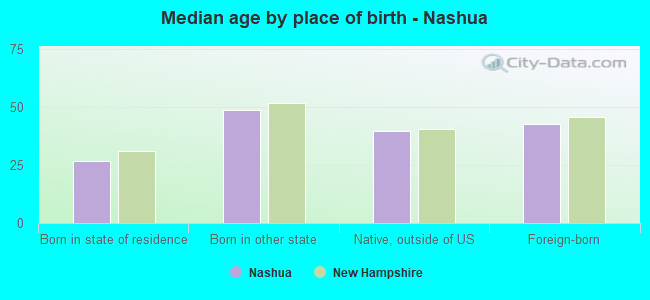
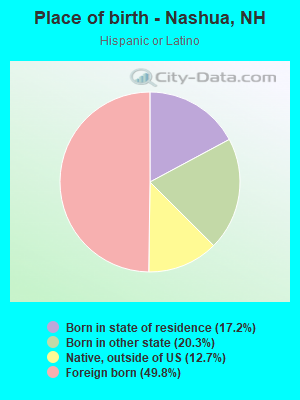
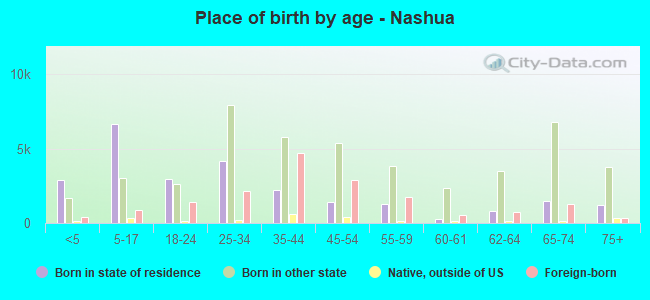
Place of birth - Born in state of residence (%)
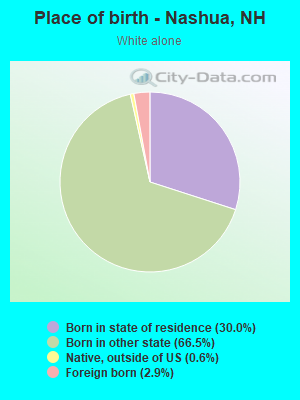
Place of birth - Born in state of residence (%) - White
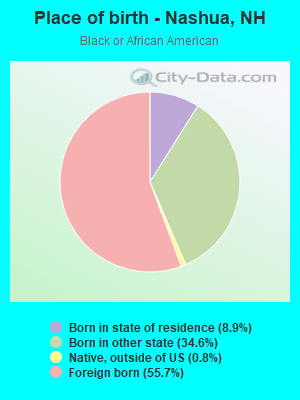
Place of birth - Born in state of residence (%) - Black or African American
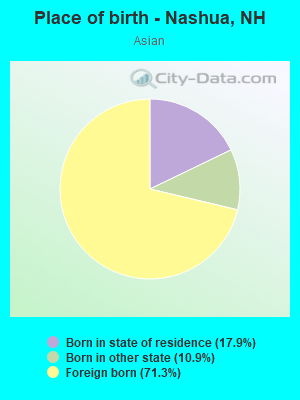
Place of birth - Born in state of residence (%) - Asian
Place of birth - Born in state of residence (%) - Hispanic or Latino
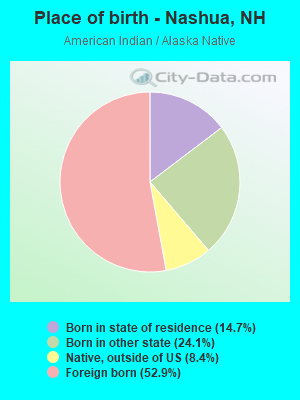
Place of birth - Born in state of residence (%) - American Indian and Alaska Native
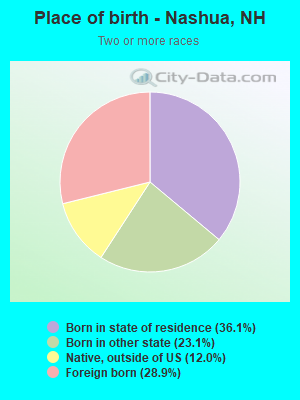
Place of birth - Born in state of residence (%) - Multirace
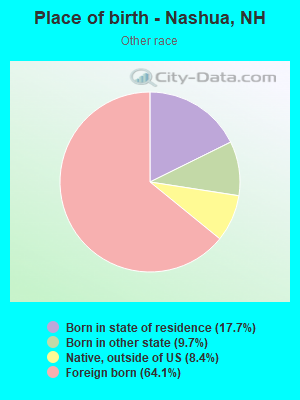
Place of birth - Born in state of residence (%) - Other Race
Place of birth - Born in other state (%)
Place of birth - Born in other state (%) - White
Place of birth - Born in other state (%) - Black or African American
Place of birth - Born in other state (%) - Asian
Place of birth - Born in other state (%) - Hispanic or Latino
Place of birth - Born in other state (%) - American Indian and Alaska Native
Place of birth - Born in other state (%) - Multirace
Place of birth - Born in other state (%) - Other Race
Place of birth - Native, outside of US (%)
Place of birth - Native, outside of US (%) - White
Place of birth - Native, outside of US (%) - Black or African American
Place of birth - Native, outside of US (%) - Asian
Place of birth - Native, outside of US (%) - Hispanic or Latino
Place of birth - Native, outside of US (%) - American Indian and Alaska Native
Place of birth - Native, outside of US (%) - Multirace
Place of birth - Native, outside of US (%) - Other Race
Place of birth - Foreign born (%)
Place of birth - Foreign born (%) - White
Place of birth - Foreign born (%) - Black or African American
Place of birth - Foreign born (%) - Asian
Place of birth - Foreign born (%) - Hispanic or Latino
Place of birth - Foreign born (%) - American Indian and Alaska Native
Place of birth - Foreign born (%) - Multirace
Place of birth - Foreign born (%) - Other Race
Residents speaking English at home (%)
Residents speaking English at home - Born in the United States (%)
Residents speaking English at home - Native, born elsewhere (%)
Residents speaking English at home - Foreign born (%)
Residents speaking Spanish at home (%)
Residents speaking Spanish at home - Born in the United States (%)
Residents speaking Spanish at home - Native, born elsewhere (%)
Residents speaking Spanish at home - Foreign born (%)
Residents speaking other language at home (%)
Residents speaking other language at home - Born in the United States (%)
Residents speaking other language at home - Native, born elsewhere (%)
Residents speaking other language at home - Foreign born (%)
Marital status - Never married (%)
Marital status - Now married (%)
Marital status - Separated (%)
Marital status - Widowed (%)
Marital status - Divorced (%)
Ancestries Reported - Arab (%)
Ancestries Reported - Czech (%)
Ancestries Reported - Danish (%)
Ancestries Reported - Dutch (%)
Ancestries Reported - English (%)
Ancestries Reported - French (%)
Ancestries Reported - French Canadian (%)
Ancestries Reported - German (%)
Ancestries Reported - Greek (%)
Ancestries Reported - Hungarian (%)
Ancestries Reported - Irish (%)
Ancestries Reported - Italian (%)
Ancestries Reported - Lithuanian (%)
Ancestries Reported - Norwegian (%)
Ancestries Reported - Polish (%)
Ancestries Reported - Portuguese (%)
Ancestries Reported - Russian (%)
Ancestries Reported - Scotch-Irish (%)
Ancestries Reported - Scottish (%)
Ancestries Reported - Slovak (%)
Ancestries Reported - Subsaharan African (%)
Ancestries Reported - Swedish (%)
Ancestries Reported - Swiss (%)
Ancestries Reported - Ukrainian (%)
Ancestries Reported - United States (%)
Ancestries Reported - Welsh (%)
Ancestries Reported - West Indian (%)
Ancestries Reported - Other (%)
Geographical mobility - Same house 1 year ago (%)
Geographical mobility - Same house 1 year ago (%) - White
Geographical mobility - Same house 1 year ago (%) - Black or African American
Geographical mobility - Same house 1 year ago (%) - Asian
Geographical mobility - Same house 1 year ago (%) - Hispanic or Latino
Geographical mobility - Same house 1 year ago (%) - American Indian and Alaska Native
Geographical mobility - Same house 1 year ago (%) - Multirace
Geographical mobility - Same house 1 year ago (%) - Other Race
Geographical mobility - Moved within same county (%)
Geographical mobility - Moved within same county (%) - White
Geographical mobility - Moved within same county (%) - Black or African American
Geographical mobility - Moved within same county (%) - Asian
Geographical mobility - Moved within same county (%) - Hispanic or Latino
Geographical mobility - Moved within same county (%) - American Indian and Alaska Native
Geographical mobility - Moved within same county (%) - Multirace
Geographical mobility - Moved within same county (%) - Other Race
Geographical mobility - Moved from different county within same state (%)
Geographical mobility - Moved from different county within same state (%) - White
Geographical mobility - Moved from different county within same state (%) - Black or African American
Geographical mobility - Moved from different county within same state (%) - Asian
Geographical mobility - Moved from different county within same state (%) - Hispanic or Latino
Geographical mobility - Moved from different county within same state (%) - American Indian and Alaska Native
Geographical mobility - Moved from different county within same state (%) - Multirace
Geographical mobility - Moved from different county within same state (%) - Other Race
Geographical mobility - Moved from different state (%)
Geographical mobility - Moved from different state (%) - White
Geographical mobility - Moved from different state (%) - Black or African American
Geographical mobility - Moved from different state (%) - Asian
Geographical mobility - Moved from different state (%) - Hispanic or Latino
Geographical mobility - Moved from different state (%) - American Indian and Alaska Native
Geographical mobility - Moved from different state (%) - Multirace
Geographical mobility - Moved from different state (%) - Other Race
Geographical mobility - Moved from abroad (%)
Geographical mobility - Moved from abroad (%) - White
Geographical mobility - Moved from abroad (%) - Black or African American
Geographical mobility - Moved from abroad (%) - Asian
Geographical mobility - Moved from abroad (%) - Hispanic or Latino
Geographical mobility - Moved from abroad (%) - American Indian and Alaska Native
Geographical mobility - Moved from abroad (%) - Multirace
Geographical mobility - Moved from abroad (%) - Other Race
Place of birth for the foreign-born population - Ireland (%)
Place of birth for the foreign-born population - Denmark (%)
Place of birth for the foreign-born population - Norway (%)
Place of birth for the foreign-born population - Sweden (%)
Place of birth for the foreign-born population - United Kingdom (%)
Place of birth for the foreign-born population - England (%)
Place of birth for the foreign-born population - Scotland (%)
Place of birth for the foreign-born population - Other Northern Europe (%)
Place of birth for the foreign-born population - Austria (%)
Place of birth for the foreign-born population - Belgium (%)
Place of birth for the foreign-born population - France (%)
Place of birth for the foreign-born population - Germany (%)
Place of birth for the foreign-born population - Netherlands (%)
Place of birth for the foreign-born population - Switzerland (%)
Place of birth for the foreign-born population - Other Western Europe (%)
Place of birth for the foreign-born population - Greece (%)
Place of birth for the foreign-born population - Italy (%)
Place of birth for the foreign-born population - Portugal (%)
Place of birth for the foreign-born population - Spain (%)
Place of birth for the foreign-born population - Other Southern Europe (%)
Place of birth for the foreign-born population - Albania (%)
Place of birth for the foreign-born population - Belarus (%)
Place of birth for the foreign-born population - Bosnia and Herzegovina (%)
Place of birth for the foreign-born population - Bulgaria (%)
Place of birth for the foreign-born population - Croatia (%)
Place of birth for the foreign-born population - Czechoslovakia (%)
Place of birth for the foreign-born population - Hungary (%)
Place of birth for the foreign-born population - Latvia (%)
Place of birth for the foreign-born population - Lithuania (%)
Place of birth for the foreign-born population - North Macedonia (Macedonia) (%)
Place of birth for the foreign-born population - Moldova (%)
Place of birth for the foreign-born population - Poland (%)
Place of birth for the foreign-born population - Romania (%)
Place of birth for the foreign-born population - Russia (%)
Place of birth for the foreign-born population - Serbia (%)
Place of birth for the foreign-born population - Ukraine (%)
Place of birth for the foreign-born population - Other Eastern Europe (%)
Place of birth for the foreign-born population - China (%)
Place of birth for the foreign-born population - Hong Kong (%)
Place of birth for the foreign-born population - Taiwan (%)
Place of birth for the foreign-born population - Japan (%)
Place of birth for the foreign-born population - Korea (%)
Place of birth for the foreign-born population - Other Eastern Asia (%)
Place of birth for the foreign-born population - Afghanistan (%)
Place of birth for the foreign-born population - Bangladesh (%)
Place of birth for the foreign-born population - India (%)
Place of birth for the foreign-born population - Iran (%)
Place of birth for the foreign-born population - Kazakhstan (%)
Place of birth for the foreign-born population - Nepal (%)
Place of birth for the foreign-born population - Pakistan (%)
Place of birth for the foreign-born population - Sri Lanka (%)
Place of birth for the foreign-born population - Uzbekistan (%)
Place of birth for the foreign-born population - Other South Central Asia (%)
Place of birth for the foreign-born population - Burma (%)
Place of birth for the foreign-born population - Cambodia (%)
Place of birth for the foreign-born population - Indonesia (%)
Place of birth for the foreign-born population - Laos (%)
Place of birth for the foreign-born population - Malaysia (%)
Place of birth for the foreign-born population - Philippines (%)
Place of birth for the foreign-born population - Singapore (%)
Place of birth for the foreign-born population - Thailand (%)
Place of birth for the foreign-born population - Vietnam (%)
Place of birth for the foreign-born population - Other South Eastern Asia (%)
Place of birth for the foreign-born population - Armenia (%)
Place of birth for the foreign-born population - Iraq (%)
Place of birth for the foreign-born population - Israel (%)
Place of birth for the foreign-born population - Jordan (%)
Place of birth for the foreign-born population - Kuwait (%)
Place of birth for the foreign-born population - Lebanon (%)
Place of birth for the foreign-born population - Saudi Arabia (%)
Place of birth for the foreign-born population - Syria (%)
Place of birth for the foreign-born population - Turkey (%)
Place of birth for the foreign-born population - Yemen (%)
Place of birth for the foreign-born population - Other Western Asia (%)
Place of birth for the foreign-born population - Eritrea (%)
Place of birth for the foreign-born population - Ethiopia (%)
Place of birth for the foreign-born population - Kenya (%)
Place of birth for the foreign-born population - Somalia (%)
Place of birth for the foreign-born population - Uganda (%)
Place of birth for the foreign-born population - Zimbabwe (%)
Place of birth for the foreign-born population - Other Eastern Africa (%)
Place of birth for the foreign-born population - Cameroon (%)
Place of birth for the foreign-born population - Congo (%)
Place of birth for the foreign-born population - Democratic Republic of Congo (Zaire) (%)
Place of birth for the foreign-born population - Other Middle Africa (%)
Place of birth for the foreign-born population - Egypt (%)
Place of birth for the foreign-born population - Morocco (%)
Place of birth for the foreign-born population - Sudan (%)
Place of birth for the foreign-born population - Other Northern Africa (%)
Place of birth for the foreign-born population - South Africa (%)
Place of birth for the foreign-born population - Other Southern Africa (%)
Place of birth for the foreign-born population - Cabo Verde (%)
Place of birth for the foreign-born population - Ghana (%)
Place of birth for the foreign-born population - Liberia (%)
Place of birth for the foreign-born population - Nigeria (%)
Place of birth for the foreign-born population - Senegal (%)
Place of birth for the foreign-born population - Sierra Leone (%)
Place of birth for the foreign-born population - Other Western Africa (%)
Place of birth for the foreign-born population - Australia (%)
Place of birth for the foreign-born population - New Zealand (%)
Place of birth for the foreign-born population - Fiji (%)
Place of birth for the foreign-born population - Micronesia (%)
Place of birth for the foreign-born population - Bahamas (%)
Place of birth for the foreign-born population - Barbados (%)
Place of birth for the foreign-born population - Cuba (%)
Place of birth for the foreign-born population - Dominica (%)
Place of birth for the foreign-born population - Dominican Republic (%)
Place of birth for the foreign-born population - Grenada (%)
Place of birth for the foreign-born population - Haiti (%)
Place of birth for the foreign-born population - Jamaica (%)
Place of birth for the foreign-born population - St. Vincent and the Grenadines (%)
Place of birth for the foreign-born population - Trinidad and Tobago (%)
Place of birth for the foreign-born population - West Indies (%)
Place of birth for the foreign-born population - Other Caribbean (%)
Place of birth for the foreign-born population - Belize (%)
Place of birth for the foreign-born population - Costa Rica (%)
Place of birth for the foreign-born population - El Salvador (%)
Place of birth for the foreign-born population - Guatemala (%)
Place of birth for the foreign-born population - Honduras (%)
Place of birth for the foreign-born population - Mexico (%)
Place of birth for the foreign-born population - Nicaragua (%)
Place of birth for the foreign-born population - Panama (%)
Place of birth for the foreign-born population - Other Central America (%)
Place of birth for the foreign-born population - Argentina (%)
Place of birth for the foreign-born population - Bolivia (%)
Place of birth for the foreign-born population - Brazil (%)
Place of birth for the foreign-born population - Chile (%)
Place of birth for the foreign-born population - Colombia (%)
Place of birth for the foreign-born population - Ecuador (%)
Place of birth for the foreign-born population - Guyana (%)
Place of birth for the foreign-born population - Peru (%)
Place of birth for the foreign-born population - Uruguay (%)
Place of birth for the foreign-born population - Venezuela (%)
Place of birth for the foreign-born population - Other South America (%)
Place of birth for the foreign-born population - Canada (%)
Place of birth for the foreign-born population - Other Northern America (%)
Place of birth for the foreign-born population - Other (%)
Latest news about races in Nashua, NH collected exclusively by city-data.com from local newspapers, TV, and radio stations
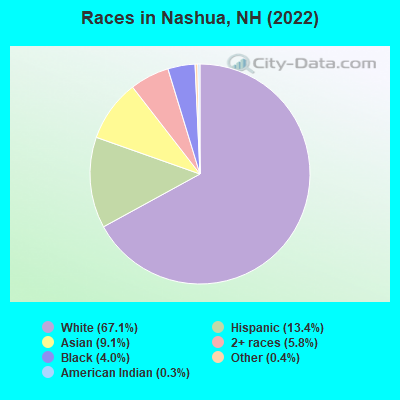
According to 2022 data, the most numerous races in Nashua, NH are White alone (61,129 residents), Hispanic (12,183 residents), and Two or more races (5,295 residents). 78.6% of Nashua residents speak English at home. 15.9% of Nashua, NH residents are foreign-born (6.2% born in Asia, 5.8% born in Latin America, 1.7% born in Europe), which is 68.6% greater than the foreign-born rate of 5.0% across the entire state of New Hampshire.
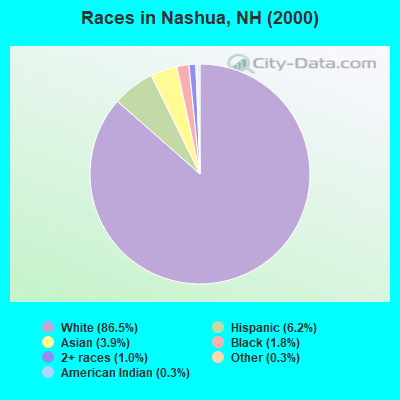
Race distribution in Nashua
2000 2022
1,175,252 95.1% White alone 20,489 1.7% Hispanic 15,803 1.3% Asian alone 11,606 0.9% Two or more races 8,354 0.7% Black alone 2,698 0.2% American Indian alone 1,254 0.1% Other race alone 330 0.03% Native Hawaiian and Other
1,208,101 86.6% White alone 63,479 4.5% Hispanic 60,724 4.4% Two or more races 36,519 2.6% Asian alone 17,931 1.3% Black alone 6,615 0.5% Other race alone 1,014 0.07% American Indian alone 848 0.06% Native Hawaiian and Other
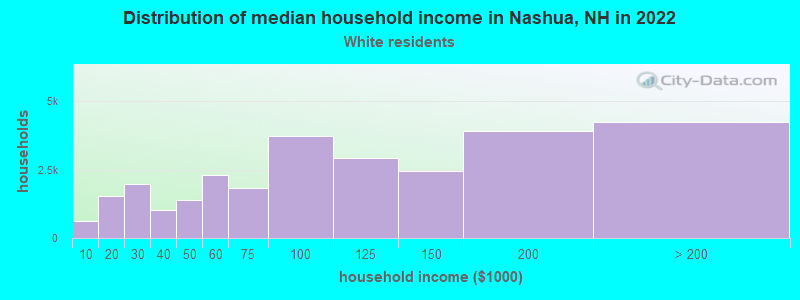
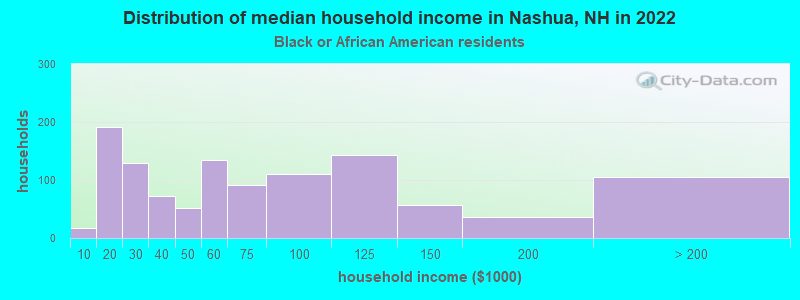
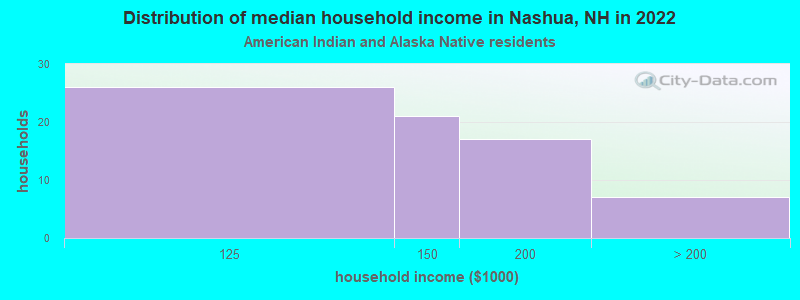
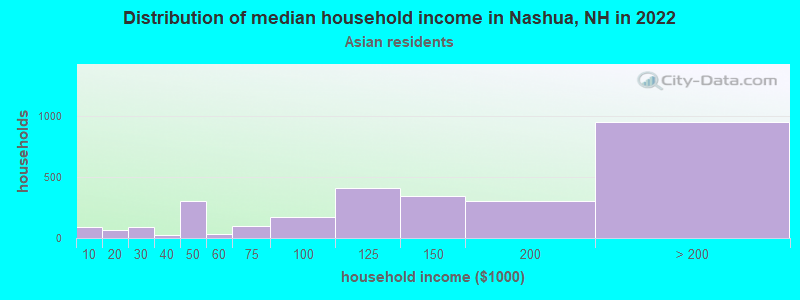
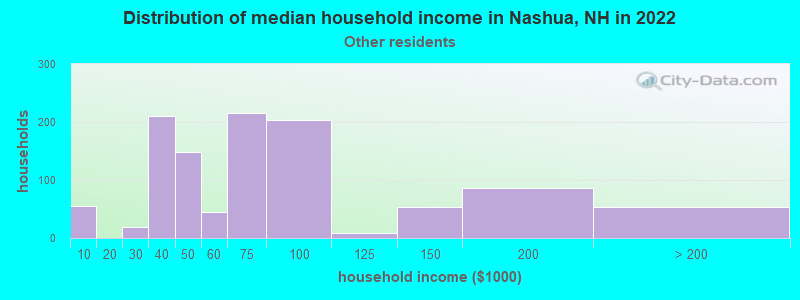
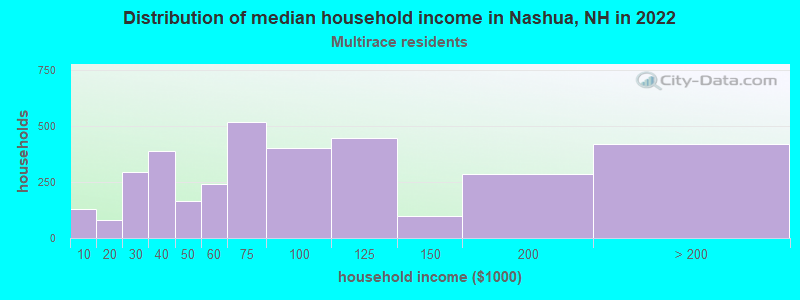
Income and house value in Nashua Median household income in 2022 $96,564 White non-Hispanic householders$58,529 Black householders$174,831 Asian householders$47,186 Some other race householders$84,956 Two or more races householders$72,626 Hispanic or Latino race householdersMedian 2022 house value $402,933 White Non-Hispanic householders$434,131 Black or African American householders$478,281 American Indian or Alaska Native householders $514,483 Asian householders$343,479 Some other race householders$344,950 Two or more races householders$389,394 Hispanic or Latino householders
Median age by race in Nashua
46.0 Median age for White residents42.2 49.5 37.4 Median age for Black or African American residents41.3 34.8 61.5 Median age for American Indian / Alaska Native residents63.2 45.5 36.8 Median age for Asian residents36.3 38.2 -666,666,666.0 Median age for Native Hawaiian / Pacific Islander residents-666,666,666.0 -666,666,666.0 35.3 Median age for Other race residents25.8 40.4 28.7 Median age for Two or more races residents35.3 27.4 46.7 Median age for White alone residents42.8 50.1 34.0 Median age for Hispanic or Latino residents33.8 34.3
Owner/renter occupied households by race in Nashua
House owners and renters - White residents 15,792 56.5% Owner occupied12,180 43.5% Renter occupiedHouse owners and renters - Black or African American residents 1,112 60.5% Owner occupied726 39.5% Renter occupiedHouse owners and renters - American Indian / Alaska Native residents 30 100.0% Owner occupiedHouse owners and renters - Asian residents 2,201 71.7% Owner occupied869 28.3% Renter occupiedHouse owners and renters - Other race residents 268 21.0% Owner occupied1,011 79.0% Renter occupiedHouse owners and renters - Two or more races residents 1,322 35.1% Owner occupied2,440 64.9% Renter occupiedHouse owners and renters - White alone residents 15,792 57.4% Owner occupied11,707 42.6% Renter occupiedHouse owners and renters - Hispanic or Latino residents 739 17.8% Owner occupied3,416 82.2% Renter occupied
Language usage in Nashua
English speakers - Total 78.6% of residents of Nashua speak English at home.
9.3% of residents speak Spanish at home 3,308 41.1% Speak English very well4,737 58.9% Speak English less than very well12.1% of residents speak other language at home 8,433 80.8% Speak English very well2,000 19.2% Speak English less than very well
English speakers - Born in the United States 96.2% of residents of Nashua speak English at home.
1.8% of residents speak Spanish at home 796 100.0% Speak English very well2.0% of residents speak other language at home 835 92.4% Speak English very well69 7.6% Speak English less than very well
English speakers - Native, born elsewhere 49.0% of residents of Nashua speak English at home.
51.0% of residents speak Spanish at home 551 50.6% Speak English very well537 49.4% Speak English less than very well
English speakers - Foreign-born 19.6% of residents of Nashua speak English at home.
30.8% of residents speak Spanish at home 939 18.3% Speak English very well4,200 81.7% Speak English less than very well49.6% of residents speak other language at home 6,334 76.6% Speak English very well1,931 23.4% Speak English less than very well
White (Caucasian) - Speak only English Native:
97.8% (56,317)Foreign-born:
34.4% (772)
White (Caucasian) - Speak another language Native:
2.2% (1,273)Foreign-born:
65.6% (1,471)
Black or African American - Speak only English Native:
84.2% (876)Foreign-born:
40.9% (544)
Black or African American - Speak another language Native:
19.9% (207)Foreign-born:
49.9% (664)
American Indian / Alaska Native - Speak only English Native:
88.7% (71)Foreign-born:
45.0% (59)
American Indian / Alaska Native - Speak another language Native:
7.7% (6)Foreign-born:
45.6% (60)
Asian - Speak only English Native:
62.0% (1,271)Foreign-born:
14.7% (872)
Asian - Speak another language Native:
38.0% (779)Foreign-born:
85.3% (5,060)
Other race - Speak only English Native:
34.1% (522)Foreign-born:
0.7% (18)
Other race - Speak another language Native:
62.0% (948)Foreign-born:
100.0% (2,426)
Two or more races - Speak only English Native:
71.6% (5,427)Foreign-born:
23.5% (817)
Two or more races - Speak another language Native:
28.4% (2,150)Foreign-born:
76.5% (2,655)
White alone - Speak only English Native:
98.3% (55,936)Foreign-born:
44.0% (772)
White alone - Speak another language Native:
1.7% (956)Foreign-born:
56.0% (983)
Hispanic or Latino - Speak only English Native:
47.8% (2,477)Foreign-born:
9.1% (515)
Hispanic or Latino - Speak another language Native:
52.2% (2,707)Foreign-born:
90.9% (5,139)
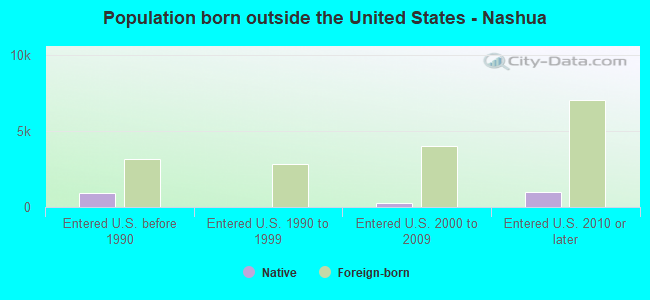
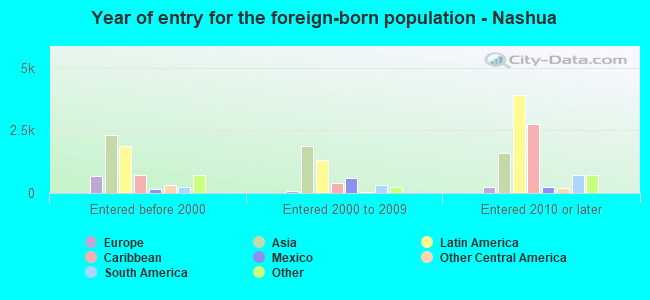
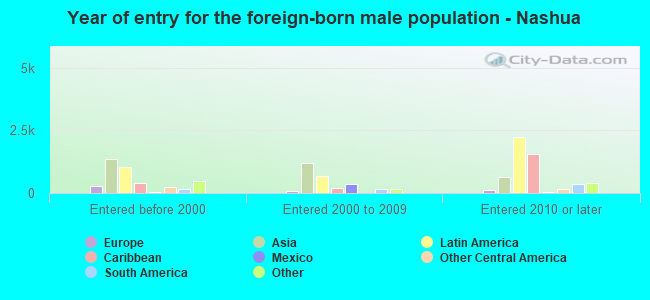
Foreign-born residents in Nashua 14,637 residents are foreign born (6.2% Asia , 5.8% Latin America , 1.7% Europe ).
This city:
15.9%New Hampshire:
6.0%
Marital status for residents in Nashua Marital status - White (Caucasian) population 15 years and over
Males 39.1% Never married45.0% Now married1.1% Separated3.3% Widowed11.4% DivorcedFemales 27.4% Never married41.8% Now married2.7% Separated9.7% Widowed18.6% DivorcedWomen who gave birth in the past 12 months Now married:
63.5% (690)Unmarried:
36.5% (396)
Women who did not give birth in the past 12 months Now married:
38.3% (4,260)Unmarried:
61.7% (6,863)
Marital status - Black or African American population 15 years and over
Males 51.3% Never married28.4% Now married6.4% Separated1.3% Widowed12.6% DivorcedFemales 36.9% Never married24.9% Now married0.0% Separated4.6% Widowed33.5% DivorcedWomen who did not give birth in the past 12 months Now married:
30.0% (201)Unmarried:
70.0% (469)
Marital status - American Indian / Alaska Native population 15 years and over
Males 0.0% Never married100.0% Now married0.0% Separated0.0% Widowed0.0% DivorcedFemales 55.8% Never married33.7% Now married0.0% Separated0.0% Widowed10.5% DivorcedWomen who gave birth in the past 12 months Now married:
100.0% (6)Unmarried:
0.0% (0)
Women who did not give birth in the past 12 months Now married:
33.3% (28)Unmarried:
66.7% (57)
Marital status - Asian population 15 years and over
Males 25.2% Never married70.9% Now married0.5% Separated0.7% Widowed2.8% DivorcedFemales 19.3% Never married66.4% Now married0.5% Separated8.1% Widowed5.7% DivorcedWomen who gave birth in the past 12 months Now married:
100.0% (76)Unmarried:
0.0% (0)
Women who did not give birth in the past 12 months Now married:
66.0% (1,094)Unmarried:
34.0% (564)
Marital status - Other race population 15 years and over
Males 29.8% Never married46.4% Now married2.9% Separated0.0% Widowed20.9% DivorcedFemales 25.5% Never married55.4% Now married0.1% Separated0.0% Widowed19.0% DivorcedWomen who gave birth in the past 12 months Now married:
72.0% (96)Unmarried:
28.0% (37)
Women who did not give birth in the past 12 months Now married:
56.6% (438)Unmarried:
43.4% (336)
Marital status - Two or more races population 15 years and over
Males 50.3% Never married26.9% Now married10.2% Separated0.0% Widowed12.6% DivorcedFemales 41.2% Never married32.7% Now married2.6% Separated5.6% Widowed17.8% DivorcedWomen who gave birth in the past 12 months Now married:
36.4% (45)Unmarried:
63.6% (79)
Women who did not give birth in the past 12 months Now married:
45.0% (1,110)Unmarried:
55.0% (1,356)
Marital status - White alone, not Hispanic / Latino population 15 years and over
Males 39.3% Never married44.5% Now married1.2% Separated3.4% Widowed11.6% DivorcedFemales 27.2% Never married41.5% Now married2.7% Separated9.8% Widowed18.8% DivorcedWomen who gave birth in the past 12 months Now married:
63.5% (690)Unmarried:
36.5% (396)
Women who did not give birth in the past 12 months Now married:
38.4% (4,195)Unmarried:
61.6% (6,716)
Marital status - Hispanic or Latino population 15 years and over
Males 45.4% Never married34.7% Now married6.3% Separated0.0% Widowed13.6% DivorcedFemales 30.1% Never married55.3% Now married3.2% Separated1.6% Widowed9.8% DivorcedWomen who gave birth in the past 12 months Now married:
42.0% (282)Unmarried:
58.0% (389)
Women who did not give birth in the past 12 months Now married:
72.1% (1,751)Unmarried:
27.9% (679)
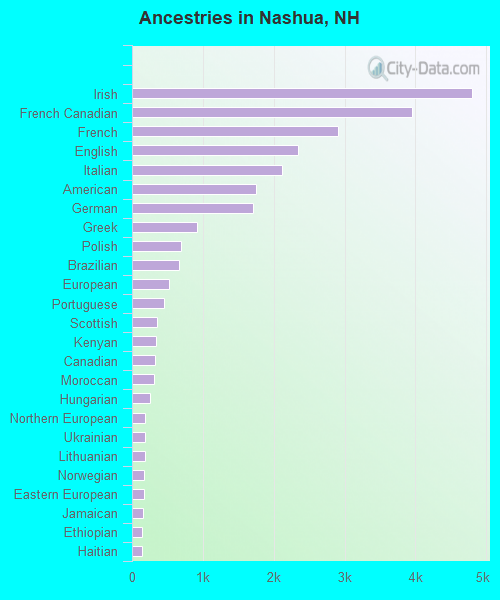
Ancestries in Nashua
4,798 11.2% Irish3,957 9.2% French Canadian2,903 6.8% French2,343 5.5% English2,116 4.9% Italian1,753 4.1% American1,706 4.0% German915 2.1% Greek694 1.6% Polish663 1.5% Brazilian525 1.2% European449 1.0% Portuguese352 0.8% Scottish337 0.8% Kenyan331 0.8% Canadian316 0.7% Moroccan255 0.6% Hungarian188 0.4% Northern European187 0.4% Ukrainian178 0.4% Lithuanian169 0.4% Norwegian166 0.4% Eastern European150 0.4% Jamaican147 0.3% Ethiopian135 0.3% Haitian132 0.3% Russian124 0.3% Swedish124 0.3% Scotch-Irish97 0.2% Iranian92 0.2% Armenian90 0.2% Syrian74 0.2% Dutch70 0.2% Welsh65 0.2% Finnish64 0.1% Danish57 0.1% Turkish52 0.1% Ghanaian48 0.1% Cape Verdean46 0.1% British43 0.1% Romanian43 0.1% African37 0.09% Egyptian31 0.07% Slovak31 0.07% Austrian28 0.07% Liberian28 0.07% Lebanese20 0.05% Swiss20 0.05% Jordanian18 0.04% Palestinian15 0.04% Albanian14 0.03% Bulgarian14 0.03% British West Indian12 0.03% Icelander12 0.03% Belgian11 0.03% Cajun11 0.03% Slavic10 0.02% Trinidadian and Tobagonian9 0.02% Slovene9 0.02% U.S. Virgin Islander9 0.02% West Indian8 0.02% Latvian5 0.01% Czechoslovakian
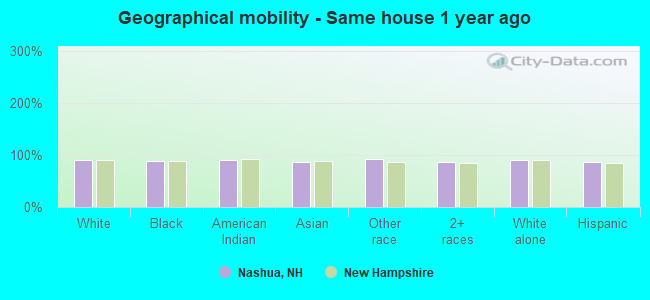
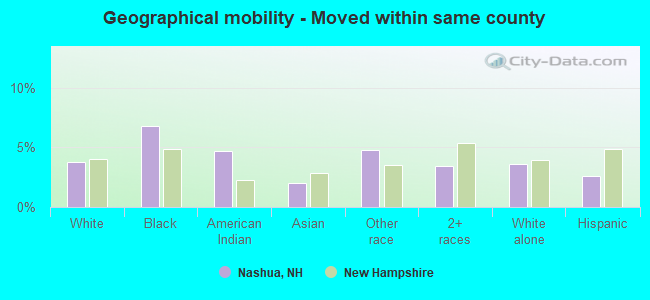
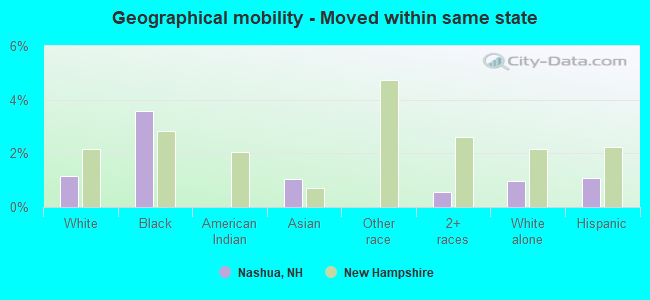
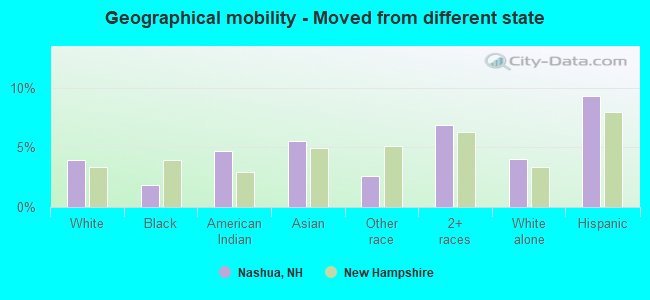
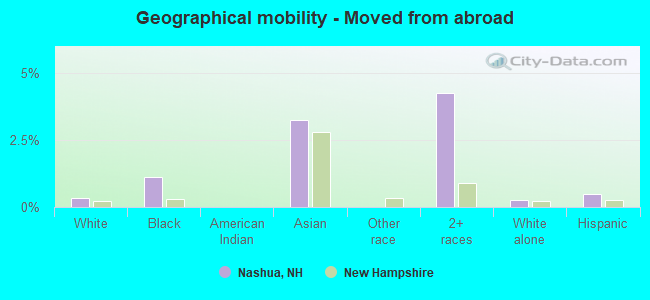
Geographical mobility in Nashua Same house 1 year ago 56,063 90.8% White (Caucasian)2,128 88.0% Black or African American178 90.6% American Indian / Alaska Native6,003 87.6% Asian3,347 91.7% Other race9,768 86.7% Two or more races55,088 91.2% White alone, not Hispanic / Latino10,090 86.5% Hispanic or LatinoMoved within same county 2,345 3.8% White / Caucasian165 6.8% Black or African American9 4.7% American Indian / Alaska Native140 2.0% Asian175 4.8% Other race392 3.5% Two or more races2,185 3.6% White alone, not Hispanic / Latino302 2.6% Hispanic or LatinoMoved within same state 709 1.1% White / Caucasian86 3.6% Black or African American71 1.0% Asian64 0.6% Two or more races583 1.0% White alone, not Hispanic / Latino126 1.1% Hispanic or LatinoMoved from different state 2,422 3.9% White / Caucasian44 1.8% Black or African American9 4.7% American Indian / Alaska Native379 5.5% Asian96 2.6% Other race772 6.9% Two or more races2,422 4.0% White alone, not Hispanic / Latino1,089 9.3% Hispanic or LatinoMoved from abroad 215 0.3% White27 1.1% Black or African American221 3.2% Asian477 4.2% Two or more races158 0.3% White alone, not Hispanic / Latino57 0.5% Hispanic or Latino
Children Nativity (place of birth) in Nashua
Children under 6 years - Living with two parents Both parents native 1,658 100.0% NativeBoth parents foreign-born 973 84.5% Native178 15.5% Foreign-bornOne native, one foreign-born parent 172 100.0% NativeChildren under 6 years - Living with one parent Native parent 1,762 100.0% NativeForeign-born parent 791 77.3% Native232 22.7% Foreign-bornChildren 6 to 17 years - Living with two parents Both parents native 4,186 100.0% NativeBoth parents foreign-born 995 59.6% Native675 40.4% Foreign-bornOne native, one foreign-born parent 353 100.0% NativeChildren 6 to 17 years - Living with one parent Native parent 2,669 100.0% NativeForeign-born parent 754 56.9% Native570 43.1% Foreign-born
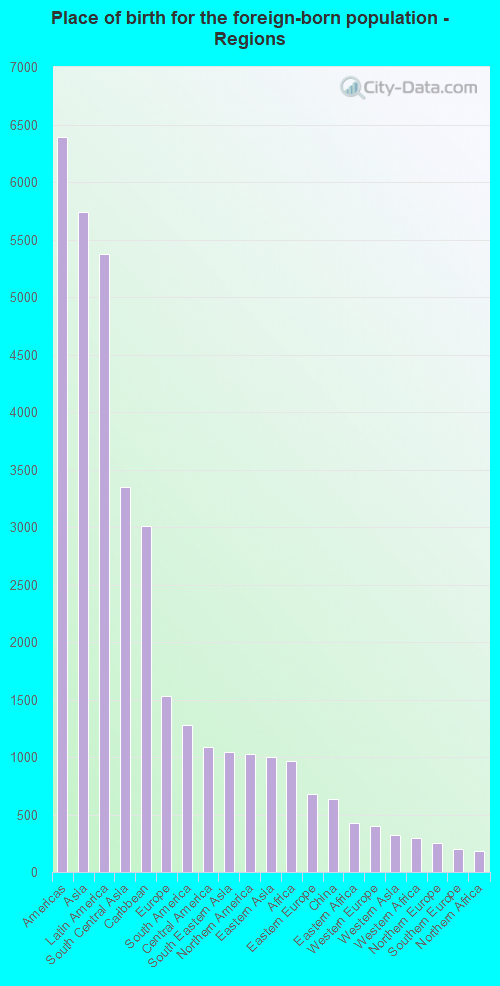
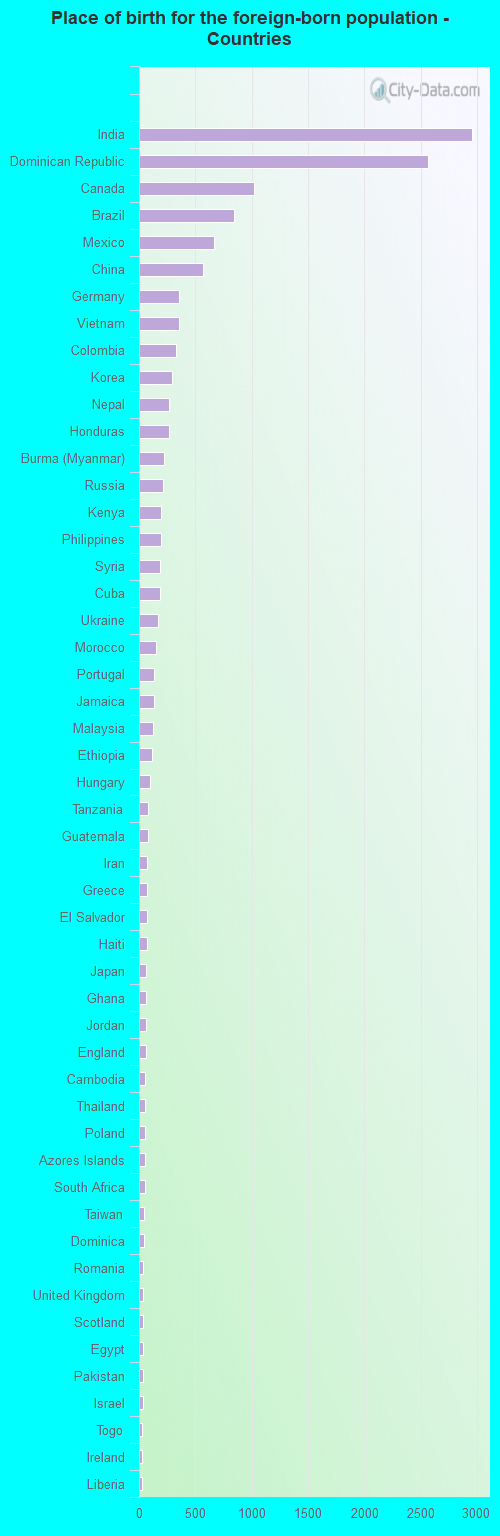
Place of birth for residents in Nashua 6,395 Americas5,737 Asia5,370 Latin America3,346 South Central Asia3,007 Caribbean1,533 Europe1,277 South America1,085 Central America1,041 South Eastern Asia1,025 Northern America1,000 Eastern Asia961 Africa677 Eastern Europe639 China427 Eastern Africa398 Western Europe325 Western Asia298 Western Africa253 Northern Europe203 Southern Europe185 Northern Africa49 Southern Africa8 Oceania8 Australia and New Zealand Subregion2,960 India2,566 Dominican Republic1,025 Canada842 Brazil670 Mexico569 China356 Germany351 Vietnam327 Colombia295 Korea268 Nepal262 Honduras219 Burma (Myanmar)214 Russia195 Kenya191 Philippines184 Syria184 Cuba170 Ukraine150 Morocco134 Portugal132 Jamaica127 Malaysia119 Ethiopia101 Hungary84 Tanzania84 Guatemala74 Iran69 Greece68 El Salvador67 Haiti65 Japan63 Ghana63 Jordan61 England54 Cambodia53 Thailand52 Poland52 Azores Islands49 South Africa47 Taiwan45 Dominica39 Romania36 United Kingdom34 Scotland34 Egypt33 Pakistan32 Israel31 Togo30 Ireland29 Liberia26 Turkey25 Uruguay24 Ecuador23 Indonesia22 Hong Kong21 Austria20 Laos18 Lebanon17 Venezuela16 Peru15 Sweden15 Albania15 Bulgaria14 Norway14 Moldova12 Netherlands10 Trinidad and Tobago10 Croatia9 Kazakhstan8 Switzerland8 Australia1 Bahamas
Grandparents responsible for own grandchildren in Nashua
Grandparents (30 to 59 years) White / Caucasian 97 20.7% Responsible for grandchildren372 79.3% Not responsible for grandchildrenBlack or African American 28 100.0% Not responsible for grandchildrenAsian 14 61.2% Responsible for grandchildren9 38.8% Not responsible for grandchildrenOther race 5 3.8% Responsible for grandchildren114 96.2% Not responsible for grandchildrenTwo or more races 33 100.0% Not responsible for grandchildrenWhite alone, not Hispanic / Latino 99 25.9% Responsible for grandchildren284 74.1% Not responsible for grandchildrenHispanic or Latino 4 1.7% Responsible for grandchildren215 98.3% Not responsible for grandchildrenGrandparents (60 years and over) White / Caucasian 483 46.0% Responsible for grandchildren567 54.0% Not responsible for grandchildrenAsian 28 23.1% Responsible for grandchildren92 76.9% Not responsible for grandchildrenOther race 22 100.0% Not responsible for grandchildrenTwo or more races 144 100.0% Not responsible for grandchildrenWhite alone, not Hispanic / Latino 483 45.7% Responsible for grandchildren573 54.3% Not responsible for grandchildrenHispanic or Latino 99 100.0% Not responsible for grandchildren