Races in Nashville-Davidson, Tennessee (TN) Detailed Stats
Data:
Races - White alone (%)
Races - White alone (% change since 2000)
Races - Black alone (%)
Races - Black alone (% change since 2000)
Races - American Indian alone (%)
Races - American Indian alone (% change since 2000)
Races - Asian alone (%)
Races - Asian alone (% change since 2000)
Races - Hispanic (%)
Races - Hispanic (% change since 2000)
Races - Native Hawaiian and Other Pacific Islander alone (%)
Races - Native Hawaiian and Other Pacific Islander alone (% change since 2000)
Races - Two or more races(%)
Races - Two or more races(% change since 2000)
Races - Other race alone (%)
Races - Other race alone (% change since 2000)
Racial diversity
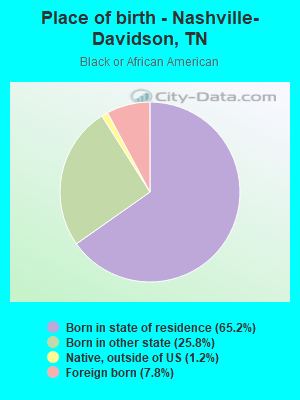
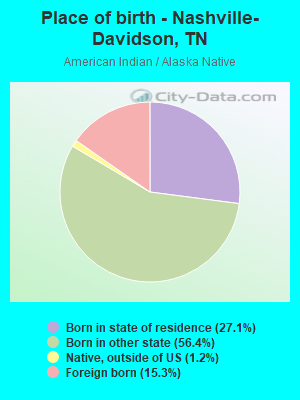
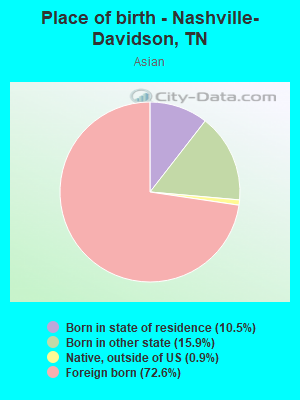
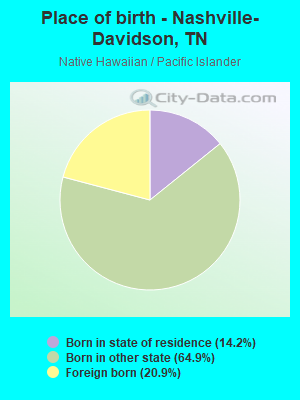
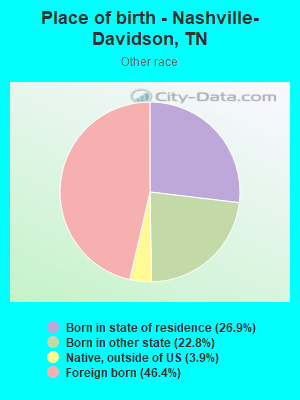
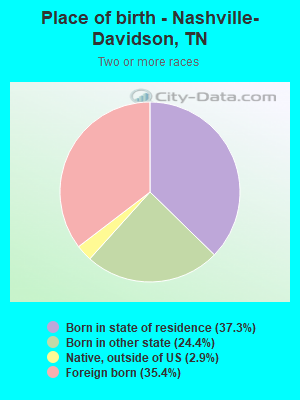
Place of birth - Born in state of residence (%)
Place of birth - Born in state of residence (%) - White
Place of birth - Born in state of residence (%) - Black or African American
Place of birth - Born in state of residence (%) - Asian
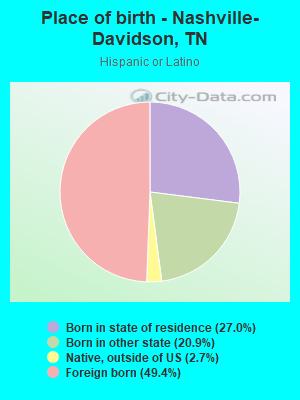
Place of birth - Born in state of residence (%) - Hispanic or Latino
Place of birth - Born in state of residence (%) - American Indian and Alaska Native
Place of birth - Born in state of residence (%) - Multirace
Place of birth - Born in state of residence (%) - Other Race
Place of birth - Born in other state (%)
Place of birth - Born in other state (%) - White
Place of birth - Born in other state (%) - Black or African American
Place of birth - Born in other state (%) - Asian
Place of birth - Born in other state (%) - Hispanic or Latino
Place of birth - Born in other state (%) - American Indian and Alaska Native
Place of birth - Born in other state (%) - Multirace
Place of birth - Born in other state (%) - Other Race
Place of birth - Native, outside of US (%)
Place of birth - Native, outside of US (%) - White
Place of birth - Native, outside of US (%) - Black or African American
Place of birth - Native, outside of US (%) - Asian
Place of birth - Native, outside of US (%) - Hispanic or Latino
Place of birth - Native, outside of US (%) - American Indian and Alaska Native
Place of birth - Native, outside of US (%) - Multirace
Place of birth - Native, outside of US (%) - Other Race
Place of birth - Foreign born (%)
Place of birth - Foreign born (%) - White
Place of birth - Foreign born (%) - Black or African American
Place of birth - Foreign born (%) - Asian
Place of birth - Foreign born (%) - Hispanic or Latino
Place of birth - Foreign born (%) - American Indian and Alaska Native
Place of birth - Foreign born (%) - Multirace
Place of birth - Foreign born (%) - Other Race
Residents speaking English at home (%)
Residents speaking English at home - Born in the United States (%)
Residents speaking English at home - Native, born elsewhere (%)
Residents speaking English at home - Foreign born (%)
Residents speaking Spanish at home (%)
Residents speaking Spanish at home - Born in the United States (%)
Residents speaking Spanish at home - Native, born elsewhere (%)
Residents speaking Spanish at home - Foreign born (%)
Residents speaking other language at home (%)
Residents speaking other language at home - Born in the United States (%)
Residents speaking other language at home - Native, born elsewhere (%)
Residents speaking other language at home - Foreign born (%)
Marital status - Never married (%)
Marital status - Now married (%)
Marital status - Separated (%)
Marital status - Widowed (%)
Marital status - Divorced (%)
Ancestries Reported - Arab (%)
Ancestries Reported - Czech (%)
Ancestries Reported - Danish (%)
Ancestries Reported - Dutch (%)
Ancestries Reported - English (%)
Ancestries Reported - French (%)
Ancestries Reported - French Canadian (%)
Ancestries Reported - German (%)
Ancestries Reported - Greek (%)
Ancestries Reported - Hungarian (%)
Ancestries Reported - Irish (%)
Ancestries Reported - Italian (%)
Ancestries Reported - Lithuanian (%)
Ancestries Reported - Norwegian (%)
Ancestries Reported - Polish (%)
Ancestries Reported - Portuguese (%)
Ancestries Reported - Russian (%)
Ancestries Reported - Scotch-Irish (%)
Ancestries Reported - Scottish (%)
Ancestries Reported - Slovak (%)
Ancestries Reported - Subsaharan African (%)
Ancestries Reported - Swedish (%)
Ancestries Reported - Swiss (%)
Ancestries Reported - Ukrainian (%)
Ancestries Reported - United States (%)
Ancestries Reported - Welsh (%)
Ancestries Reported - West Indian (%)
Ancestries Reported - Other (%)
Geographical mobility - Same house 1 year ago (%)
Geographical mobility - Same house 1 year ago (%) - White
Geographical mobility - Same house 1 year ago (%) - Black or African American
Geographical mobility - Same house 1 year ago (%) - Asian
Geographical mobility - Same house 1 year ago (%) - Hispanic or Latino
Geographical mobility - Same house 1 year ago (%) - American Indian and Alaska Native
Geographical mobility - Same house 1 year ago (%) - Multirace
Geographical mobility - Same house 1 year ago (%) - Other Race
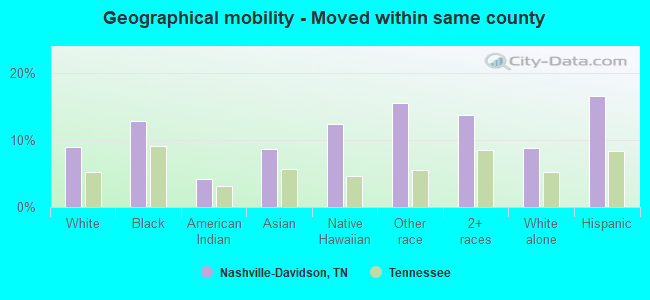
Geographical mobility - Moved within same county (%)
Geographical mobility - Moved within same county (%) - White
Geographical mobility - Moved within same county (%) - Black or African American
Geographical mobility - Moved within same county (%) - Asian
Geographical mobility - Moved within same county (%) - Hispanic or Latino
Geographical mobility - Moved within same county (%) - American Indian and Alaska Native
Geographical mobility - Moved within same county (%) - Multirace
Geographical mobility - Moved within same county (%) - Other Race
Geographical mobility - Moved from different county within same state (%)
Geographical mobility - Moved from different county within same state (%) - White
Geographical mobility - Moved from different county within same state (%) - Black or African American
Geographical mobility - Moved from different county within same state (%) - Asian
Geographical mobility - Moved from different county within same state (%) - Hispanic or Latino
Geographical mobility - Moved from different county within same state (%) - American Indian and Alaska Native
Geographical mobility - Moved from different county within same state (%) - Multirace
Geographical mobility - Moved from different county within same state (%) - Other Race
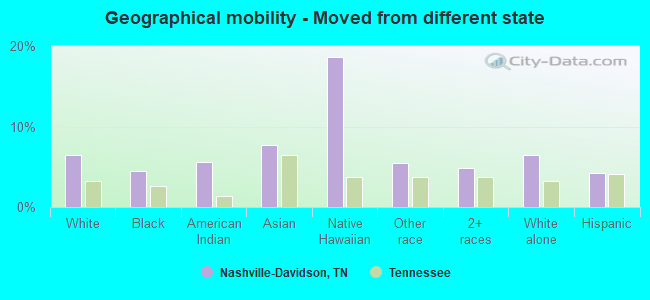
Geographical mobility - Moved from different state (%)
Geographical mobility - Moved from different state (%) - White
Geographical mobility - Moved from different state (%) - Black or African American
Geographical mobility - Moved from different state (%) - Asian
Geographical mobility - Moved from different state (%) - Hispanic or Latino
Geographical mobility - Moved from different state (%) - American Indian and Alaska Native
Geographical mobility - Moved from different state (%) - Multirace
Geographical mobility - Moved from different state (%) - Other Race
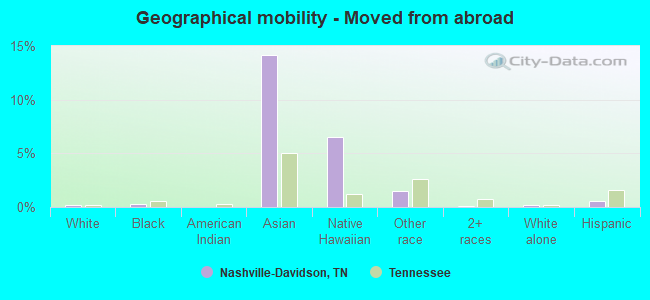
Geographical mobility - Moved from abroad (%)
Geographical mobility - Moved from abroad (%) - White
Geographical mobility - Moved from abroad (%) - Black or African American
Geographical mobility - Moved from abroad (%) - Asian
Geographical mobility - Moved from abroad (%) - Hispanic or Latino
Geographical mobility - Moved from abroad (%) - American Indian and Alaska Native
Geographical mobility - Moved from abroad (%) - Multirace
Geographical mobility - Moved from abroad (%) - Other Race
Place of birth for the foreign-born population - Ireland (%)
Place of birth for the foreign-born population - Denmark (%)
Place of birth for the foreign-born population - Norway (%)
Place of birth for the foreign-born population - Sweden (%)
Place of birth for the foreign-born population - United Kingdom (%)
Place of birth for the foreign-born population - England (%)
Place of birth for the foreign-born population - Scotland (%)
Place of birth for the foreign-born population - Other Northern Europe (%)
Place of birth for the foreign-born population - Austria (%)
Place of birth for the foreign-born population - Belgium (%)
Place of birth for the foreign-born population - France (%)
Place of birth for the foreign-born population - Germany (%)
Place of birth for the foreign-born population - Netherlands (%)
Place of birth for the foreign-born population - Switzerland (%)
Place of birth for the foreign-born population - Other Western Europe (%)
Place of birth for the foreign-born population - Greece (%)
Place of birth for the foreign-born population - Italy (%)
Place of birth for the foreign-born population - Portugal (%)
Place of birth for the foreign-born population - Spain (%)
Place of birth for the foreign-born population - Other Southern Europe (%)
Place of birth for the foreign-born population - Albania (%)
Place of birth for the foreign-born population - Belarus (%)
Place of birth for the foreign-born population - Bosnia and Herzegovina (%)
Place of birth for the foreign-born population - Bulgaria (%)
Place of birth for the foreign-born population - Croatia (%)
Place of birth for the foreign-born population - Czechoslovakia (%)
Place of birth for the foreign-born population - Hungary (%)
Place of birth for the foreign-born population - Latvia (%)
Place of birth for the foreign-born population - Lithuania (%)
Place of birth for the foreign-born population - North Macedonia (Macedonia) (%)
Place of birth for the foreign-born population - Moldova (%)
Place of birth for the foreign-born population - Poland (%)
Place of birth for the foreign-born population - Romania (%)
Place of birth for the foreign-born population - Russia (%)
Place of birth for the foreign-born population - Serbia (%)
Place of birth for the foreign-born population - Ukraine (%)
Place of birth for the foreign-born population - Other Eastern Europe (%)
Place of birth for the foreign-born population - China (%)
Place of birth for the foreign-born population - Hong Kong (%)
Place of birth for the foreign-born population - Taiwan (%)
Place of birth for the foreign-born population - Japan (%)
Place of birth for the foreign-born population - Korea (%)
Place of birth for the foreign-born population - Other Eastern Asia (%)
Place of birth for the foreign-born population - Afghanistan (%)
Place of birth for the foreign-born population - Bangladesh (%)
Place of birth for the foreign-born population - India (%)
Place of birth for the foreign-born population - Iran (%)
Place of birth for the foreign-born population - Kazakhstan (%)
Place of birth for the foreign-born population - Nepal (%)
Place of birth for the foreign-born population - Pakistan (%)
Place of birth for the foreign-born population - Sri Lanka (%)
Place of birth for the foreign-born population - Uzbekistan (%)
Place of birth for the foreign-born population - Other South Central Asia (%)
Place of birth for the foreign-born population - Burma (%)
Place of birth for the foreign-born population - Cambodia (%)
Place of birth for the foreign-born population - Indonesia (%)
Place of birth for the foreign-born population - Laos (%)
Place of birth for the foreign-born population - Malaysia (%)
Place of birth for the foreign-born population - Philippines (%)
Place of birth for the foreign-born population - Singapore (%)
Place of birth for the foreign-born population - Thailand (%)
Place of birth for the foreign-born population - Vietnam (%)
Place of birth for the foreign-born population - Other South Eastern Asia (%)
Place of birth for the foreign-born population - Armenia (%)
Place of birth for the foreign-born population - Iraq (%)
Place of birth for the foreign-born population - Israel (%)
Place of birth for the foreign-born population - Jordan (%)
Place of birth for the foreign-born population - Kuwait (%)
Place of birth for the foreign-born population - Lebanon (%)
Place of birth for the foreign-born population - Saudi Arabia (%)
Place of birth for the foreign-born population - Syria (%)
Place of birth for the foreign-born population - Turkey (%)
Place of birth for the foreign-born population - Yemen (%)
Place of birth for the foreign-born population - Other Western Asia (%)
Place of birth for the foreign-born population - Eritrea (%)
Place of birth for the foreign-born population - Ethiopia (%)
Place of birth for the foreign-born population - Kenya (%)
Place of birth for the foreign-born population - Somalia (%)
Place of birth for the foreign-born population - Uganda (%)
Place of birth for the foreign-born population - Zimbabwe (%)
Place of birth for the foreign-born population - Other Eastern Africa (%)
Place of birth for the foreign-born population - Cameroon (%)
Place of birth for the foreign-born population - Congo (%)
Place of birth for the foreign-born population - Democratic Republic of Congo (Zaire) (%)
Place of birth for the foreign-born population - Other Middle Africa (%)
Place of birth for the foreign-born population - Egypt (%)
Place of birth for the foreign-born population - Morocco (%)
Place of birth for the foreign-born population - Sudan (%)
Place of birth for the foreign-born population - Other Northern Africa (%)
Place of birth for the foreign-born population - South Africa (%)
Place of birth for the foreign-born population - Other Southern Africa (%)
Place of birth for the foreign-born population - Cabo Verde (%)
Place of birth for the foreign-born population - Ghana (%)
Place of birth for the foreign-born population - Liberia (%)
Place of birth for the foreign-born population - Nigeria (%)
Place of birth for the foreign-born population - Senegal (%)
Place of birth for the foreign-born population - Sierra Leone (%)
Place of birth for the foreign-born population - Other Western Africa (%)
Place of birth for the foreign-born population - Australia (%)
Place of birth for the foreign-born population - New Zealand (%)
Place of birth for the foreign-born population - Fiji (%)
Place of birth for the foreign-born population - Micronesia (%)
Place of birth for the foreign-born population - Bahamas (%)
Place of birth for the foreign-born population - Barbados (%)
Place of birth for the foreign-born population - Cuba (%)
Place of birth for the foreign-born population - Dominica (%)
Place of birth for the foreign-born population - Dominican Republic (%)
Place of birth for the foreign-born population - Grenada (%)
Place of birth for the foreign-born population - Haiti (%)
Place of birth for the foreign-born population - Jamaica (%)
Place of birth for the foreign-born population - St. Vincent and the Grenadines (%)
Place of birth for the foreign-born population - Trinidad and Tobago (%)
Place of birth for the foreign-born population - West Indies (%)
Place of birth for the foreign-born population - Other Caribbean (%)
Place of birth for the foreign-born population - Belize (%)
Place of birth for the foreign-born population - Costa Rica (%)
Place of birth for the foreign-born population - El Salvador (%)
Place of birth for the foreign-born population - Guatemala (%)
Place of birth for the foreign-born population - Honduras (%)
Place of birth for the foreign-born population - Mexico (%)
Place of birth for the foreign-born population - Nicaragua (%)
Place of birth for the foreign-born population - Panama (%)
Place of birth for the foreign-born population - Other Central America (%)
Place of birth for the foreign-born population - Argentina (%)
Place of birth for the foreign-born population - Bolivia (%)
Place of birth for the foreign-born population - Brazil (%)
Place of birth for the foreign-born population - Chile (%)
Place of birth for the foreign-born population - Colombia (%)
Place of birth for the foreign-born population - Ecuador (%)
Place of birth for the foreign-born population - Guyana (%)
Place of birth for the foreign-born population - Peru (%)
Place of birth for the foreign-born population - Uruguay (%)
Place of birth for the foreign-born population - Venezuela (%)
Place of birth for the foreign-born population - Other South America (%)
Place of birth for the foreign-born population - Canada (%)
Place of birth for the foreign-born population - Other Northern America (%)
Place of birth for the foreign-born population - Other (%)
Latest news about races in Nashville-Davidson, TN collected exclusively by city-data.com from local newspapers, TV, and radio stations
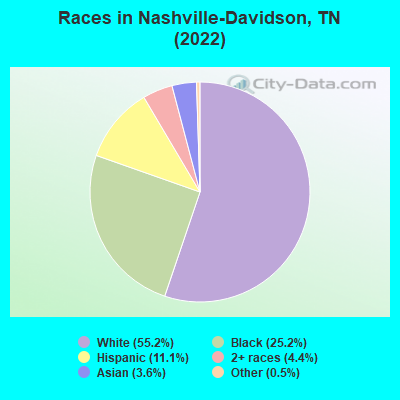
According to 2022 data, the most numerous races in Nashville-Davidson, TN are White alone (377,406 residents), Black alone (172,027 residents), and Hispanic (75,860 residents). 83.3% of Nashville-Davidson residents speak English at home. 14.3% of Nashville-Davidson, TN residents are foreign-born (5.6% born in Latin America, 3.9% born in Asia, 2.9% born in Africa), which is 65.1% greater than the foreign-born rate of 5.0% across the entire state of Tennessee.
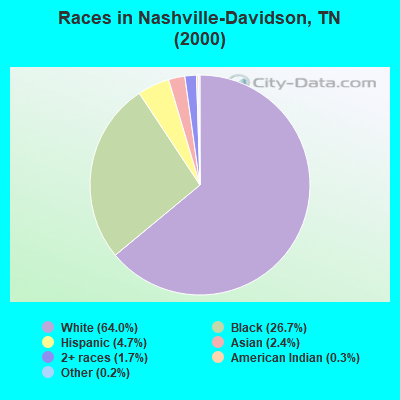
Race distribution in Nashville-Davidson
2000 2022
349,104 64.0% White alone 145,483 26.7% Black alone 25,774 4.7% Hispanic 12,905 2.4% Asian alone 9,523 1.7% Two or more races 1,459 0.3% American Indian alone 914 0.2% Other race alone 362 0.07% Native Hawaiian and Other
377,406 55.2% White alone 172,027 25.2% Black alone 75,860 11.1% Hispanic 29,861 4.4% Two or more races 24,696 3.6% Asian alone 3,287 0.5% Other race alone 408 0.06% Native Hawaiian and Other 94 0.01% American Indian alone
2000 2022
4,505,930 79.2% White alone 928,204 16.3% Black alone 123,838 2.2% Hispanic 54,824 1.0% Two or more races 56,077 1.0% Asian alone 13,820 0.2% American Indian alone 4,780 0.08% Other race alone 1,810 0.03% Native Hawaiian and Other
5,070,026 71.9% White alone 1,089,738 15.5% Black alone 442,629 6.3% Hispanic 279,381 4.0% Two or more races 131,817 1.9% Asian alone 26,972 0.4% Other race alone 6,387 0.09% American Indian alone 4,389 0.06% Native Hawaiian and Other
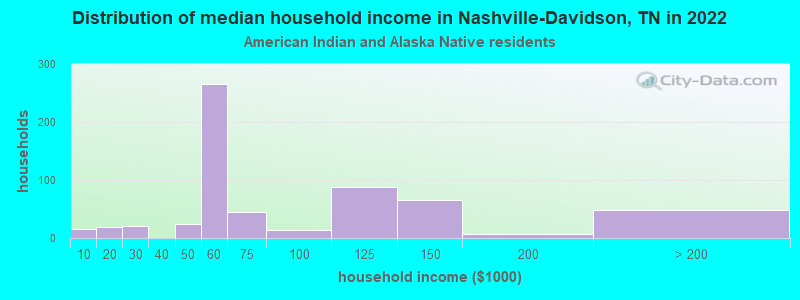
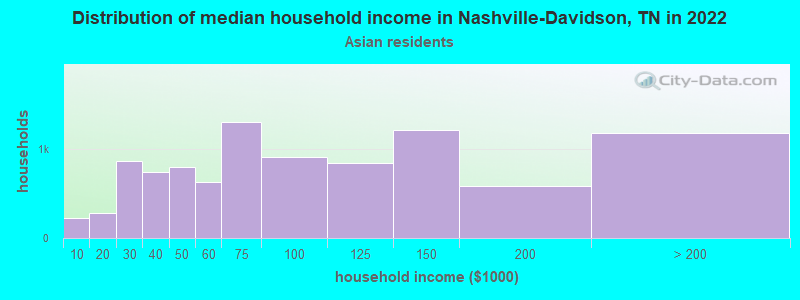
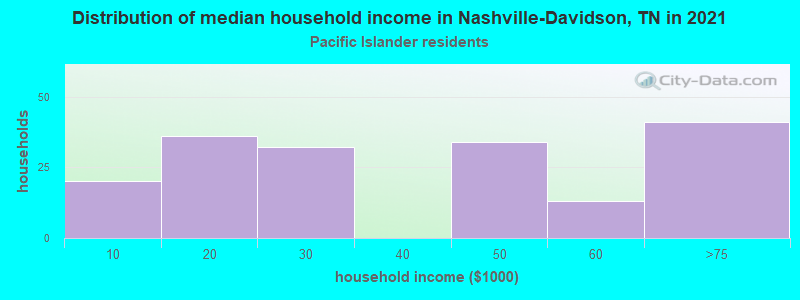
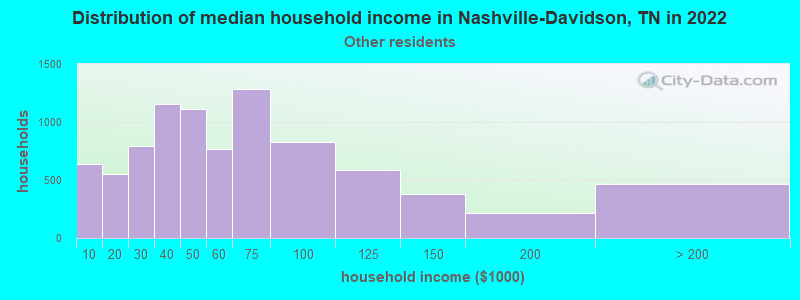
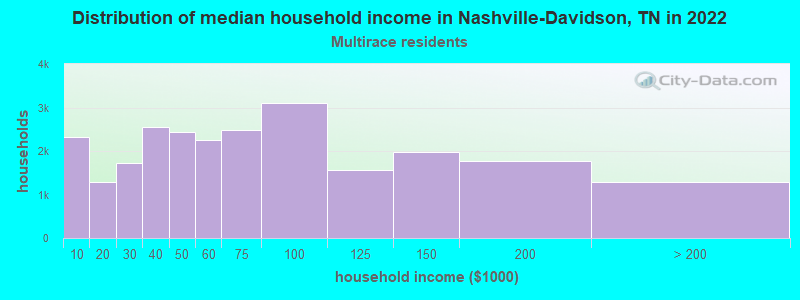
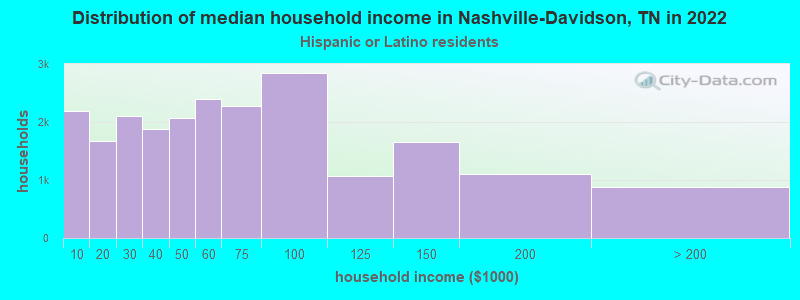
Income and house value in Nashville-Davidson Median household income in 2022 $83,280 White non-Hispanic householders$51,472 Black householders$56,726 American Indian and Alaska Native householders$74,201 Asian householders$148,657 Native Hawaiian and other Pacific Islander householders$45,593 Some other race householders$58,769 Two or more races householders$54,495 Hispanic or Latino race householdersMedian 2022 house value $469,915 White Non-Hispanic householders$339,963 Black or African American householders$363,943 American Indian or Alaska Native householders $478,424 Asian householders$587,104 Native Hawaiian and other Pacific Islander householders$364,716 Some other race householders$406,486 Two or more races householders$375,159 Hispanic or Latino householders
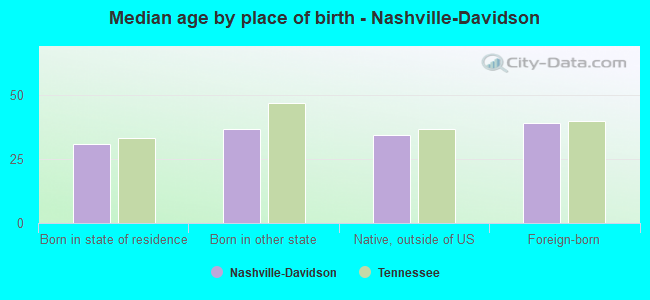
Median age by race in Nashville-Davidson
37.3 Median age for White residents36.8 37.8 34.3 Median age for Black or African American residents31.9 36.8 62.0 Median age for American Indian / Alaska Native residents45.6 62.3 34.7 Median age for Asian residents34.3 36.2 51.9 Median age for Native Hawaiian / Pacific Islander residents36.7 60.2 29.3 Median age for Other race residents29.9 28.7 26.1 Median age for Two or more races residents26.9 24.5 37.5 Median age for White alone residents37.0 38.0 26.0 Median age for Hispanic or Latino residents26.8 24.6
Owner/renter occupied households by race in Nashville-Davidson
House owners and renters - White residents 119,265 60.4% Owner occupied78,083 39.6% Renter occupiedHouse owners and renters - Black or African American residents 30,545 39.0% Owner occupied47,701 61.0% Renter occupiedHouse owners and renters - American Indian / Alaska Native residents 195 42.7% Owner occupied262 57.3% Renter occupiedHouse owners and renters - Asian residents 6,112 63.7% Owner occupied3,488 36.3% Renter occupiedHouse owners and renters - Native Hawaiian / Pacific Islander residents 42 13.4% Owner occupied270 86.6% Renter occupiedHouse owners and renters - Other race residents 3,511 52.3% Owner occupied3,206 47.7% Renter occupiedHouse owners and renters - Two or more races residents 6,699 27.0% Owner occupied18,076 73.0% Renter occupiedHouse owners and renters - White alone residents 117,952 60.7% Owner occupied76,366 39.3% Renter occupiedHouse owners and renters - Hispanic or Latino residents 7,040 31.8% Owner occupied15,099 68.2% Renter occupied
Language usage in Nashville-Davidson
English speakers - Total 83.3% of residents of Nashville-Davidson speak English at home.
8.6% of residents speak Spanish at home 17,712 32.2% Speak English very well37,245 67.8% Speak English less than very well8.2% of residents speak other language at home 29,336 56.1% Speak English very well22,983 43.9% Speak English less than very well
English speakers - Born in the United States 94.8% of residents of Nashville-Davidson speak English at home.
3.7% of residents speak Spanish at home 6,609 65.4% Speak English very well3,489 34.6% Speak English less than very well1.5% of residents speak other language at home 4,122 99.7% Speak English very well11 0.3% Speak English less than very well
English speakers - Native, born elsewhere 63.8% of residents of Nashville-Davidson speak English at home.
13.6% of residents speak Spanish at home 667 58.1% Speak English very well481 41.9% Speak English less than very well22.6% of residents speak other language at home 913 47.9% Speak English very well993 52.1% Speak English less than very well
English speakers - Foreign-born 14.1% of residents of Nashville-Davidson speak English at home.
41.0% of residents speak Spanish at home 6,230 17.6% Speak English very well29,071 82.4% Speak English less than very well44.9% of residents speak other language at home 17,390 44.9% Speak English very well21,310 55.1% Speak English less than very well
White (Caucasian) - Speak only English Native:
97.0% (336,259)Foreign-born:
20.2% (3,899)
White (Caucasian) - Speak another language Native:
3.0% (10,479)Foreign-born:
79.8% (15,422)
Black or African American - Speak only English Native:
97.3% (145,446)Foreign-born:
24.2% (3,204)
Black or African American - Speak another language Native:
2.7% (4,053)Foreign-born:
75.8% (10,020)
American Indian / Alaska Native - Speak only English Native:
70.3% (622)Foreign-born:
10.8% (21)
American Indian / Alaska Native - Speak another language Native:
33.7% (298)Foreign-born:
89.5% (171)
Asian - Speak only English Native:
40.7% (2,694)Foreign-born:
16.5% (2,867)
Asian - Speak another language Native:
59.3% (3,926)Foreign-born:
83.5% (14,523)
Native Hawaiian / Pacific Islander - Speak only English Native:
67.1% (215)Foreign-born:
20.0% (19)
Native Hawaiian / Pacific Islander - Speak another language Native:
17.6% (56)Foreign-born:
85.6% (82)
Other race - Speak only English Native:
45.8% (4,152)Foreign-born:
9.7% (955)
Other race - Speak another language Native:
54.2% (4,914)Foreign-born:
90.3% (8,887)
Two or more races - Speak only English Native:
77.7% (32,618)Foreign-born:
4.7% (1,233)
Two or more races - Speak another language Native:
22.3% (9,373)Foreign-born:
95.3% (25,050)
White alone - Speak only English Native:
97.3% (332,966)Foreign-born:
21.9% (3,899)
White alone - Speak another language Native:
2.7% (9,085)Foreign-born:
78.1% (13,929)
Hispanic or Latino - Speak only English Native:
50.4% (15,267)Foreign-born:
3.9% (1,412)
Hispanic or Latino - Speak another language Native:
49.6% (15,026)Foreign-born:
96.1% (34,919)
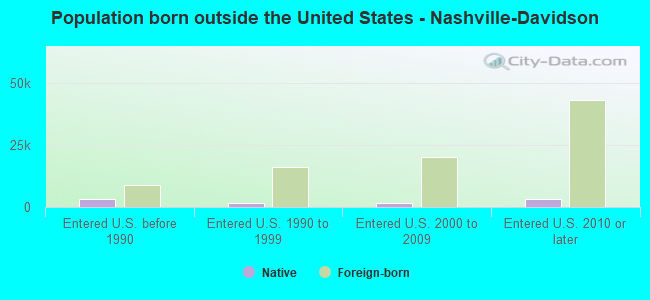
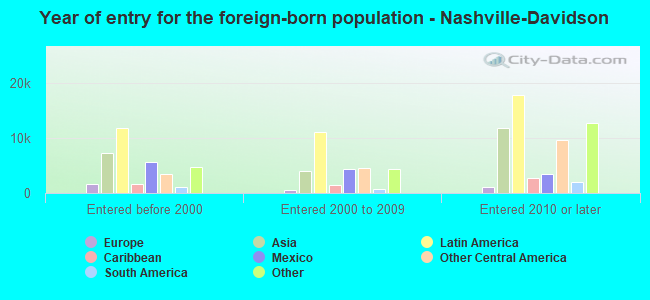
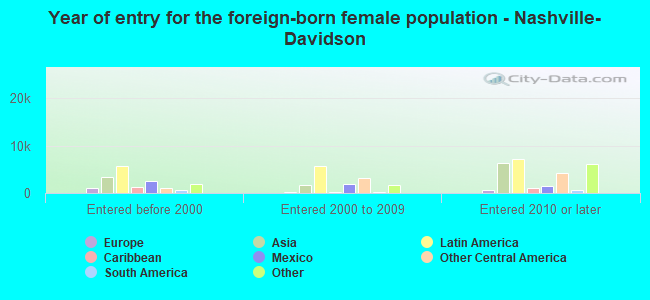
Foreign-born residents in Nashville-Davidson 97,863 residents are foreign born (5.6% Latin America , 3.9% Asia , 2.9% Africa ).
This city:
14.3%Tennessee:
5.4%
Marital status for residents in Nashville-Davidson Marital status - White (Caucasian) population 15 years and over
Males 39.2% Never married47.8% Now married0.7% Separated1.6% Widowed10.6% DivorcedFemales 34.7% Never married44.7% Now married0.5% Separated6.5% Widowed13.6% DivorcedWomen who gave birth in the past 12 months Now married:
81.9% (4,767)Unmarried:
18.1% (1,051)
Women who did not give birth in the past 12 months Now married:
39.2% (39,830)Unmarried:
60.8% (61,716)
Marital status - Black or African American population 15 years and over
Males 53.4% Never married31.0% Now married1.3% Separated3.1% Widowed11.2% DivorcedFemales 52.0% Never married21.9% Now married2.8% Separated8.1% Widowed15.1% DivorcedWomen who gave birth in the past 12 months Now married:
33.4% (932)Unmarried:
66.6% (1,860)
Women who did not give birth in the past 12 months Now married:
19.5% (8,748)Unmarried:
80.5% (36,027)
Marital status - American Indian / Alaska Native population 15 years and over
Males 35.1% Never married41.4% Now married3.3% Separated0.0% Widowed20.1% DivorcedFemales 28.3% Never married32.6% Now married14.4% Separated0.0% Widowed24.7% DivorcedWomen who did not give birth in the past 12 months Now married:
30.1% (94)Unmarried:
69.9% (219)
Marital status - Asian population 15 years and over
Males 47.4% Never married45.1% Now married0.7% Separated1.5% Widowed5.2% DivorcedFemales 35.0% Never married48.9% Now married5.2% Separated4.7% Widowed6.2% DivorcedWomen who gave birth in the past 12 months Now married:
97.7% (241)Unmarried:
2.3% (6)
Women who did not give birth in the past 12 months Now married:
50.2% (3,634)Unmarried:
49.8% (3,601)
Marital status - Native Hawaiian / Pacific Islander population 15 years and over
Males 61.9% Never married22.3% Now married1.4% Separated0.0% Widowed14.4% DivorcedFemales 24.9% Never married26.6% Now married3.5% Separated17.3% Widowed27.7% DivorcedWomen who did not give birth in the past 12 months Now married:
9.4% (6)Unmarried:
90.6% (54)
Marital status - Other race population 15 years and over
Males 32.0% Never married56.2% Now married0.5% Separated2.5% Widowed8.9% DivorcedFemales 33.9% Never married58.0% Now married3.8% Separated2.2% Widowed2.2% DivorcedWomen who gave birth in the past 12 months Now married:
81.7% (358)Unmarried:
18.3% (80)
Women who did not give birth in the past 12 months Now married:
61.5% (2,421)Unmarried:
38.5% (1,515)
Marital status - Two or more races population 15 years and over
Males 46.4% Never married42.7% Now married1.0% Separated0.7% Widowed9.1% DivorcedFemales 48.6% Never married38.8% Now married2.8% Separated1.2% Widowed8.5% DivorcedWomen who gave birth in the past 12 months Now married:
72.2% (1,054)Unmarried:
27.8% (405)
Women who did not give birth in the past 12 months Now married:
36.1% (7,556)Unmarried:
63.9% (13,394)
Marital status - White alone, not Hispanic / Latino population 15 years and over
Males 39.1% Never married48.0% Now married0.7% Separated1.7% Widowed10.6% DivorcedFemales 34.7% Never married44.7% Now married0.5% Separated6.5% Widowed13.6% DivorcedWomen who gave birth in the past 12 months Now married:
81.8% (4,729)Unmarried:
18.2% (1,051)
Women who did not give birth in the past 12 months Now married:
39.4% (39,313)Unmarried:
60.6% (60,539)
Marital status - Hispanic or Latino population 15 years and over
Males 40.6% Never married48.9% Now married1.3% Separated1.3% Widowed8.0% DivorcedFemales 42.4% Never married46.8% Now married3.5% Separated1.8% Widowed5.5% DivorcedWomen who gave birth in the past 12 months Now married:
74.9% (1,450)Unmarried:
25.1% (485)
Women who did not give birth in the past 12 months Now married:
43.7% (7,738)Unmarried:
56.3% (9,971)
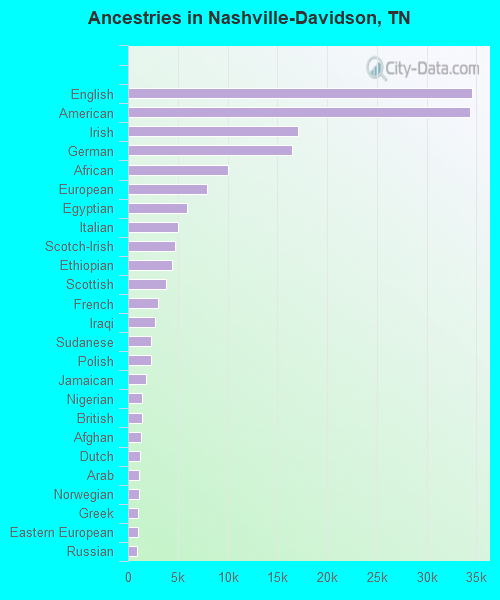
Ancestries in Nashville-Davidson
34,548 8.9% English34,390 8.9% American17,130 4.4% Irish16,489 4.3% German10,083 2.6% African7,967 2.1% European5,889 1.5% Egyptian5,072 1.3% Italian4,759 1.2% Scotch-Irish4,409 1.1% Ethiopian3,778 1.0% Scottish3,009 0.8% French2,721 0.7% Iraqi2,319 0.6% Sudanese2,308 0.6% Polish1,837 0.5% Jamaican1,427 0.4% Nigerian1,418 0.4% British1,324 0.3% Afghan1,242 0.3% Dutch1,097 0.3% Arab1,080 0.3% Norwegian1,050 0.3% Greek1,036 0.3% Eastern European935 0.2% Russian800 0.2% Haitian789 0.2% Scandinavian747 0.2% Swedish715 0.2% French Canadian698 0.2% Somali604 0.2% Welsh509 0.1% Iranian493 0.1% Kenyan436 0.1% Palestinian400 0.1% Canadian396 0.1% Albanian355 0.09% Portuguese350 0.09% Danish349 0.09% Swiss337 0.09% Yugoslavian311 0.08% Ghanaian309 0.08% Turkish299 0.08% Ukrainian276 0.07% British West Indian268 0.07% Armenian263 0.07% Northern European257 0.07% Moroccan253 0.07% Czech235 0.06% Guyanese229 0.06% Syrian228 0.06% Trinidadian and Tobagonian225 0.06% Croatian222 0.06% Romanian219 0.06% Lithuanian201 0.05% West Indian196 0.05% Austrian192 0.05% Lebanese191 0.05% Australian165 0.04% Hungarian158 0.04% Senegalese157 0.04% Brazilian152 0.04% Ugandan140 0.04% Belizean122 0.03% Liberian119 0.03% Slovak111 0.03% Serbian95 0.02% Finnish94 0.02% Bulgarian87 0.02% South African82 0.02% Slovene75 0.02% U.S. Virgin Islander71 0.02% Belgian63 0.02% Israeli57 0.01% Cajun51 0.01% Czechoslovakian45 0.01% Jordanian41 0.01% Zimbabwean32 0.01% Latvian31 0.01% New Zealander31 0.01% Bahamian21 0.01% German Russian20 0.01% Slavic
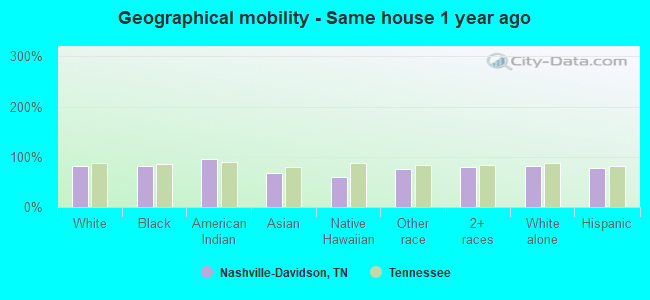
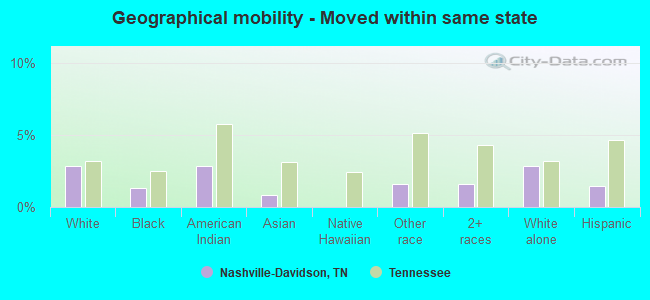
Geographical mobility in Nashville-Davidson Same house 1 year ago 308,583 81.5% White (Caucasian)139,541 81.1% Black or African American995 95.6% American Indian / Alaska Native17,038 68.7% Asian227 59.6% Native Hawaiian / Pacific Islander15,652 76.0% Other race60,746 79.6% Two or more races303,988 81.8% White alone, not Hispanic / Latino56,685 77.2% Hispanic or LatinoMoved within same county 33,625 8.9% White / Caucasian21,938 12.8% Black or African American43 4.1% American Indian / Alaska Native2,135 8.6% Asian47 12.4% Native Hawaiian / Pacific Islander3,186 15.5% Other race10,496 13.8% Two or more races32,424 8.7% White alone, not Hispanic / Latino12,156 16.6% Hispanic or LatinoMoved within same state 10,902 2.9% White / Caucasian2,298 1.3% Black or African American29 2.8% American Indian / Alaska Native202 0.8% Asian336 1.6% Other race1,231 1.6% Two or more races10,524 2.8% White alone, not Hispanic / Latino1,076 1.5% Hispanic or LatinoMoved from different state 24,649 6.5% White / Caucasian7,725 4.5% Black or African American58 5.6% American Indian / Alaska Native1,921 7.7% Asian71 18.6% Native Hawaiian / Pacific Islander1,125 5.5% Other race3,739 4.9% Two or more races23,948 6.4% White alone, not Hispanic / Latino3,139 4.3% Hispanic or LatinoMoved from abroad 800 0.2% White468 0.3% Black or African American3,507 14.1% Asian25 6.5% Native Hawaiian / Pacific Islander308 1.5% Other race69 0.1% Two or more races800 0.2% White alone, not Hispanic / Latino377 0.5% Hispanic or Latino
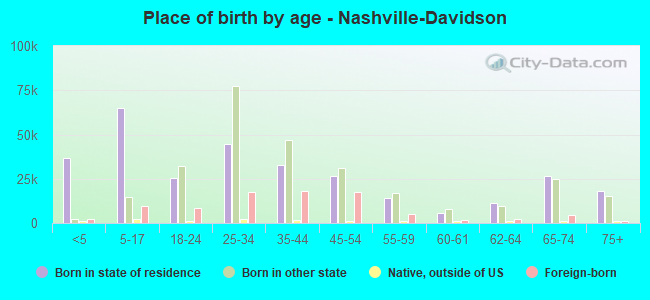
Children Nativity (place of birth) in Nashville-Davidson
Children under 6 years - Living with two parents Both parents native 22,144 100.0% NativeBoth parents foreign-born 5,766 81.0% Native1,356 19.0% Foreign-bornOne native, one foreign-born parent 3,169 100.0% NativeChildren under 6 years - Living with one parent Native parent 11,949 98.9% Native129 1.1% Foreign-bornForeign-born parent 1,736 59.7% Native1,174 40.3% Foreign-bornChildren 6 to 17 years - Living with two parents Both parents native 26,072 99.6% Native112 0.4% Foreign-bornBoth parents foreign-born 9,365 62.0% Native5,731 38.0% Foreign-bornOne native, one foreign-born parent 2,526 96.6% Native88 3.4% Foreign-bornChildren 6 to 17 years - Living with one parent Native parent 26,373 100.0% NativeForeign-born parent 5,675 64.8% Native3,084 35.2% Foreign-born
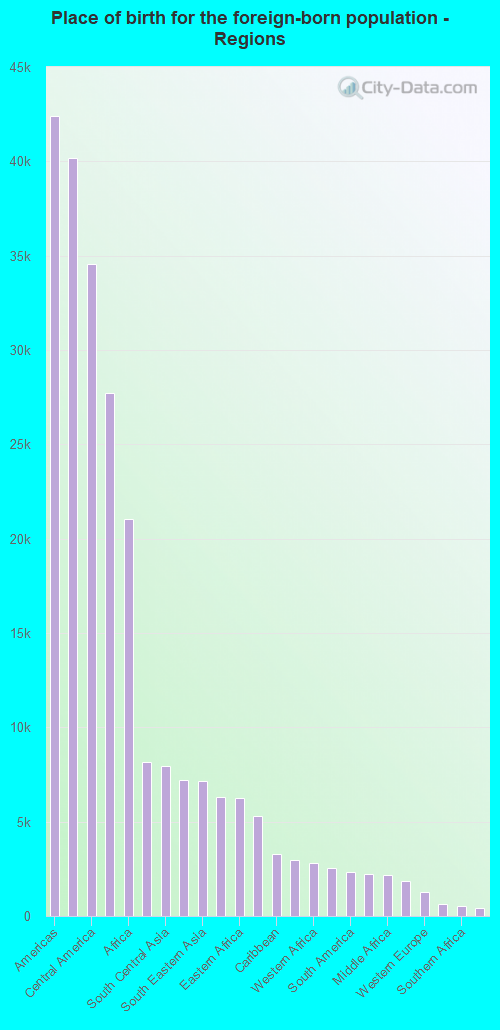
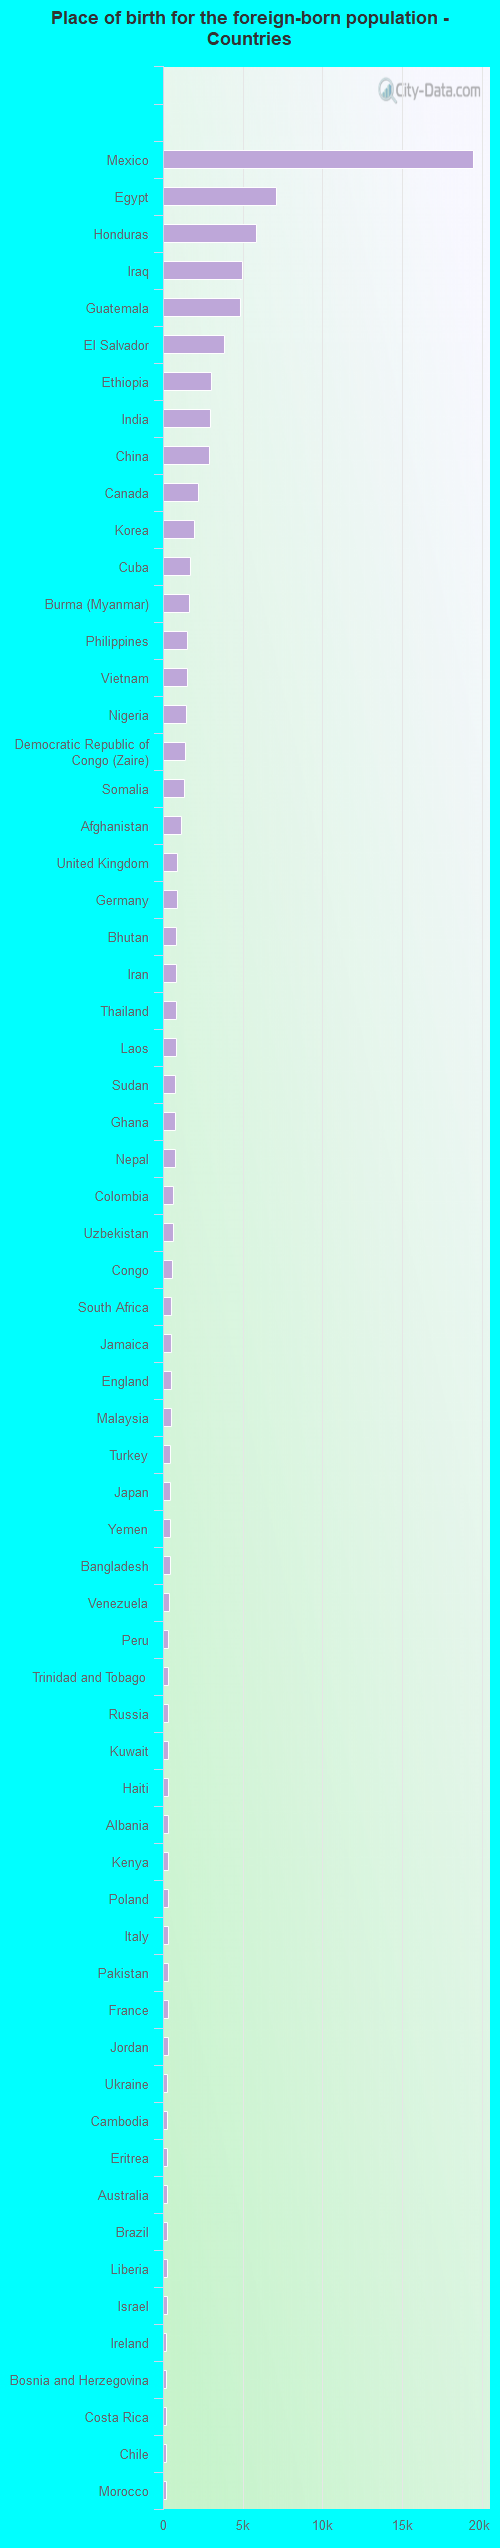
Place of birth for residents in Nashville-Davidson 42,392 Americas40,163 Latin America34,579 Central America27,703 Asia21,027 Africa8,177 Northern Africa7,954 South Central Asia7,195 Western Asia7,152 South Eastern Asia6,312 Europe6,266 Eastern Africa5,311 Eastern Asia3,264 Caribbean2,947 China2,824 Western Africa2,546 Eastern Europe2,318 South America2,229 Northern America2,154 Middle Africa1,869 Northern Europe1,277 Western Europe610 Southern Europe522 Southern Africa427 Oceania370 Australia and New Zealand Subregion19,484 Mexico7,116 Egypt5,821 Honduras4,981 Iraq4,851 Guatemala3,859 El Salvador3,010 Ethiopia2,925 India2,876 China2,192 Canada1,928 Korea1,687 Cuba1,618 Burma (Myanmar)1,511 Philippines1,492 Vietnam1,462 Nigeria1,373 Democratic Republic of Congo (Zaire)1,333 Somalia1,139 Afghanistan862 United Kingdom854 Germany844 Bhutan828 Iran827 Thailand795 Laos778 Sudan759 Ghana754 Nepal633 Colombia626 Uzbekistan552 Congo516 South Africa496 Jamaica490 England487 Malaysia434 Turkey424 Japan418 Yemen410 Bangladesh378 Venezuela344 Peru337 Trinidad and Tobago333 Russia331 Kuwait331 Haiti321 Albania315 Kenya313 Poland306 Italy291 Pakistan285 France283 Jordan282 Ukraine275 Cambodia266 Eritrea264 Australia252 Brazil242 Liberia236 Israel209 Ireland200 Bosnia and Herzegovina200 Costa Rica189 Chile178 Morocco175 Guyana162 Cameroon162 Syria160 Spain159 Dominican Republic156 Nicaragua155 Togo152 Romania151 Scotland150 Belize143 Greece137 Ecuador119 Bulgaria115 Senegal106 New Zealand104 Indonesia100 Croatia100 Uganda92 Lebanon83 Sweden82 United Arab Emirates77 Tanzania74 Bolivia68 Uruguay65 Belarus65 Kazakhstan58 Grenada57 Argentina55 Taiwan55 Panama52 Saudi Arabia50 Sri Lanka47 Sierra Leone45 Algeria45 Bahamas44 Serbia43 Azerbaijan38 Netherlands38 Singapore38 Czechoslovakia36 Zimbabwe36 Switzerland34 Austria31 Denmark30 Dominica28 Belgium27 Moldova15 Hong Kong15 Fiji14 Hungary14 Georgia11 West Indies8 North Macedonia (Macedonia)6 Marshall Islands1 Armenia
Grandparents responsible for own grandchildren in Nashville-Davidson
Grandparents (30 to 59 years) White / Caucasian 1,356 69.9% Responsible for grandchildren583 30.1% Not responsible for grandchildrenBlack or African American 1,016 49.3% Responsible for grandchildren1,044 50.7% Not responsible for grandchildrenAsian 59 40.2% Responsible for grandchildren87 59.8% Not responsible for grandchildrenOther race 209 42.7% Responsible for grandchildren281 57.3% Not responsible for grandchildrenTwo or more races 263 100.0% Not responsible for grandchildrenWhite alone, not Hispanic / Latino 1,356 69.9% Responsible for grandchildren583 30.1% Not responsible for grandchildrenHispanic or Latino 328 32.7% Responsible for grandchildren675 67.3% Not responsible for grandchildrenGrandparents (60 years and over) White / Caucasian 749 27.6% Responsible for grandchildren1,963 72.4% Not responsible for grandchildrenBlack or African American 336 13.2% Responsible for grandchildren2,201 86.8% Not responsible for grandchildrenAsian 218 39.4% Responsible for grandchildren336 60.6% Not responsible for grandchildrenOther race 128 78.6% Responsible for grandchildren35 21.4% Not responsible for grandchildrenTwo or more races 142 23.7% Responsible for grandchildren458 76.3% Not responsible for grandchildrenWhite alone, not Hispanic / Latino 749 27.6% Responsible for grandchildren1,963 72.4% Not responsible for grandchildrenHispanic or Latino 190 28.1% Responsible for grandchildren485 71.9% Not responsible for grandchildren
Zip codes: 37013 , 37080 , 37143 , 37189 , 37201 , 37203 , 37206 , 37207 , 37208 , 37209 , 37210 , 37212 , 37213 , 37214 , 37216 , 37217 , 37218 , 37219 , 37220 , 37221 , 37228 , 37240 , 37243, 37246.