Races in Navarre, Florida (FL) Detailed Stats
Data:
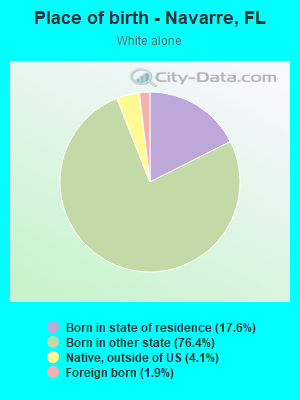
Races - White alone (%)
Races - White alone (% change since 2000)
Races - Black alone (%)
Races - Black alone (% change since 2000)
Races - American Indian alone (%)
Races - American Indian alone (% change since 2000)
Races - Asian alone (%)
Races - Asian alone (% change since 2000)
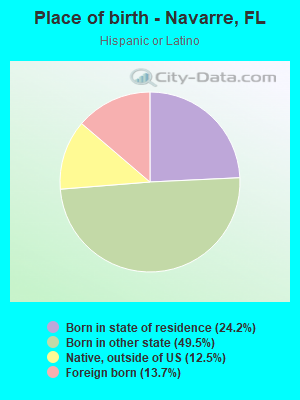
Races - Hispanic (%)
Races - Hispanic (% change since 2000)
Races - Native Hawaiian and Other Pacific Islander alone (%)
Races - Native Hawaiian and Other Pacific Islander alone (% change since 2000)
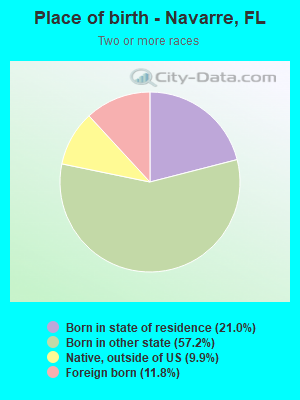
Races - Two or more races(%)
Races - Two or more races(% change since 2000)
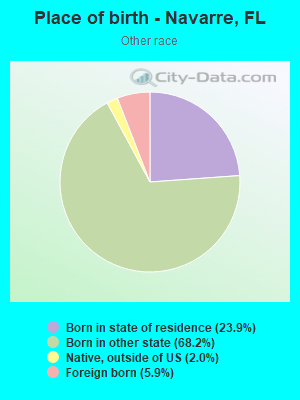
Races - Other race alone (%)
Races - Other race alone (% change since 2000)
Racial diversity
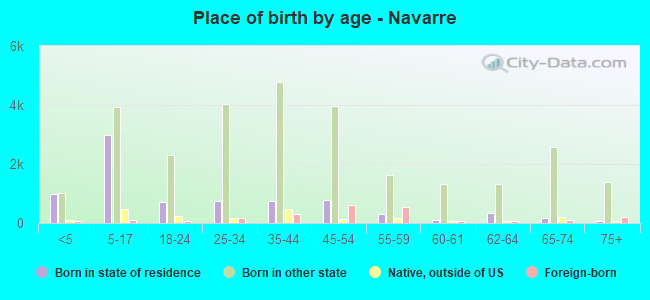
Place of birth - Born in state of residence (%)
Place of birth - Born in state of residence (%) - White
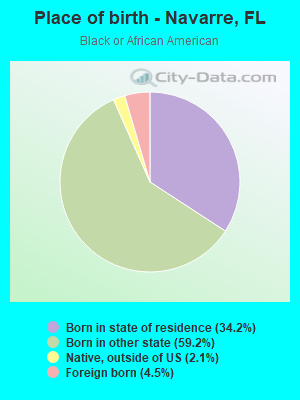
Place of birth - Born in state of residence (%) - Black or African American
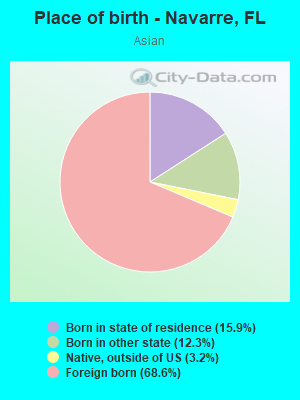
Place of birth - Born in state of residence (%) - Asian
Place of birth - Born in state of residence (%) - Hispanic or Latino
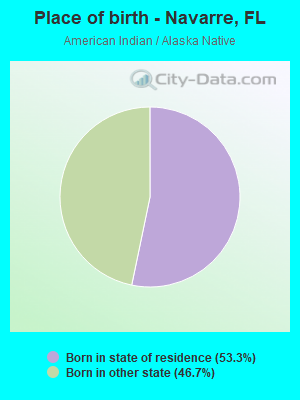
Place of birth - Born in state of residence (%) - American Indian and Alaska Native
Place of birth - Born in state of residence (%) - Multirace
Place of birth - Born in state of residence (%) - Other Race
Place of birth - Born in other state (%)
Place of birth - Born in other state (%) - White
Place of birth - Born in other state (%) - Black or African American
Place of birth - Born in other state (%) - Asian
Place of birth - Born in other state (%) - Hispanic or Latino
Place of birth - Born in other state (%) - American Indian and Alaska Native
Place of birth - Born in other state (%) - Multirace
Place of birth - Born in other state (%) - Other Race
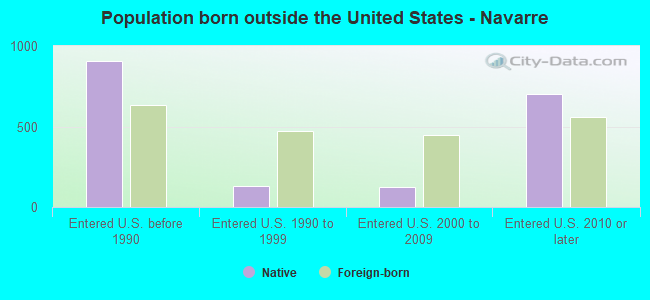
Place of birth - Native, outside of US (%)
Place of birth - Native, outside of US (%) - White
Place of birth - Native, outside of US (%) - Black or African American
Place of birth - Native, outside of US (%) - Asian
Place of birth - Native, outside of US (%) - Hispanic or Latino
Place of birth - Native, outside of US (%) - American Indian and Alaska Native
Place of birth - Native, outside of US (%) - Multirace
Place of birth - Native, outside of US (%) - Other Race
Place of birth - Foreign born (%)
Place of birth - Foreign born (%) - White
Place of birth - Foreign born (%) - Black or African American
Place of birth - Foreign born (%) - Asian
Place of birth - Foreign born (%) - Hispanic or Latino
Place of birth - Foreign born (%) - American Indian and Alaska Native
Place of birth - Foreign born (%) - Multirace
Place of birth - Foreign born (%) - Other Race
Residents speaking English at home (%)
Residents speaking English at home - Born in the United States (%)
Residents speaking English at home - Native, born elsewhere (%)
Residents speaking English at home - Foreign born (%)
Residents speaking Spanish at home (%)
Residents speaking Spanish at home - Born in the United States (%)
Residents speaking Spanish at home - Native, born elsewhere (%)
Residents speaking Spanish at home - Foreign born (%)
Residents speaking other language at home (%)
Residents speaking other language at home - Born in the United States (%)
Residents speaking other language at home - Native, born elsewhere (%)
Residents speaking other language at home - Foreign born (%)
Marital status - Never married (%)
Marital status - Now married (%)
Marital status - Separated (%)
Marital status - Widowed (%)
Marital status - Divorced (%)
Ancestries Reported - Arab (%)
Ancestries Reported - Czech (%)
Ancestries Reported - Danish (%)
Ancestries Reported - Dutch (%)
Ancestries Reported - English (%)
Ancestries Reported - French (%)
Ancestries Reported - French Canadian (%)
Ancestries Reported - German (%)
Ancestries Reported - Greek (%)
Ancestries Reported - Hungarian (%)
Ancestries Reported - Irish (%)
Ancestries Reported - Italian (%)
Ancestries Reported - Lithuanian (%)
Ancestries Reported - Norwegian (%)
Ancestries Reported - Polish (%)
Ancestries Reported - Portuguese (%)
Ancestries Reported - Russian (%)
Ancestries Reported - Scotch-Irish (%)
Ancestries Reported - Scottish (%)
Ancestries Reported - Slovak (%)
Ancestries Reported - Subsaharan African (%)
Ancestries Reported - Swedish (%)
Ancestries Reported - Swiss (%)
Ancestries Reported - Ukrainian (%)
Ancestries Reported - United States (%)
Ancestries Reported - Welsh (%)
Ancestries Reported - West Indian (%)
Ancestries Reported - Other (%)
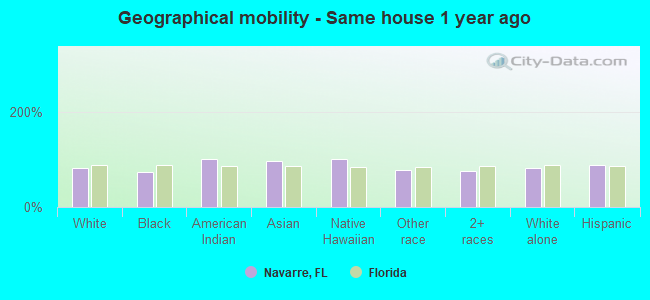
Geographical mobility - Same house 1 year ago (%)
Geographical mobility - Same house 1 year ago (%) - White
Geographical mobility - Same house 1 year ago (%) - Black or African American
Geographical mobility - Same house 1 year ago (%) - Asian
Geographical mobility - Same house 1 year ago (%) - Hispanic or Latino
Geographical mobility - Same house 1 year ago (%) - American Indian and Alaska Native
Geographical mobility - Same house 1 year ago (%) - Multirace
Geographical mobility - Same house 1 year ago (%) - Other Race
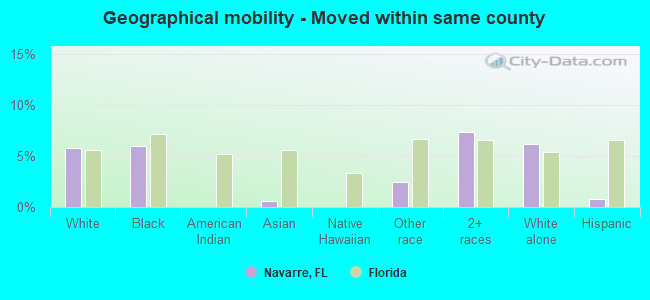
Geographical mobility - Moved within same county (%)
Geographical mobility - Moved within same county (%) - White
Geographical mobility - Moved within same county (%) - Black or African American
Geographical mobility - Moved within same county (%) - Asian
Geographical mobility - Moved within same county (%) - Hispanic or Latino
Geographical mobility - Moved within same county (%) - American Indian and Alaska Native
Geographical mobility - Moved within same county (%) - Multirace
Geographical mobility - Moved within same county (%) - Other Race
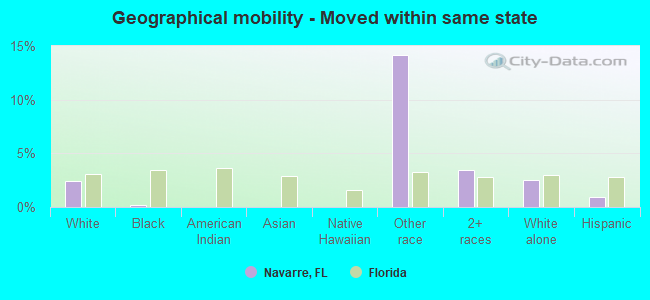
Geographical mobility - Moved from different county within same state (%)
Geographical mobility - Moved from different county within same state (%) - White
Geographical mobility - Moved from different county within same state (%) - Black or African American
Geographical mobility - Moved from different county within same state (%) - Asian
Geographical mobility - Moved from different county within same state (%) - Hispanic or Latino
Geographical mobility - Moved from different county within same state (%) - American Indian and Alaska Native
Geographical mobility - Moved from different county within same state (%) - Multirace
Geographical mobility - Moved from different county within same state (%) - Other Race
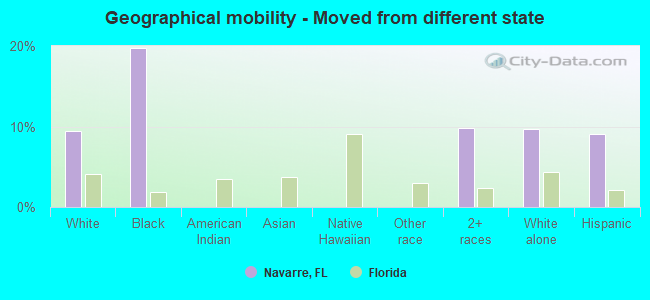
Geographical mobility - Moved from different state (%)
Geographical mobility - Moved from different state (%) - White
Geographical mobility - Moved from different state (%) - Black or African American
Geographical mobility - Moved from different state (%) - Asian
Geographical mobility - Moved from different state (%) - Hispanic or Latino
Geographical mobility - Moved from different state (%) - American Indian and Alaska Native
Geographical mobility - Moved from different state (%) - Multirace
Geographical mobility - Moved from different state (%) - Other Race
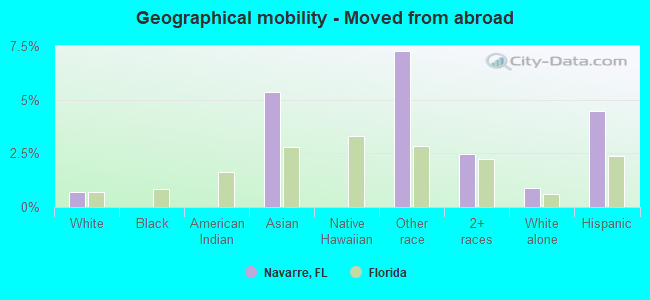
Geographical mobility - Moved from abroad (%)
Geographical mobility - Moved from abroad (%) - White
Geographical mobility - Moved from abroad (%) - Black or African American
Geographical mobility - Moved from abroad (%) - Asian
Geographical mobility - Moved from abroad (%) - Hispanic or Latino
Geographical mobility - Moved from abroad (%) - American Indian and Alaska Native
Geographical mobility - Moved from abroad (%) - Multirace
Geographical mobility - Moved from abroad (%) - Other Race
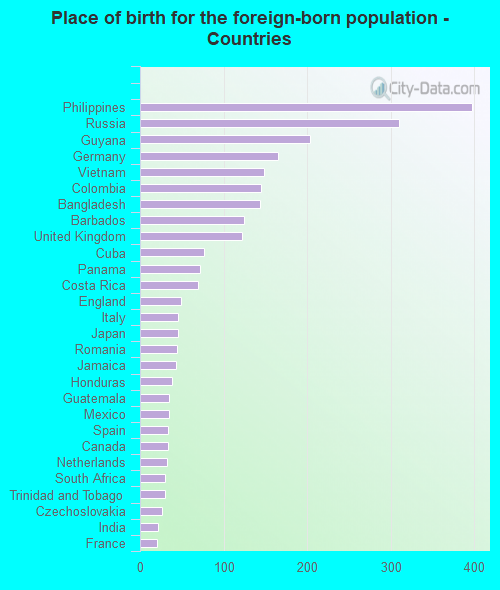
Place of birth for the foreign-born population - Ireland (%)
Place of birth for the foreign-born population - Denmark (%)
Place of birth for the foreign-born population - Norway (%)
Place of birth for the foreign-born population - Sweden (%)
Place of birth for the foreign-born population - United Kingdom (%)
Place of birth for the foreign-born population - England (%)
Place of birth for the foreign-born population - Scotland (%)
Place of birth for the foreign-born population - Other Northern Europe (%)
Place of birth for the foreign-born population - Austria (%)
Place of birth for the foreign-born population - Belgium (%)
Place of birth for the foreign-born population - France (%)
Place of birth for the foreign-born population - Germany (%)
Place of birth for the foreign-born population - Netherlands (%)
Place of birth for the foreign-born population - Switzerland (%)
Place of birth for the foreign-born population - Other Western Europe (%)
Place of birth for the foreign-born population - Greece (%)
Place of birth for the foreign-born population - Italy (%)
Place of birth for the foreign-born population - Portugal (%)
Place of birth for the foreign-born population - Spain (%)
Place of birth for the foreign-born population - Other Southern Europe (%)
Place of birth for the foreign-born population - Albania (%)
Place of birth for the foreign-born population - Belarus (%)
Place of birth for the foreign-born population - Bosnia and Herzegovina (%)
Place of birth for the foreign-born population - Bulgaria (%)
Place of birth for the foreign-born population - Croatia (%)
Place of birth for the foreign-born population - Czechoslovakia (%)
Place of birth for the foreign-born population - Hungary (%)
Place of birth for the foreign-born population - Latvia (%)
Place of birth for the foreign-born population - Lithuania (%)
Place of birth for the foreign-born population - North Macedonia (Macedonia) (%)
Place of birth for the foreign-born population - Moldova (%)
Place of birth for the foreign-born population - Poland (%)
Place of birth for the foreign-born population - Romania (%)
Place of birth for the foreign-born population - Russia (%)
Place of birth for the foreign-born population - Serbia (%)
Place of birth for the foreign-born population - Ukraine (%)
Place of birth for the foreign-born population - Other Eastern Europe (%)
Place of birth for the foreign-born population - China (%)
Place of birth for the foreign-born population - Hong Kong (%)
Place of birth for the foreign-born population - Taiwan (%)
Place of birth for the foreign-born population - Japan (%)
Place of birth for the foreign-born population - Korea (%)
Place of birth for the foreign-born population - Other Eastern Asia (%)
Place of birth for the foreign-born population - Afghanistan (%)
Place of birth for the foreign-born population - Bangladesh (%)
Place of birth for the foreign-born population - India (%)
Place of birth for the foreign-born population - Iran (%)
Place of birth for the foreign-born population - Kazakhstan (%)
Place of birth for the foreign-born population - Nepal (%)
Place of birth for the foreign-born population - Pakistan (%)
Place of birth for the foreign-born population - Sri Lanka (%)
Place of birth for the foreign-born population - Uzbekistan (%)
Place of birth for the foreign-born population - Other South Central Asia (%)
Place of birth for the foreign-born population - Burma (%)
Place of birth for the foreign-born population - Cambodia (%)
Place of birth for the foreign-born population - Indonesia (%)
Place of birth for the foreign-born population - Laos (%)
Place of birth for the foreign-born population - Malaysia (%)
Place of birth for the foreign-born population - Philippines (%)
Place of birth for the foreign-born population - Singapore (%)
Place of birth for the foreign-born population - Thailand (%)
Place of birth for the foreign-born population - Vietnam (%)
Place of birth for the foreign-born population - Other South Eastern Asia (%)
Place of birth for the foreign-born population - Armenia (%)
Place of birth for the foreign-born population - Iraq (%)
Place of birth for the foreign-born population - Israel (%)
Place of birth for the foreign-born population - Jordan (%)
Place of birth for the foreign-born population - Kuwait (%)
Place of birth for the foreign-born population - Lebanon (%)
Place of birth for the foreign-born population - Saudi Arabia (%)
Place of birth for the foreign-born population - Syria (%)
Place of birth for the foreign-born population - Turkey (%)
Place of birth for the foreign-born population - Yemen (%)
Place of birth for the foreign-born population - Other Western Asia (%)
Place of birth for the foreign-born population - Eritrea (%)
Place of birth for the foreign-born population - Ethiopia (%)
Place of birth for the foreign-born population - Kenya (%)
Place of birth for the foreign-born population - Somalia (%)
Place of birth for the foreign-born population - Uganda (%)
Place of birth for the foreign-born population - Zimbabwe (%)
Place of birth for the foreign-born population - Other Eastern Africa (%)
Place of birth for the foreign-born population - Cameroon (%)
Place of birth for the foreign-born population - Congo (%)
Place of birth for the foreign-born population - Democratic Republic of Congo (Zaire) (%)
Place of birth for the foreign-born population - Other Middle Africa (%)
Place of birth for the foreign-born population - Egypt (%)
Place of birth for the foreign-born population - Morocco (%)
Place of birth for the foreign-born population - Sudan (%)
Place of birth for the foreign-born population - Other Northern Africa (%)
Place of birth for the foreign-born population - South Africa (%)
Place of birth for the foreign-born population - Other Southern Africa (%)
Place of birth for the foreign-born population - Cabo Verde (%)
Place of birth for the foreign-born population - Ghana (%)
Place of birth for the foreign-born population - Liberia (%)
Place of birth for the foreign-born population - Nigeria (%)
Place of birth for the foreign-born population - Senegal (%)
Place of birth for the foreign-born population - Sierra Leone (%)
Place of birth for the foreign-born population - Other Western Africa (%)
Place of birth for the foreign-born population - Australia (%)
Place of birth for the foreign-born population - New Zealand (%)
Place of birth for the foreign-born population - Fiji (%)
Place of birth for the foreign-born population - Micronesia (%)
Place of birth for the foreign-born population - Bahamas (%)
Place of birth for the foreign-born population - Barbados (%)
Place of birth for the foreign-born population - Cuba (%)
Place of birth for the foreign-born population - Dominica (%)
Place of birth for the foreign-born population - Dominican Republic (%)
Place of birth for the foreign-born population - Grenada (%)
Place of birth for the foreign-born population - Haiti (%)
Place of birth for the foreign-born population - Jamaica (%)
Place of birth for the foreign-born population - St. Vincent and the Grenadines (%)
Place of birth for the foreign-born population - Trinidad and Tobago (%)
Place of birth for the foreign-born population - West Indies (%)
Place of birth for the foreign-born population - Other Caribbean (%)
Place of birth for the foreign-born population - Belize (%)
Place of birth for the foreign-born population - Costa Rica (%)
Place of birth for the foreign-born population - El Salvador (%)
Place of birth for the foreign-born population - Guatemala (%)
Place of birth for the foreign-born population - Honduras (%)
Place of birth for the foreign-born population - Mexico (%)
Place of birth for the foreign-born population - Nicaragua (%)
Place of birth for the foreign-born population - Panama (%)
Place of birth for the foreign-born population - Other Central America (%)
Place of birth for the foreign-born population - Argentina (%)
Place of birth for the foreign-born population - Bolivia (%)
Place of birth for the foreign-born population - Brazil (%)
Place of birth for the foreign-born population - Chile (%)
Place of birth for the foreign-born population - Colombia (%)
Place of birth for the foreign-born population - Ecuador (%)
Place of birth for the foreign-born population - Guyana (%)
Place of birth for the foreign-born population - Peru (%)
Place of birth for the foreign-born population - Uruguay (%)
Place of birth for the foreign-born population - Venezuela (%)
Place of birth for the foreign-born population - Other South America (%)
Place of birth for the foreign-born population - Canada (%)
Place of birth for the foreign-born population - Other Northern America (%)
Place of birth for the foreign-born population - Other (%)
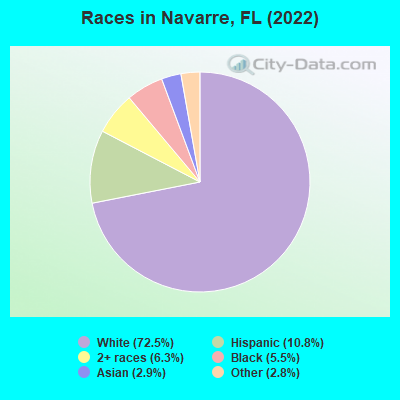
According to 2022 data, the most numerous races in Navarre, FL are White alone (29,541 residents), Hispanic (4,396 residents), and Black alone (2,255 residents). 92.2% of Navarre residents speak English at home.
Race distribution in Navarre 29,541 72.5% White alone 4,396 10.8% Hispanic 2,553 6.3% Two or more races 2,255 5.5% Black alone 1,182 2.9% Asian alone 1,144 2.8% Other race alone 26 0.06% American Indian alone 24 0.06% Native Hawaiian and Other
2000 2022
10,458,509 65.4% White alone 2,682,715 16.8% Hispanic 2,264,268 14.2% Black alone 261,693 1.6% Asian alone 236,954 1.5% Two or more races 42,358 0.3% American Indian alone 28,994 0.2% Other race alone 6,887 0.04% Native Hawaiian and Other
11,309,403 50.8% White alone 6,025,039 27.1% Hispanic 3,241,015 14.6% Black alone 861,630 3.9% Two or more races 623,692 2.8% Asian alone 152,054 0.7% Other race alone 22,504 0.1% American Indian alone 9,486 0.04% Native Hawaiian and Other
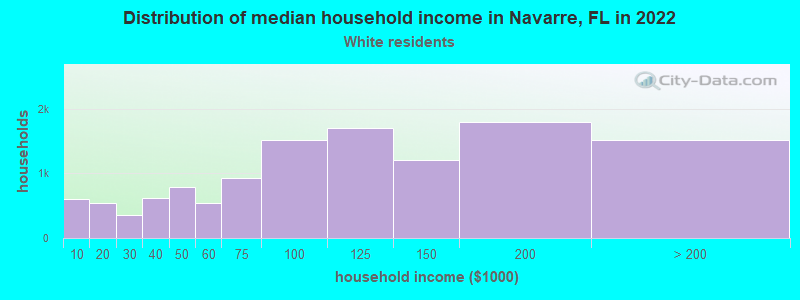
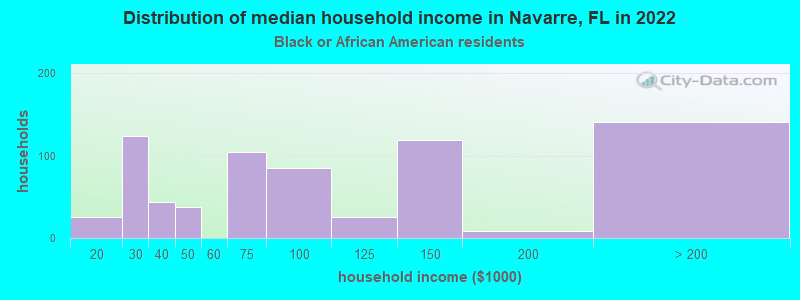
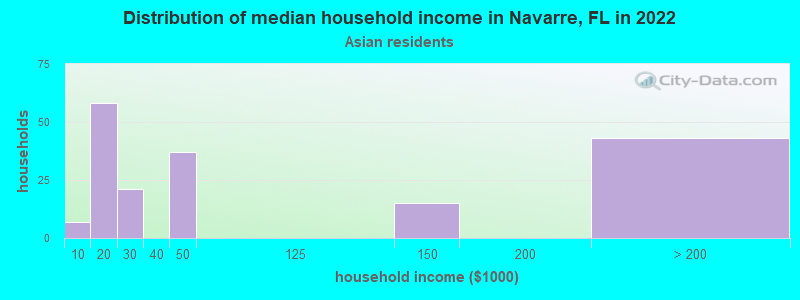
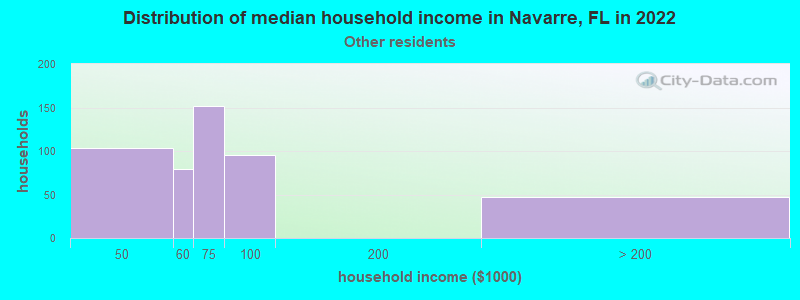
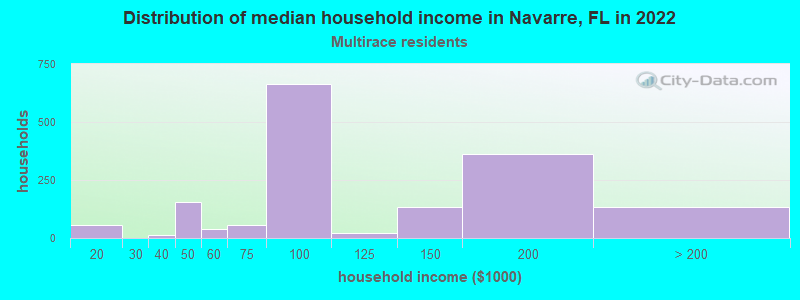
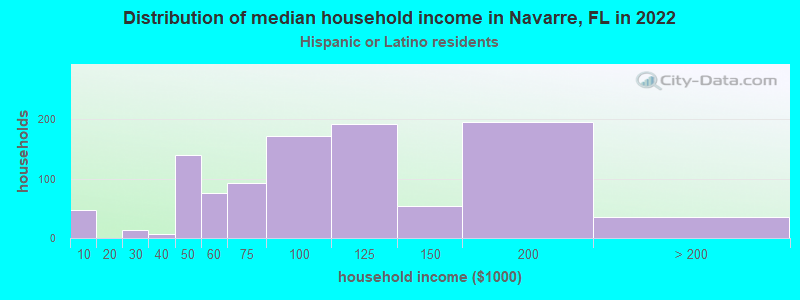
Income and house value in Navarre Median household income in 2022 $99,298 White non-Hispanic householders$77,647 Black householders$63,149 Some other race householders$67,622 Two or more races householders$78,069 Hispanic or Latino race householders
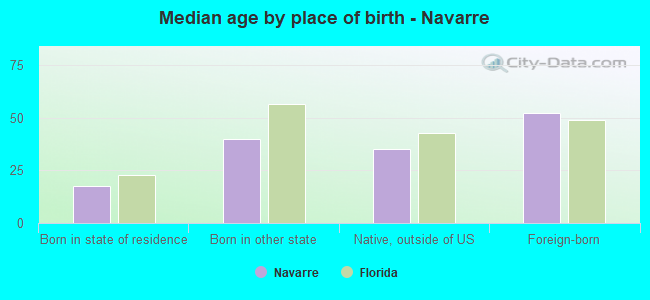
Median age by race in Navarre
39.0 Median age for White residents36.7 40.8 23.2 Median age for Black or African American residents23.5 26.4 89.4 Median age for American Indian / Alaska Native residents-1,057,851,238.6 -859,386,151.9 38.1 Median age for Asian residents37.3 45.0 9.7 Median age for Native Hawaiian / Pacific Islander residents12.0 7.6 28.5 Median age for Other race residents31.9 26.5 40.3 Median age for Two or more races residents33.0 48.7 40.5 Median age for White alone residents37.6 41.8 33.1 Median age for Hispanic or Latino residents26.7 36.1
Owner/renter occupied households by race in Navarre
House owners and renters - White residents 9,747 80.5% Owner occupied2,363 19.5% Renter occupiedHouse owners and renters - Black or African American residents 575 92.2% Owner occupied48 7.8% Renter occupiedHouse owners and renters - American Indian / Alaska Native residents 13 100.0% Owner occupiedHouse owners and renters - Asian residents 174 96.0% Owner occupied7 4.0% Renter occupiedHouse owners and renters - Native Hawaiian / Pacific Islander residents 1 100.0% Renter occupiedHouse owners and renters - Other race residents 488 73.1% Owner occupied179 26.9% Renter occupiedHouse owners and renters - Two or more races residents 911 67.8% Owner occupied433 32.2% Renter occupiedHouse owners and renters - White alone residents 9,304 80.6% Owner occupied2,247 19.4% Renter occupiedHouse owners and renters - Hispanic or Latino residents 827 81.8% Owner occupied184 18.2% Renter occupied
Language usage in Navarre
English speakers - Total 92.2% of residents of Navarre speak English at home.
2.6% of residents speak Spanish at home 878 86.4% Speak English very well138 13.6% Speak English less than very well5.0% of residents speak other language at home 1,202 61.5% Speak English very well752 38.5% Speak English less than very well
English speakers - Born in the United States 97.7% of residents of Navarre speak English at home.
1.3% of residents speak Spanish at home 351 98.6% Speak English very well5 1.4% Speak English less than very well1.4% of residents speak other language at home 299 75.9% Speak English very well95 24.1% Speak English less than very well
English speakers - Native, born elsewhere 82.5% of residents of Navarre speak English at home.
12.1% of residents speak Spanish at home 46 20.2% Speak English very well182 79.8% Speak English less than very well5.8% of residents speak other language at home 109 100.0% Speak English very well
English speakers - Foreign-born 42.2% of residents of Navarre speak English at home.
10.5% of residents speak Spanish at home 155 66.8% Speak English very well77 33.2% Speak English less than very well44.8% of residents speak other language at home 450 45.3% Speak English very well544 54.7% Speak English less than very well
White (Caucasian) - Speak only English Native:
95.7% (28,029)Foreign-born:
67.4% (389)
White (Caucasian) - Speak another language Native:
4.0% (1,170)Foreign-born:
35.0% (202)
Black or African American - Speak only English Native:
95.5% (1,753)Foreign-born:
86.7% (169)
Black or African American - Speak another language Native:
4.4% (80)Foreign-born:
10.8% (21)
Asian - Speak only English Native:
57.4% (171)Foreign-born:
16.8% (124)
Asian - Speak another language Native:
42.4% (126)Foreign-born:
83.3% (615)
Native Hawaiian / Pacific Islander - Speak only English Native:
87.6% (21)Foreign-born:
100.0% (1)
Other race - Speak another language Native:
15.6% (253)Foreign-born:
100.0% (219)
Two or more races - Speak only English Native:
96.8% (3,518)Foreign-born:
71.1% (353)
Two or more races - Speak another language Native:
2.6% (93)Foreign-born:
24.8% (123)
White alone - Speak only English Native:
97.3% (26,809)Foreign-born:
65.6% (363)
White alone - Speak another language Native:
2.9% (808)Foreign-born:
34.2% (189)
Hispanic or Latino - Speak only English Native:
90.3% (3,310)Foreign-born:
89.2% (551)
Hispanic or Latino - Speak another language Native:
11.3% (415)Foreign-born:
42.2% (260)
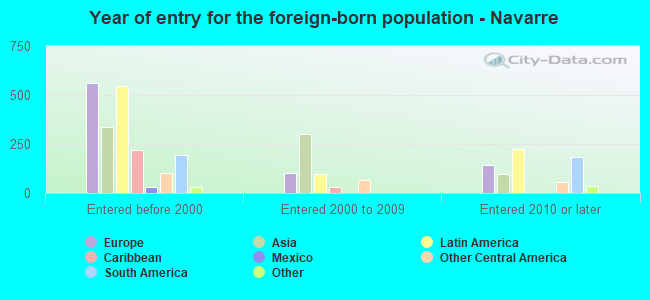
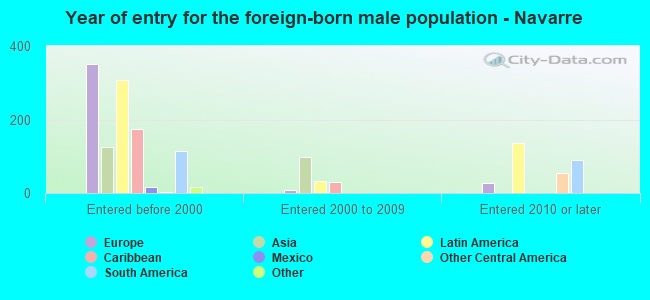
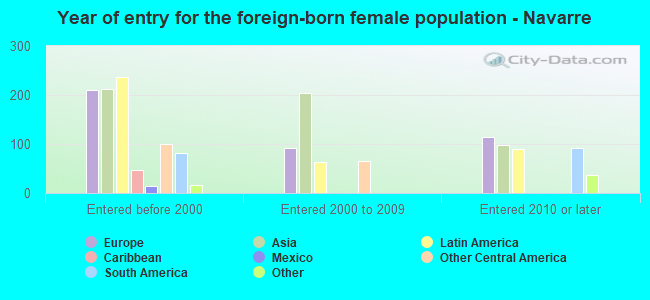
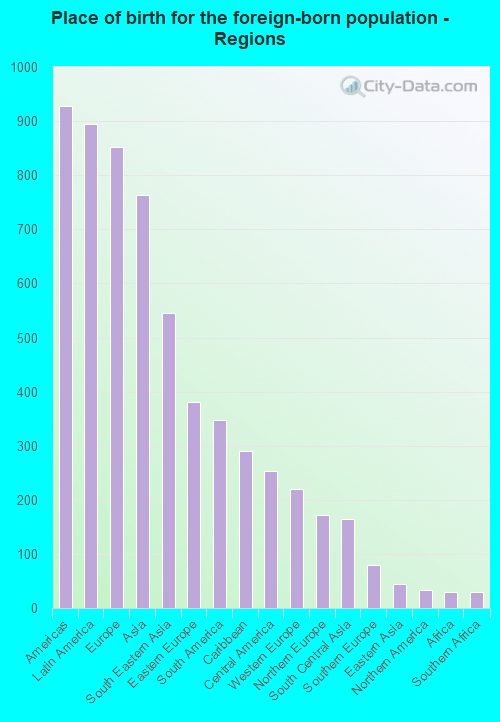
Foreign-born residents in Navarre
Marital status for residents in Navarre Marital status - White (Caucasian) population 15 years and over
Males 24.4% Never married64.6% Now married1.2% Separated2.6% Widowed7.2% DivorcedFemales 18.1% Never married60.3% Now married0.9% Separated8.3% Widowed12.4% DivorcedWomen who gave birth in the past 12 months Now married:
44.1% (74)Unmarried:
55.9% (93)
Women who did not give birth in the past 12 months Now married:
60.0% (4,549)Unmarried:
40.0% (3,036)
Marital status - Black or African American population 15 years and over
Males 17.6% Never married82.4% Now married0.0% Separated0.0% Widowed0.0% DivorcedFemales 47.4% Never married52.6% Now married0.0% Separated0.0% Widowed0.0% DivorcedWomen who gave birth in the past 12 months Now married:
0.0% (0)Unmarried:
100.0% (46)
Women who did not give birth in the past 12 months Now married:
29.2% (137)Unmarried:
70.8% (331)
Marital status - American Indian / Alaska Native population 15 years and over
Males 0.0% Never married100.0% Now married0.0% Separated0.0% Widowed0.0% DivorcedFemales 0.0% Never married100.0% Now married0.0% Separated0.0% Widowed0.0% DivorcedWomen who did not give birth in the past 12 months Now married:
100.0% (13)Unmarried:
0.0% (0)
Marital status - Asian population 15 years and over
Males 40.4% Never married57.3% Now married0.0% Separated0.0% Widowed2.3% DivorcedFemales 13.3% Never married78.9% Now married0.0% Separated7.8% Widowed0.0% DivorcedWomen who did not give birth in the past 12 months Now married:
78.5% (265)Unmarried:
21.5% (72)
Marital status - Native Hawaiian / Pacific Islander population 15 years and over
Males 100.0% Never married0.0% Now married0.0% Separated0.0% Widowed0.0% DivorcedFemales 0.0% Never married100.0% Now married0.0% Separated0.0% Widowed0.0% DivorcedWomen who did not give birth in the past 12 months Now married:
75.1% (1)Unmarried:
0.0% (0)
Marital status - Other race population 15 years and over
Males 37.4% Never married52.1% Now married0.0% Separated10.5% Widowed0.0% DivorcedFemales 25.2% Never married68.4% Now married0.0% Separated0.0% Widowed6.4% DivorcedWomen who did not give birth in the past 12 months Now married:
69.3% (347)Unmarried:
30.7% (153)
Marital status - Two or more races population 15 years and over
Males 48.6% Never married48.5% Now married0.0% Separated0.0% Widowed3.0% DivorcedFemales 39.7% Never married49.9% Now married0.2% Separated6.8% Widowed3.4% DivorcedWomen who gave birth in the past 12 months Now married:
100.0% (20)Unmarried:
0.0% (0)
Women who did not give birth in the past 12 months Now married:
31.0% (227)Unmarried:
69.0% (506)
Marital status - White alone, not Hispanic / Latino population 15 years and over
Males 23.0% Never married66.4% Now married1.3% Separated2.4% Widowed6.9% DivorcedFemales 17.2% Never married60.3% Now married1.0% Separated8.7% Widowed12.8% DivorcedWomen who gave birth in the past 12 months Now married:
37.5% (56)Unmarried:
62.5% (93)
Women who did not give birth in the past 12 months Now married:
60.6% (4,187)Unmarried:
39.4% (2,723)
Marital status - Hispanic or Latino population 15 years and over
Males 48.4% Never married43.8% Now married0.0% Separated2.6% Widowed5.2% DivorcedFemales 31.4% Never married57.0% Now married0.0% Separated5.6% Widowed5.9% DivorcedWomen who gave birth in the past 12 months Now married:
100.0% (19)Unmarried:
0.0% (0)
Women who did not give birth in the past 12 months Now married:
48.8% (574)Unmarried:
51.2% (602)
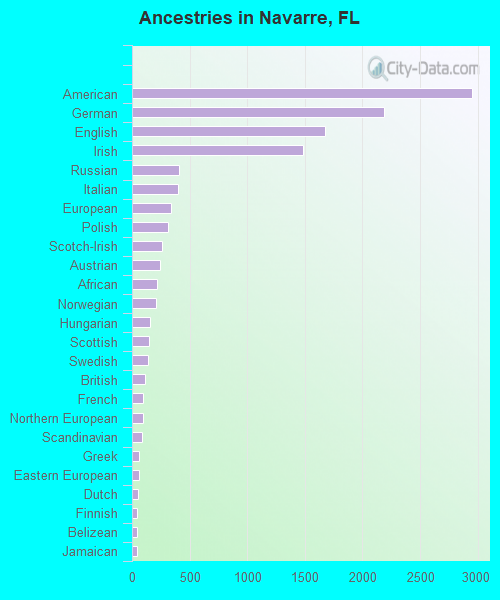
Ancestries in Navarre
2,951 17.5% American2,189 13.0% German1,675 9.9% English1,487 8.8% Irish412 2.4% Russian396 2.3% Italian335 2.0% European312 1.9% Polish260 1.5% Scotch-Irish245 1.5% Austrian216 1.3% African208 1.2% Norwegian155 0.9% Hungarian149 0.9% Scottish142 0.8% Swedish117 0.7% British99 0.6% French97 0.6% Northern European90 0.5% Scandinavian61 0.4% Greek57 0.3% Eastern European54 0.3% Dutch46 0.3% Finnish43 0.3% Belizean40 0.2% Jamaican35 0.2% French Canadian33 0.2% Czech31 0.2% Cajun23 0.1% Turkish17 0.1% Canadian13 0.08% Welsh8 0.05% Swiss1 0.01% Australian
Geographical mobility in Navarre Same house 1 year ago 25,496 81.7% White (Caucasian)1,732 73.1% Black or African American58 100.0% American Indian / Alaska Native1,025 95.5% Asian23 100.0% Native Hawaiian / Pacific Islander1,551 76.7% Other race3,145 75.6% Two or more races23,759 81.0% White alone, not Hispanic / Latino3,887 88.0% Hispanic or LatinoMoved within same county 1,802 5.8% White / Caucasian143 6.0% Black or African American6 0.6% Asian51 2.5% Other race307 7.4% Two or more races1,805 6.2% White alone, not Hispanic / Latino33 0.7% Hispanic or LatinoMoved within same state 743 2.4% White / Caucasian3 0.1% Black or African American286 14.1% Other race143 3.4% Two or more races735 2.5% White alone, not Hispanic / Latino42 0.9% Hispanic or LatinoMoved from different state 2,961 9.5% White / Caucasian467 19.7% Black or African American410 9.9% Two or more races2,825 9.6% White alone, not Hispanic / Latino403 9.1% Hispanic or LatinoMoved from abroad 211 0.7% White57 5.3% Asian147 7.3% Other race103 2.5% Two or more races255 0.9% White alone, not Hispanic / Latino198 4.5% Hispanic or Latino
Children Nativity (place of birth) in Navarre
Children under 6 years - Living with two parents Both parents native 1,155 100.0% NativeOne native, one foreign-born parent 422 100.0% NativeChildren under 6 years - Living with one parent Native parent 688 100.0% NativeChildren 6 to 17 years - Living with two parents Both parents native 3,427 100.0% NativeBoth parents foreign-born 138 59.2% Native95 40.8% Foreign-bornOne native, one foreign-born parent 1,280 100.0% NativeChildren 6 to 17 years - Living with one parent Native parent 1,848 100.0% NativeForeign-born parent 147 50.6% Native143 49.4% Foreign-born
Grandparents responsible for own grandchildren in Navarre
Grandparents (30 to 59 years) White / Caucasian 41 25.2% Responsible for grandchildren121 74.8% Not responsible for grandchildrenOther race 97 100.0% Responsible for grandchildrenTwo or more races 21 100.0% Responsible for grandchildrenWhite alone, not Hispanic / Latino 41 27.9% Responsible for grandchildren105 72.1% Not responsible for grandchildrenHispanic or Latino 76 72.2% Responsible for grandchildren29 27.8% Not responsible for grandchildrenGrandparents (60 years and over) White / Caucasian 132 31.9% Responsible for grandchildren281 68.1% Not responsible for grandchildrenWhite alone, not Hispanic / Latino 134 34.4% Responsible for grandchildren256 65.6% Not responsible for grandchildrenHispanic or Latino 71 100.0% Not responsible for grandchildren