Races in Neabsco, Virginia (VA) Detailed Stats
Data:
Races - White alone (%)
Races - White alone (% change since 2000)
Races - Black alone (%)
Races - Black alone (% change since 2000)
Races - American Indian alone (%)
Races - American Indian alone (% change since 2000)
Races - Asian alone (%)
Races - Asian alone (% change since 2000)
Races - Hispanic (%)
Races - Hispanic (% change since 2000)
Races - Native Hawaiian and Other Pacific Islander alone (%)
Races - Native Hawaiian and Other Pacific Islander alone (% change since 2000)
Races - Two or more races(%)
Races - Two or more races(% change since 2000)
Races - Other race alone (%)
Races - Other race alone (% change since 2000)
Racial diversity
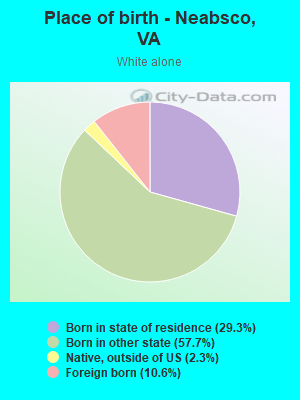
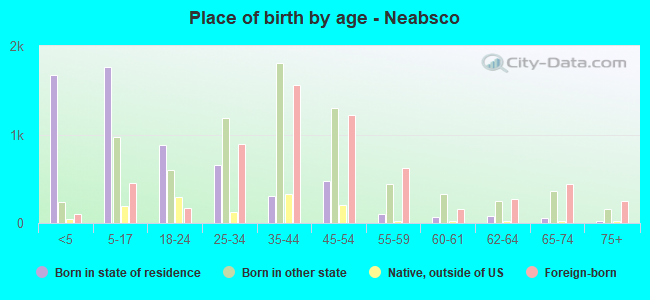
Place of birth - Born in state of residence (%)
Place of birth - Born in state of residence (%) - White
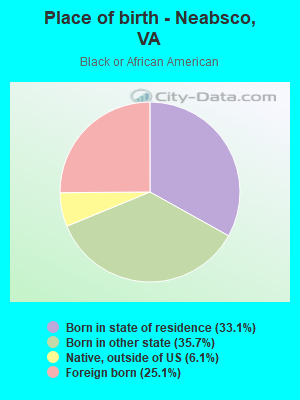
Place of birth - Born in state of residence (%) - Black or African American
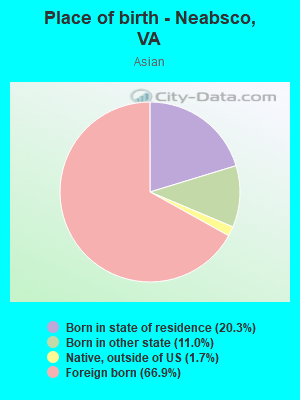
Place of birth - Born in state of residence (%) - Asian
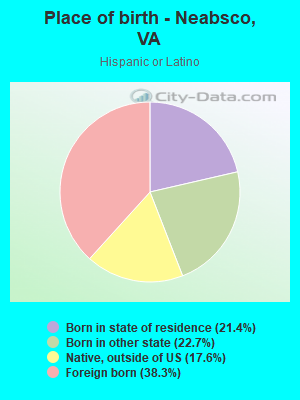
Place of birth - Born in state of residence (%) - Hispanic or Latino
Place of birth - Born in state of residence (%) - American Indian and Alaska Native
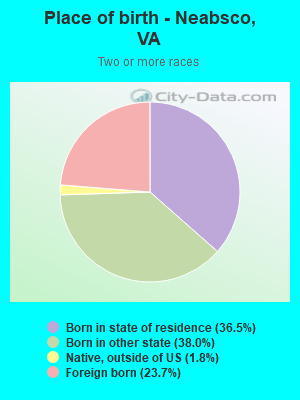
Place of birth - Born in state of residence (%) - Multirace
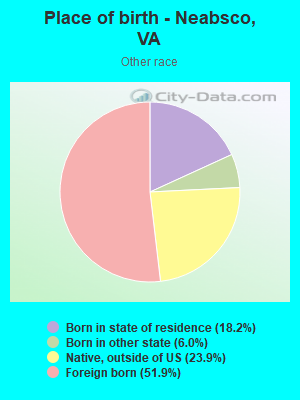
Place of birth - Born in state of residence (%) - Other Race
Place of birth - Born in other state (%)
Place of birth - Born in other state (%) - White
Place of birth - Born in other state (%) - Black or African American
Place of birth - Born in other state (%) - Asian
Place of birth - Born in other state (%) - Hispanic or Latino
Place of birth - Born in other state (%) - American Indian and Alaska Native
Place of birth - Born in other state (%) - Multirace
Place of birth - Born in other state (%) - Other Race
Place of birth - Native, outside of US (%)
Place of birth - Native, outside of US (%) - White
Place of birth - Native, outside of US (%) - Black or African American
Place of birth - Native, outside of US (%) - Asian
Place of birth - Native, outside of US (%) - Hispanic or Latino
Place of birth - Native, outside of US (%) - American Indian and Alaska Native
Place of birth - Native, outside of US (%) - Multirace
Place of birth - Native, outside of US (%) - Other Race
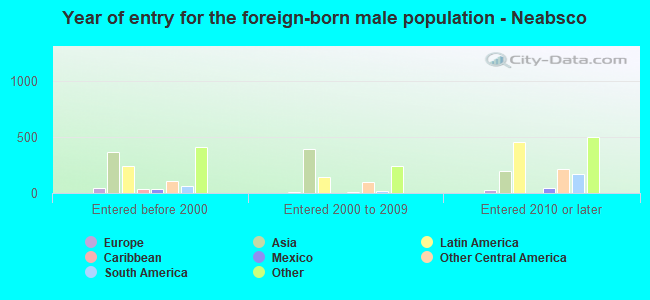
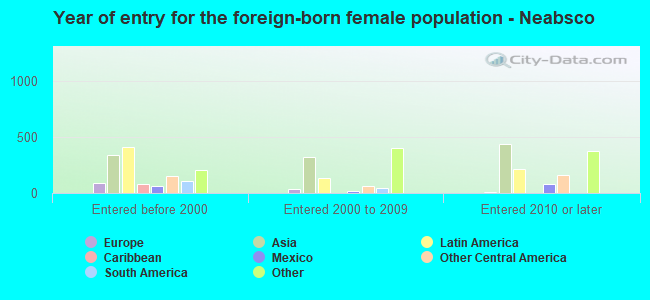
Place of birth - Foreign born (%)
Place of birth - Foreign born (%) - White
Place of birth - Foreign born (%) - Black or African American
Place of birth - Foreign born (%) - Asian
Place of birth - Foreign born (%) - Hispanic or Latino
Place of birth - Foreign born (%) - American Indian and Alaska Native
Place of birth - Foreign born (%) - Multirace
Place of birth - Foreign born (%) - Other Race
Residents speaking English at home (%)
Residents speaking English at home - Born in the United States (%)
Residents speaking English at home - Native, born elsewhere (%)
Residents speaking English at home - Foreign born (%)
Residents speaking Spanish at home (%)
Residents speaking Spanish at home - Born in the United States (%)
Residents speaking Spanish at home - Native, born elsewhere (%)
Residents speaking Spanish at home - Foreign born (%)
Residents speaking other language at home (%)
Residents speaking other language at home - Born in the United States (%)
Residents speaking other language at home - Native, born elsewhere (%)
Residents speaking other language at home - Foreign born (%)
Marital status - Never married (%)
Marital status - Now married (%)
Marital status - Separated (%)
Marital status - Widowed (%)
Marital status - Divorced (%)
Ancestries Reported - Arab (%)
Ancestries Reported - Czech (%)
Ancestries Reported - Danish (%)
Ancestries Reported - Dutch (%)
Ancestries Reported - English (%)
Ancestries Reported - French (%)
Ancestries Reported - French Canadian (%)
Ancestries Reported - German (%)
Ancestries Reported - Greek (%)
Ancestries Reported - Hungarian (%)
Ancestries Reported - Irish (%)
Ancestries Reported - Italian (%)
Ancestries Reported - Lithuanian (%)
Ancestries Reported - Norwegian (%)
Ancestries Reported - Polish (%)
Ancestries Reported - Portuguese (%)
Ancestries Reported - Russian (%)
Ancestries Reported - Scotch-Irish (%)
Ancestries Reported - Scottish (%)
Ancestries Reported - Slovak (%)
Ancestries Reported - Subsaharan African (%)
Ancestries Reported - Swedish (%)
Ancestries Reported - Swiss (%)
Ancestries Reported - Ukrainian (%)
Ancestries Reported - United States (%)
Ancestries Reported - Welsh (%)
Ancestries Reported - West Indian (%)
Ancestries Reported - Other (%)
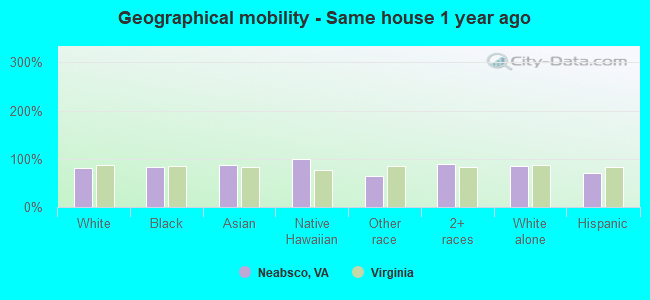
Geographical mobility - Same house 1 year ago (%)
Geographical mobility - Same house 1 year ago (%) - White
Geographical mobility - Same house 1 year ago (%) - Black or African American
Geographical mobility - Same house 1 year ago (%) - Asian
Geographical mobility - Same house 1 year ago (%) - Hispanic or Latino
Geographical mobility - Same house 1 year ago (%) - American Indian and Alaska Native
Geographical mobility - Same house 1 year ago (%) - Multirace
Geographical mobility - Same house 1 year ago (%) - Other Race
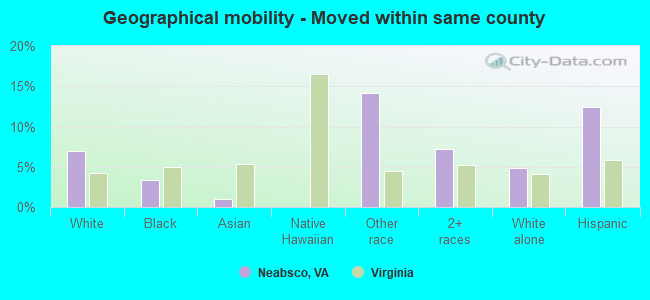
Geographical mobility - Moved within same county (%)
Geographical mobility - Moved within same county (%) - White
Geographical mobility - Moved within same county (%) - Black or African American
Geographical mobility - Moved within same county (%) - Asian
Geographical mobility - Moved within same county (%) - Hispanic or Latino
Geographical mobility - Moved within same county (%) - American Indian and Alaska Native
Geographical mobility - Moved within same county (%) - Multirace
Geographical mobility - Moved within same county (%) - Other Race
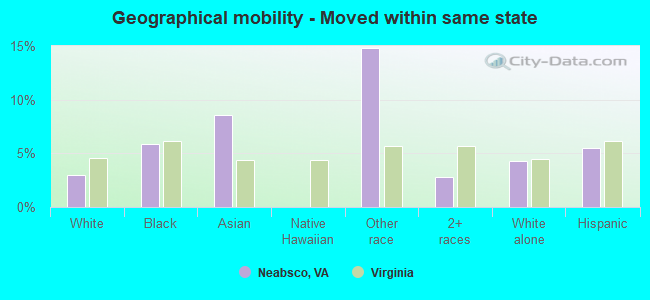
Geographical mobility - Moved from different county within same state (%)
Geographical mobility - Moved from different county within same state (%) - White
Geographical mobility - Moved from different county within same state (%) - Black or African American
Geographical mobility - Moved from different county within same state (%) - Asian
Geographical mobility - Moved from different county within same state (%) - Hispanic or Latino
Geographical mobility - Moved from different county within same state (%) - American Indian and Alaska Native
Geographical mobility - Moved from different county within same state (%) - Multirace
Geographical mobility - Moved from different county within same state (%) - Other Race
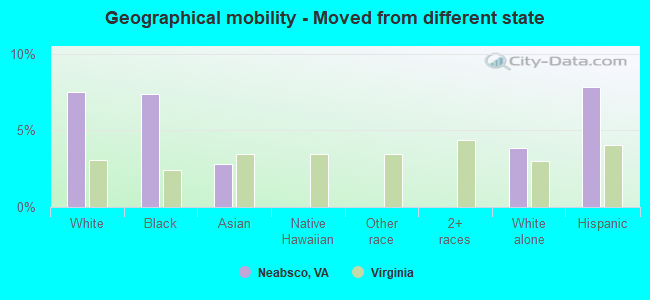
Geographical mobility - Moved from different state (%)
Geographical mobility - Moved from different state (%) - White
Geographical mobility - Moved from different state (%) - Black or African American
Geographical mobility - Moved from different state (%) - Asian
Geographical mobility - Moved from different state (%) - Hispanic or Latino
Geographical mobility - Moved from different state (%) - American Indian and Alaska Native
Geographical mobility - Moved from different state (%) - Multirace
Geographical mobility - Moved from different state (%) - Other Race
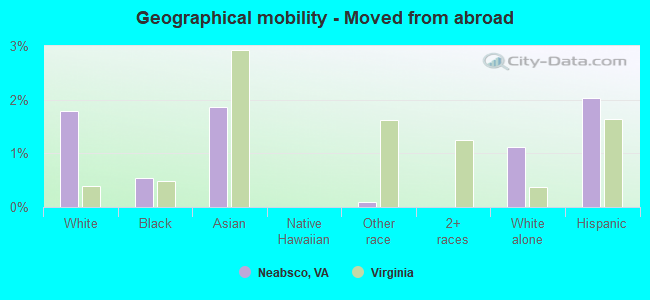
Geographical mobility - Moved from abroad (%)
Geographical mobility - Moved from abroad (%) - White
Geographical mobility - Moved from abroad (%) - Black or African American
Geographical mobility - Moved from abroad (%) - Asian
Geographical mobility - Moved from abroad (%) - Hispanic or Latino
Geographical mobility - Moved from abroad (%) - American Indian and Alaska Native
Geographical mobility - Moved from abroad (%) - Multirace
Geographical mobility - Moved from abroad (%) - Other Race
Place of birth for the foreign-born population - Ireland (%)
Place of birth for the foreign-born population - Denmark (%)
Place of birth for the foreign-born population - Norway (%)
Place of birth for the foreign-born population - Sweden (%)
Place of birth for the foreign-born population - United Kingdom (%)
Place of birth for the foreign-born population - England (%)
Place of birth for the foreign-born population - Scotland (%)
Place of birth for the foreign-born population - Other Northern Europe (%)
Place of birth for the foreign-born population - Austria (%)
Place of birth for the foreign-born population - Belgium (%)
Place of birth for the foreign-born population - France (%)
Place of birth for the foreign-born population - Germany (%)
Place of birth for the foreign-born population - Netherlands (%)
Place of birth for the foreign-born population - Switzerland (%)
Place of birth for the foreign-born population - Other Western Europe (%)
Place of birth for the foreign-born population - Greece (%)
Place of birth for the foreign-born population - Italy (%)
Place of birth for the foreign-born population - Portugal (%)
Place of birth for the foreign-born population - Spain (%)
Place of birth for the foreign-born population - Other Southern Europe (%)
Place of birth for the foreign-born population - Albania (%)
Place of birth for the foreign-born population - Belarus (%)
Place of birth for the foreign-born population - Bosnia and Herzegovina (%)
Place of birth for the foreign-born population - Bulgaria (%)
Place of birth for the foreign-born population - Croatia (%)
Place of birth for the foreign-born population - Czechoslovakia (%)
Place of birth for the foreign-born population - Hungary (%)
Place of birth for the foreign-born population - Latvia (%)
Place of birth for the foreign-born population - Lithuania (%)
Place of birth for the foreign-born population - North Macedonia (Macedonia) (%)
Place of birth for the foreign-born population - Moldova (%)
Place of birth for the foreign-born population - Poland (%)
Place of birth for the foreign-born population - Romania (%)
Place of birth for the foreign-born population - Russia (%)
Place of birth for the foreign-born population - Serbia (%)
Place of birth for the foreign-born population - Ukraine (%)
Place of birth for the foreign-born population - Other Eastern Europe (%)
Place of birth for the foreign-born population - China (%)
Place of birth for the foreign-born population - Hong Kong (%)
Place of birth for the foreign-born population - Taiwan (%)
Place of birth for the foreign-born population - Japan (%)
Place of birth for the foreign-born population - Korea (%)
Place of birth for the foreign-born population - Other Eastern Asia (%)
Place of birth for the foreign-born population - Afghanistan (%)
Place of birth for the foreign-born population - Bangladesh (%)
Place of birth for the foreign-born population - India (%)
Place of birth for the foreign-born population - Iran (%)
Place of birth for the foreign-born population - Kazakhstan (%)
Place of birth for the foreign-born population - Nepal (%)
Place of birth for the foreign-born population - Pakistan (%)
Place of birth for the foreign-born population - Sri Lanka (%)
Place of birth for the foreign-born population - Uzbekistan (%)
Place of birth for the foreign-born population - Other South Central Asia (%)
Place of birth for the foreign-born population - Burma (%)
Place of birth for the foreign-born population - Cambodia (%)
Place of birth for the foreign-born population - Indonesia (%)
Place of birth for the foreign-born population - Laos (%)
Place of birth for the foreign-born population - Malaysia (%)
Place of birth for the foreign-born population - Philippines (%)
Place of birth for the foreign-born population - Singapore (%)
Place of birth for the foreign-born population - Thailand (%)
Place of birth for the foreign-born population - Vietnam (%)
Place of birth for the foreign-born population - Other South Eastern Asia (%)
Place of birth for the foreign-born population - Armenia (%)
Place of birth for the foreign-born population - Iraq (%)
Place of birth for the foreign-born population - Israel (%)
Place of birth for the foreign-born population - Jordan (%)
Place of birth for the foreign-born population - Kuwait (%)
Place of birth for the foreign-born population - Lebanon (%)
Place of birth for the foreign-born population - Saudi Arabia (%)
Place of birth for the foreign-born population - Syria (%)
Place of birth for the foreign-born population - Turkey (%)
Place of birth for the foreign-born population - Yemen (%)
Place of birth for the foreign-born population - Other Western Asia (%)
Place of birth for the foreign-born population - Eritrea (%)
Place of birth for the foreign-born population - Ethiopia (%)
Place of birth for the foreign-born population - Kenya (%)
Place of birth for the foreign-born population - Somalia (%)
Place of birth for the foreign-born population - Uganda (%)
Place of birth for the foreign-born population - Zimbabwe (%)
Place of birth for the foreign-born population - Other Eastern Africa (%)
Place of birth for the foreign-born population - Cameroon (%)
Place of birth for the foreign-born population - Congo (%)
Place of birth for the foreign-born population - Democratic Republic of Congo (Zaire) (%)
Place of birth for the foreign-born population - Other Middle Africa (%)
Place of birth for the foreign-born population - Egypt (%)
Place of birth for the foreign-born population - Morocco (%)
Place of birth for the foreign-born population - Sudan (%)
Place of birth for the foreign-born population - Other Northern Africa (%)
Place of birth for the foreign-born population - South Africa (%)
Place of birth for the foreign-born population - Other Southern Africa (%)
Place of birth for the foreign-born population - Cabo Verde (%)
Place of birth for the foreign-born population - Ghana (%)
Place of birth for the foreign-born population - Liberia (%)
Place of birth for the foreign-born population - Nigeria (%)
Place of birth for the foreign-born population - Senegal (%)
Place of birth for the foreign-born population - Sierra Leone (%)
Place of birth for the foreign-born population - Other Western Africa (%)
Place of birth for the foreign-born population - Australia (%)
Place of birth for the foreign-born population - New Zealand (%)
Place of birth for the foreign-born population - Fiji (%)
Place of birth for the foreign-born population - Micronesia (%)
Place of birth for the foreign-born population - Bahamas (%)
Place of birth for the foreign-born population - Barbados (%)
Place of birth for the foreign-born population - Cuba (%)
Place of birth for the foreign-born population - Dominica (%)
Place of birth for the foreign-born population - Dominican Republic (%)
Place of birth for the foreign-born population - Grenada (%)
Place of birth for the foreign-born population - Haiti (%)
Place of birth for the foreign-born population - Jamaica (%)
Place of birth for the foreign-born population - St. Vincent and the Grenadines (%)
Place of birth for the foreign-born population - Trinidad and Tobago (%)
Place of birth for the foreign-born population - West Indies (%)
Place of birth for the foreign-born population - Other Caribbean (%)
Place of birth for the foreign-born population - Belize (%)
Place of birth for the foreign-born population - Costa Rica (%)
Place of birth for the foreign-born population - El Salvador (%)
Place of birth for the foreign-born population - Guatemala (%)
Place of birth for the foreign-born population - Honduras (%)
Place of birth for the foreign-born population - Mexico (%)
Place of birth for the foreign-born population - Nicaragua (%)
Place of birth for the foreign-born population - Panama (%)
Place of birth for the foreign-born population - Other Central America (%)
Place of birth for the foreign-born population - Argentina (%)
Place of birth for the foreign-born population - Bolivia (%)
Place of birth for the foreign-born population - Brazil (%)
Place of birth for the foreign-born population - Chile (%)
Place of birth for the foreign-born population - Colombia (%)
Place of birth for the foreign-born population - Ecuador (%)
Place of birth for the foreign-born population - Guyana (%)
Place of birth for the foreign-born population - Peru (%)
Place of birth for the foreign-born population - Uruguay (%)
Place of birth for the foreign-born population - Venezuela (%)
Place of birth for the foreign-born population - Other South America (%)
Place of birth for the foreign-born population - Canada (%)
Place of birth for the foreign-born population - Other Northern America (%)
Place of birth for the foreign-born population - Other (%)
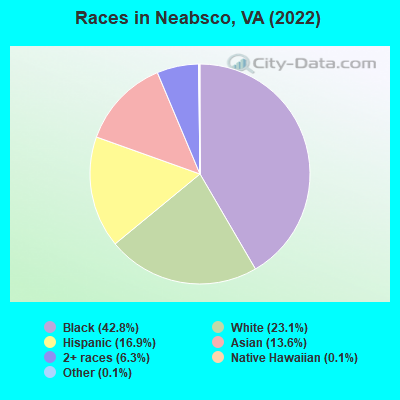
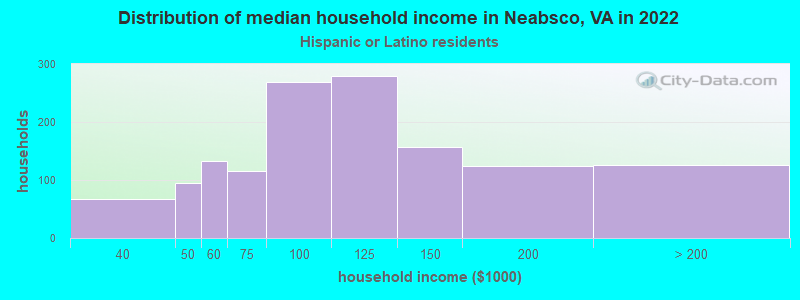
According to 2022 data, the most numerous races in Neabsco, VA are White alone (4,888 residents), Black alone (9,058 residents), and Hispanic (3,572 residents). 65.5% of Neabsco residents speak English at home.
Race distribution in Neabsco 9,058 42.8% Black alone 4,888 23.1% White alone 3,572 16.9% Hispanic 2,873 13.6% Asian alone 1,324 6.3% Two or more races 23 0.1% Other race alone 29 0.1% Native Hawaiian and Other
2000 2022
4,965,637 70.2% White alone 1,376,378 19.4% Black alone 329,540 4.7% Hispanic 259,277 3.7% Asian alone 114,022 1.6% Two or more races 18,596 0.3% American Indian alone 11,685 0.2% Other race alone 3,380 0.05% Native Hawaiian and Other
5,095,130 58.7% White alone 1,594,785 18.4% Black alone 905,750 10.4% Hispanic 602,881 6.9% Asian alone 406,047 4.7% Two or more races 60,419 0.7% Other race alone 11,738 0.1% American Indian alone 6,869 0.08% Native Hawaiian and Other
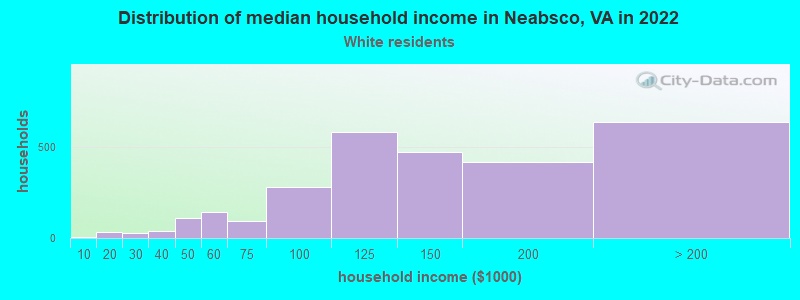
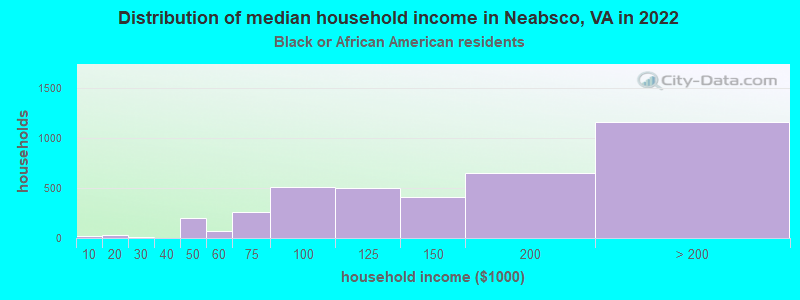
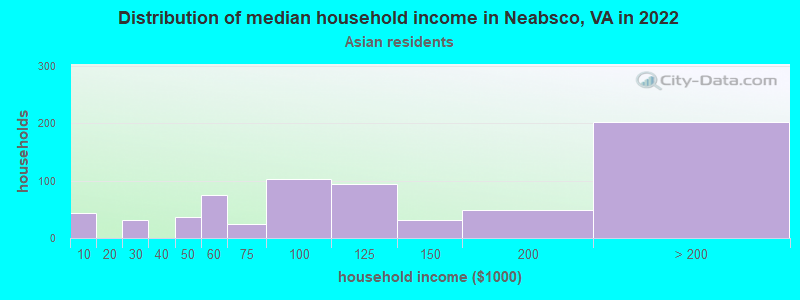
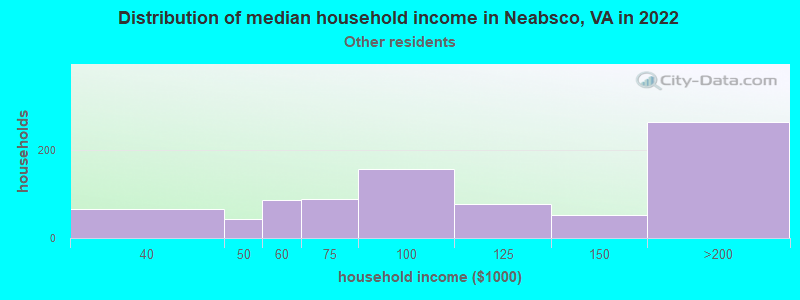
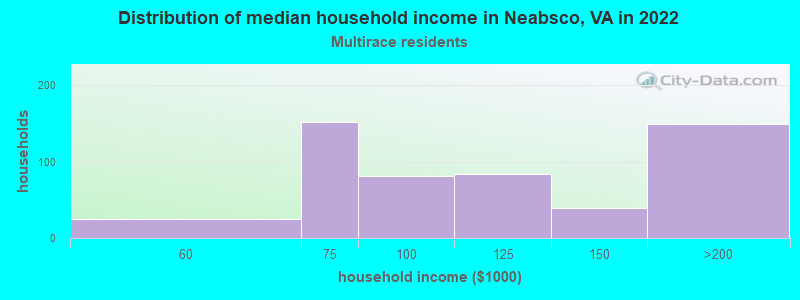
Income and house value in Neabsco Median household income in 2022 $148,544 White non-Hispanic householders$147,069 Black householders$105,904 Asian householders$103,550 Some other race householders$122,499 Two or more races householders$111,260 Hispanic or Latino race householders
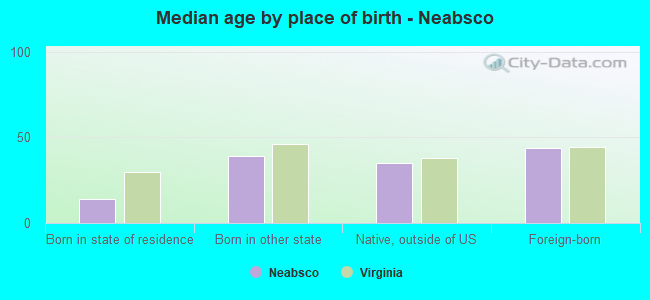
Median age by race in Neabsco
37.1 Median age for White residents37.6 37.9 35.1 Median age for Black or African American residents35.4 34.8 40.2 Median age for Asian residents38.2 41.6 39.0 Median age for Other race residents30.2 45.6 32.2 Median age for Two or more races residents32.4 29.8 38.7 Median age for White alone residents38.5 39.0 36.1 Median age for Hispanic or Latino residents34.7 40.3
Owner/renter occupied households by race in Neabsco
House owners and renters - White residents 1,790 67.1% Owner occupied876 32.9% Renter occupiedHouse owners and renters - Black or African American residents 1,857 64.5% Owner occupied1,022 35.5% Renter occupiedHouse owners and renters - Asian residents 761 95.0% Owner occupied40 5.0% Renter occupiedHouse owners and renters - Other race residents 395 68.5% Owner occupied182 31.5% Renter occupiedHouse owners and renters - Two or more races residents 424 81.9% Owner occupied94 18.1% Renter occupiedHouse owners and renters - White alone residents 1,458 70.4% Owner occupied612 29.6% Renter occupiedHouse owners and renters - Hispanic or Latino residents 846 63.0% Owner occupied497 37.0% Renter occupied
Language usage in Neabsco
English speakers - Total 65.5% of residents of Neabsco speak English at home.
12.0% of residents speak Spanish at home 1,304 58.1% Speak English very well942 41.9% Speak English less than very well22.9% of residents speak other language at home 2,906 68.1% Speak English very well1,361 31.9% Speak English less than very well
English speakers - Born in the United States 92.8% of residents of Neabsco speak English at home.
4.3% of residents speak Spanish at home 311 94.2% Speak English very well19 5.8% Speak English less than very well2.9% of residents speak other language at home 180 82.9% Speak English very well37 17.1% Speak English less than very well
English speakers - Native, born elsewhere 48.5% of residents of Neabsco speak English at home.
39.0% of residents speak Spanish at home 233 51.9% Speak English very well216 48.1% Speak English less than very well13.2% of residents speak other language at home 152 100.0% Speak English very well
English speakers - Foreign-born 17.8% of residents of Neabsco speak English at home.
19.4% of residents speak Spanish at home 439 41.1% Speak English very well629 58.9% Speak English less than very well63.1% of residents speak other language at home 2,167 62.4% Speak English very well1,305 37.6% Speak English less than very well
White (Caucasian) - Speak only English Native:
85.9% (4,174)Foreign-born:
13.4% (126)
White (Caucasian) - Speak another language Native:
12.3% (596)Foreign-born:
84.0% (788)
Black or African American - Speak only English Native:
94.3% (5,504)Foreign-born:
24.7% (577)
Black or African American - Speak another language Native:
5.6% (327)Foreign-born:
75.4% (1,758)
Asian - Speak only English Native:
48.0% (375)Foreign-born:
12.6% (241)
Asian - Speak another language Native:
51.6% (403)Foreign-born:
87.4% (1,674)
Other race - Speak only English Native:
27.6% (228)Foreign-born:
7.5% (43)
Other race - Speak another language Native:
68.9% (567)Foreign-born:
91.5% (527)
Two or more races - Speak only English Native:
78.1% (1,123)Foreign-born:
40.7% (200)
Two or more races - Speak another language Native:
18.7% (269)Foreign-born:
54.5% (268)
White alone - Speak only English Native:
95.1% (3,698)Foreign-born:
17.9% (96)
White alone - Speak another language Native:
4.7% (184)Foreign-born:
81.4% (437)
Hispanic or Latino - Speak only English Native:
43.1% (889)Foreign-born:
9.8% (120)
Hispanic or Latino - Speak another language Native:
55.8% (1,152)Foreign-born:
90.3% (1,113)
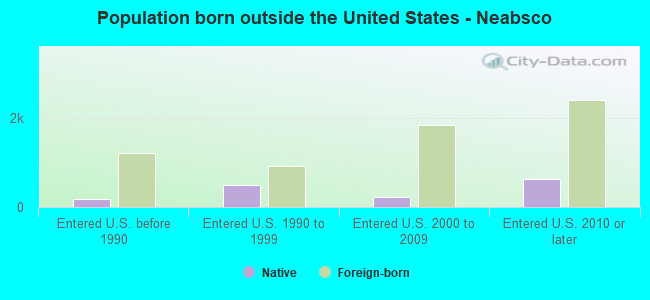
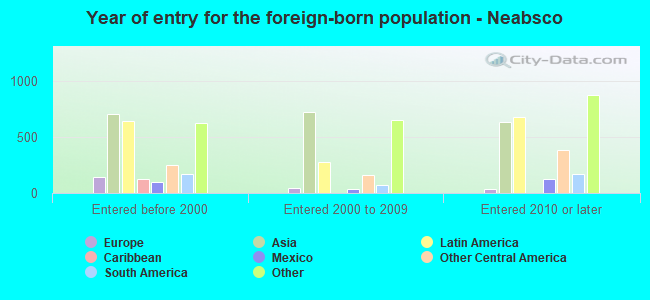
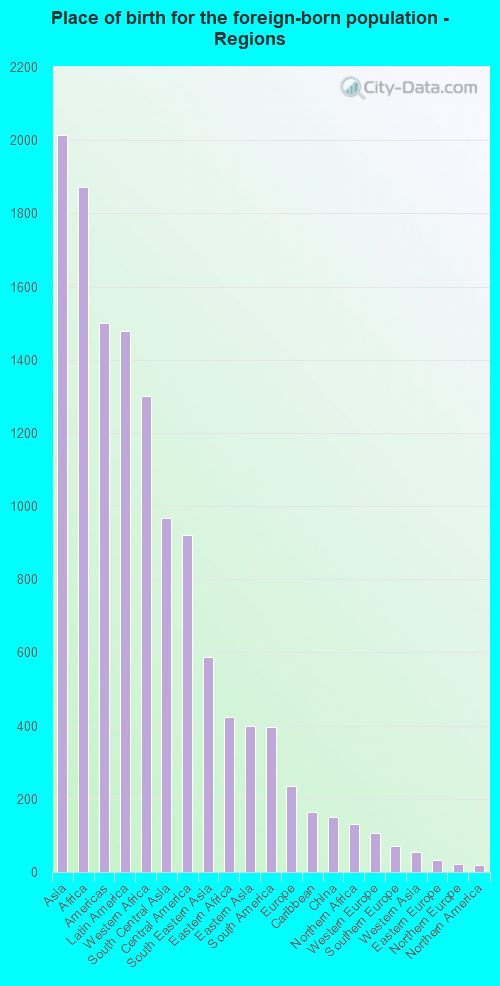
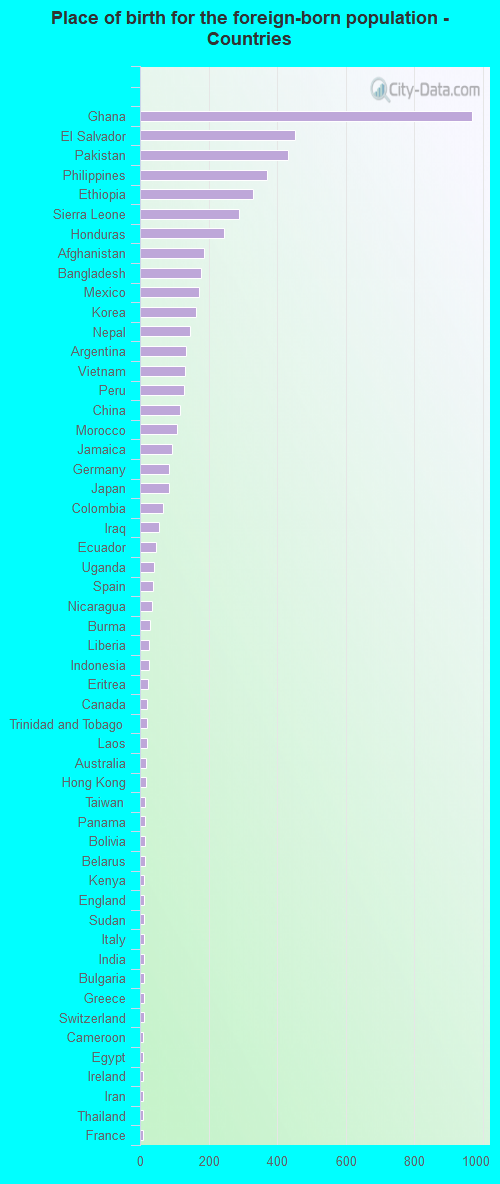
Foreign-born residents in Neabsco
Marital status for residents in Neabsco Marital status - White (Caucasian) population 15 years and over
Males 28.4% Never married58.2% Now married1.4% Separated0.4% Widowed11.6% DivorcedFemales 27.8% Never married54.8% Now married1.2% Separated6.9% Widowed9.4% DivorcedWomen who gave birth in the past 12 months Now married:
88.0% (42)Unmarried:
12.0% (6)
Women who did not give birth in the past 12 months Now married:
55.9% (949)Unmarried:
44.1% (749)
Marital status - Black or African American population 15 years and over
Males 33.8% Never married56.3% Now married3.4% Separated0.4% Widowed6.1% DivorcedFemales 32.7% Never married49.0% Now married1.2% Separated3.7% Widowed13.4% DivorcedWomen who gave birth in the past 12 months Now married:
60.0% (129)Unmarried:
40.0% (86)
Women who did not give birth in the past 12 months Now married:
45.9% (974)Unmarried:
54.1% (1,148)
Marital status - Asian population 15 years and over
Males 30.6% Never married63.5% Now married0.0% Separated0.0% Widowed5.9% DivorcedFemales 21.5% Never married71.3% Now married1.0% Separated3.2% Widowed3.1% DivorcedWomen who gave birth in the past 12 months Now married:
100.0% (13)Unmarried:
0.0% (0)
Women who did not give birth in the past 12 months Now married:
70.9% (701)Unmarried:
29.1% (289)
Marital status - Other race population 15 years and over
Males 0.0% Never married96.7% Now married0.0% Separated0.0% Widowed3.3% DivorcedFemales 22.1% Never married73.8% Now married4.1% Separated0.0% Widowed0.0% DivorcedWomen who gave birth in the past 12 months Now married:
100.0% (30)Unmarried:
0.0% (0)
Women who did not give birth in the past 12 months Now married:
74.5% (322)Unmarried:
25.5% (110)
Marital status - Two or more races population 15 years and over
Males 46.7% Never married39.0% Now married0.0% Separated0.0% Widowed14.3% DivorcedFemales 67.9% Never married19.2% Now married10.4% Separated0.0% Widowed2.6% DivorcedWomen who gave birth in the past 12 months Now married:
100.0% (29)Unmarried:
0.0% (0)
Women who did not give birth in the past 12 months Now married:
22.6% (109)Unmarried:
77.4% (374)
Marital status - White alone, not Hispanic / Latino population 15 years and over
Males 25.4% Never married59.7% Now married1.4% Separated0.5% Widowed13.0% DivorcedFemales 24.9% Never married59.1% Now married1.5% Separated6.6% Widowed7.8% DivorcedWomen who gave birth in the past 12 months Now married:
88.0% (41)Unmarried:
12.0% (6)
Women who did not give birth in the past 12 months Now married:
61.7% (749)Unmarried:
38.3% (465)
Marital status - Hispanic or Latino population 15 years and over
Males 23.9% Never married69.9% Now married0.8% Separated0.0% Widowed5.4% DivorcedFemales 32.3% Never married55.0% Now married1.8% Separated3.8% Widowed7.0% DivorcedWomen who gave birth in the past 12 months Now married:
100.0% (34)Unmarried:
0.0% (0)
Women who did not give birth in the past 12 months Now married:
53.5% (580)Unmarried:
46.5% (504)
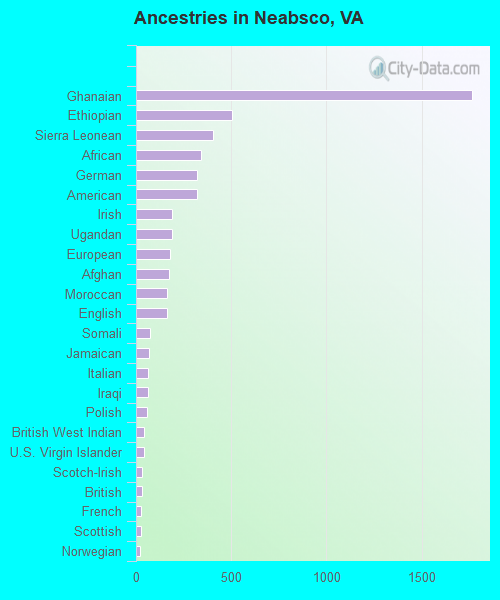
Ancestries in Neabsco
1,766 13.8% Ghanaian506 4.0% Ethiopian403 3.1% Sierra Leonean340 2.7% African323 2.5% German320 2.5% American190 1.5% Irish187 1.5% Ugandan178 1.4% European172 1.3% Afghan162 1.3% Moroccan162 1.3% English74 0.6% Somali68 0.5% Jamaican65 0.5% Italian61 0.5% Iraqi60 0.5% Polish43 0.3% British West Indian42 0.3% U.S. Virgin Islander33 0.3% Scotch-Irish30 0.2% British27 0.2% French25 0.2% Scottish22 0.2% Norwegian16 0.1% Syrian16 0.1% Sudanese13 0.1% Czech13 0.1% Australian11 0.09% French Canadian11 0.09% Bulgarian10 0.08% Egyptian9 0.07% Greek8 0.06% Northern European7 0.05% Serbian6 0.05% Hungarian6 0.05% Portuguese5 0.04% Lithuanian4 0.03% Russian4 0.03% Croatian2 0.02% Nigerian
Geographical mobility in Neabsco Same house 1 year ago 5,315 81.3% White (Caucasian)7,473 84.0% Black or African American2,508 87.7% Asian25 99.8% Native Hawaiian / Pacific Islander1,197 64.8% Other race1,889 89.5% Two or more races4,218 85.6% White alone, not Hispanic / Latino2,336 70.6% Hispanic or LatinoMoved within same county 455 7.0% White / Caucasian302 3.4% Black or African American29 1.0% Asian262 14.2% Other race151 7.1% Two or more races241 4.9% White alone, not Hispanic / Latino412 12.5% Hispanic or LatinoMoved within same state 198 3.0% White / Caucasian522 5.9% Black or African American246 8.6% Asian275 14.9% Other race60 2.8% Two or more races212 4.3% White alone, not Hispanic / Latino181 5.5% Hispanic or LatinoMoved from different state 489 7.5% White / Caucasian656 7.4% Black or African American80 2.8% Asian190 3.8% White alone, not Hispanic / Latino260 7.9% Hispanic or LatinoMoved from abroad 117 1.8% White48 0.5% Black or African American53 1.9% Asian2 0.1% Other race55 1.1% White alone, not Hispanic / Latino67 2.0% Hispanic or Latino
Children Nativity (place of birth) in Neabsco
Children under 6 years - Living with two parents Both parents native 823 100.0% NativeBoth parents foreign-born 810 87.7% Native114 12.3% Foreign-bornOne native, one foreign-born parent 269 100.0% NativeChildren under 6 years - Living with one parent Native parent 244 100.0% NativeForeign-born parent 64 100.0% NativeChildren 6 to 17 years - Living with two parents Both parents native 855 100.0% NativeBoth parents foreign-born 802 71.5% Native319 28.5% Foreign-bornOne native, one foreign-born parent 278 100.0% NativeChildren 6 to 17 years - Living with one parent Native parent 388 100.0% NativeForeign-born parent 146 51.9% Native135 48.1% Foreign-born
Grandparents responsible for own grandchildren in Neabsco
Grandparents (30 to 59 years) White / Caucasian 11 100.0% Not responsible for grandchildrenBlack or African American 24 45.1% Responsible for grandchildren29 54.9% Not responsible for grandchildrenWhite alone, not Hispanic / Latino 12 100.0% Not responsible for grandchildren
Grandparents (60 years and over) White / Caucasian 69 100.0% Not responsible for grandchildrenBlack or African American 99 100.0% Not responsible for grandchildrenWhite alone, not Hispanic / Latino 36 100.0% Not responsible for grandchildren