Races in Nesconset, New York (NY) Detailed Stats
Data:
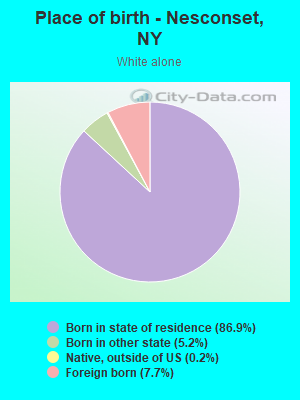
Races - White alone (%)
Races - White alone (% change since 2000)
Races - Black alone (%)
Races - Black alone (% change since 2000)
Races - American Indian alone (%)
Races - American Indian alone (% change since 2000)
Races - Asian alone (%)
Races - Asian alone (% change since 2000)
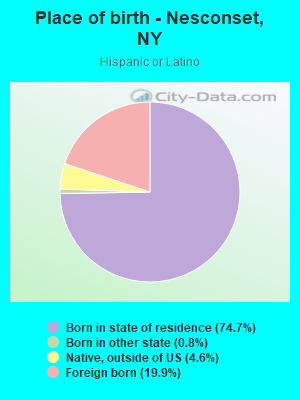
Races - Hispanic (%)
Races - Hispanic (% change since 2000)
Races - Native Hawaiian and Other Pacific Islander alone (%)
Races - Native Hawaiian and Other Pacific Islander alone (% change since 2000)
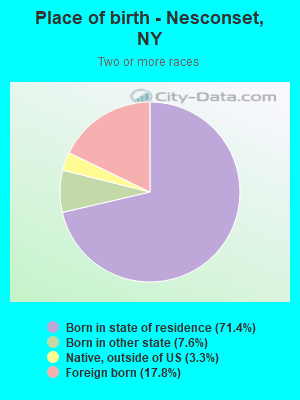
Races - Two or more races(%)
Races - Two or more races(% change since 2000)
Races - Other race alone (%)
Races - Other race alone (% change since 2000)
Racial diversity
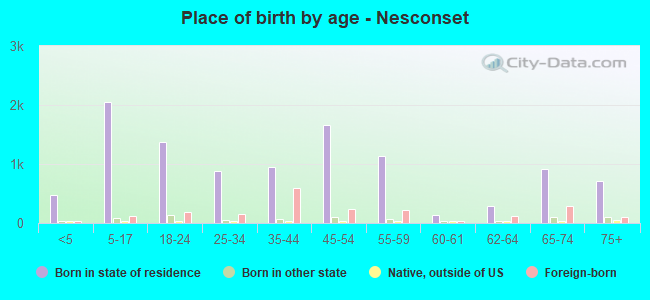
Place of birth - Born in state of residence (%)
Place of birth - Born in state of residence (%) - White
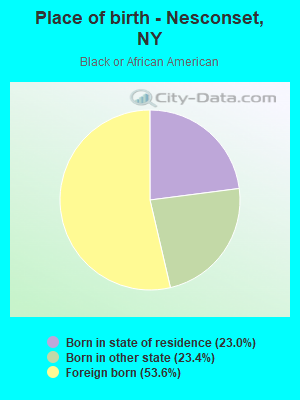
Place of birth - Born in state of residence (%) - Black or African American
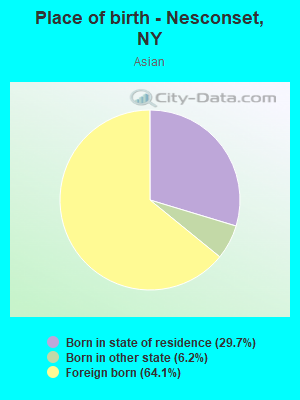
Place of birth - Born in state of residence (%) - Asian
Place of birth - Born in state of residence (%) - Hispanic or Latino
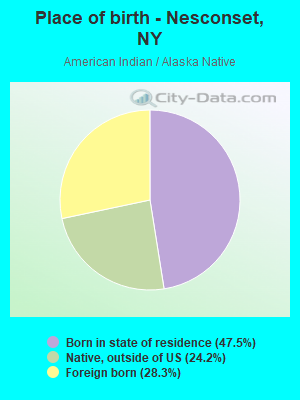
Place of birth - Born in state of residence (%) - American Indian and Alaska Native
Place of birth - Born in state of residence (%) - Multirace
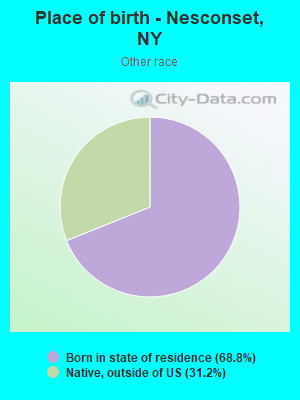
Place of birth - Born in state of residence (%) - Other Race
Place of birth - Born in other state (%)
Place of birth - Born in other state (%) - White
Place of birth - Born in other state (%) - Black or African American
Place of birth - Born in other state (%) - Asian
Place of birth - Born in other state (%) - Hispanic or Latino
Place of birth - Born in other state (%) - American Indian and Alaska Native
Place of birth - Born in other state (%) - Multirace
Place of birth - Born in other state (%) - Other Race
Place of birth - Native, outside of US (%)
Place of birth - Native, outside of US (%) - White
Place of birth - Native, outside of US (%) - Black or African American
Place of birth - Native, outside of US (%) - Asian
Place of birth - Native, outside of US (%) - Hispanic or Latino
Place of birth - Native, outside of US (%) - American Indian and Alaska Native
Place of birth - Native, outside of US (%) - Multirace
Place of birth - Native, outside of US (%) - Other Race
Place of birth - Foreign born (%)
Place of birth - Foreign born (%) - White
Place of birth - Foreign born (%) - Black or African American
Place of birth - Foreign born (%) - Asian
Place of birth - Foreign born (%) - Hispanic or Latino
Place of birth - Foreign born (%) - American Indian and Alaska Native
Place of birth - Foreign born (%) - Multirace
Place of birth - Foreign born (%) - Other Race
Residents speaking English at home (%)
Residents speaking English at home - Born in the United States (%)
Residents speaking English at home - Native, born elsewhere (%)
Residents speaking English at home - Foreign born (%)
Residents speaking Spanish at home (%)
Residents speaking Spanish at home - Born in the United States (%)
Residents speaking Spanish at home - Native, born elsewhere (%)
Residents speaking Spanish at home - Foreign born (%)
Residents speaking other language at home (%)
Residents speaking other language at home - Born in the United States (%)
Residents speaking other language at home - Native, born elsewhere (%)
Residents speaking other language at home - Foreign born (%)
Marital status - Never married (%)
Marital status - Now married (%)
Marital status - Separated (%)
Marital status - Widowed (%)
Marital status - Divorced (%)
Ancestries Reported - Arab (%)
Ancestries Reported - Czech (%)
Ancestries Reported - Danish (%)
Ancestries Reported - Dutch (%)
Ancestries Reported - English (%)
Ancestries Reported - French (%)
Ancestries Reported - French Canadian (%)
Ancestries Reported - German (%)
Ancestries Reported - Greek (%)
Ancestries Reported - Hungarian (%)
Ancestries Reported - Irish (%)
Ancestries Reported - Italian (%)
Ancestries Reported - Lithuanian (%)
Ancestries Reported - Norwegian (%)
Ancestries Reported - Polish (%)
Ancestries Reported - Portuguese (%)
Ancestries Reported - Russian (%)
Ancestries Reported - Scotch-Irish (%)
Ancestries Reported - Scottish (%)
Ancestries Reported - Slovak (%)
Ancestries Reported - Subsaharan African (%)
Ancestries Reported - Swedish (%)
Ancestries Reported - Swiss (%)
Ancestries Reported - Ukrainian (%)
Ancestries Reported - United States (%)
Ancestries Reported - Welsh (%)
Ancestries Reported - West Indian (%)
Ancestries Reported - Other (%)
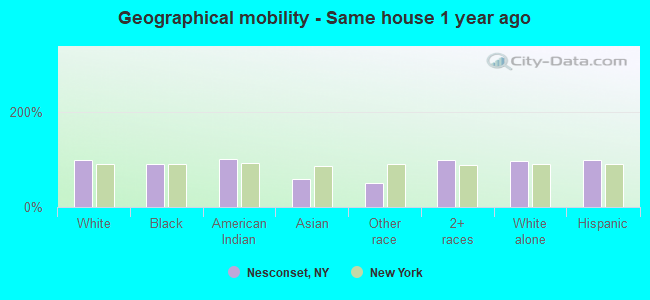
Geographical mobility - Same house 1 year ago (%)
Geographical mobility - Same house 1 year ago (%) - White
Geographical mobility - Same house 1 year ago (%) - Black or African American
Geographical mobility - Same house 1 year ago (%) - Asian
Geographical mobility - Same house 1 year ago (%) - Hispanic or Latino
Geographical mobility - Same house 1 year ago (%) - American Indian and Alaska Native
Geographical mobility - Same house 1 year ago (%) - Multirace
Geographical mobility - Same house 1 year ago (%) - Other Race
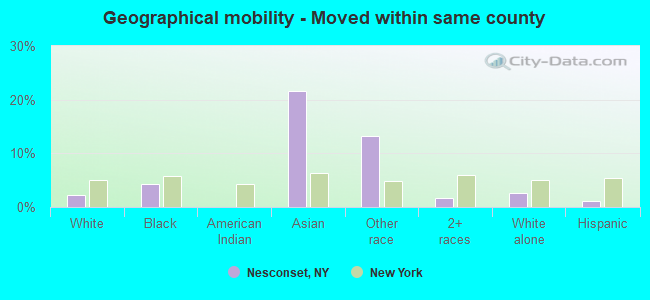
Geographical mobility - Moved within same county (%)
Geographical mobility - Moved within same county (%) - White
Geographical mobility - Moved within same county (%) - Black or African American
Geographical mobility - Moved within same county (%) - Asian
Geographical mobility - Moved within same county (%) - Hispanic or Latino
Geographical mobility - Moved within same county (%) - American Indian and Alaska Native
Geographical mobility - Moved within same county (%) - Multirace
Geographical mobility - Moved within same county (%) - Other Race
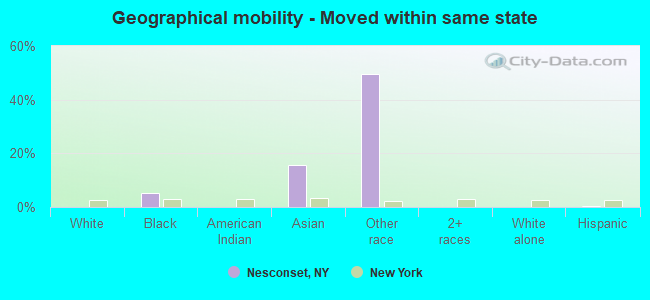
Geographical mobility - Moved from different county within same state (%)
Geographical mobility - Moved from different county within same state (%) - White
Geographical mobility - Moved from different county within same state (%) - Black or African American
Geographical mobility - Moved from different county within same state (%) - Asian
Geographical mobility - Moved from different county within same state (%) - Hispanic or Latino
Geographical mobility - Moved from different county within same state (%) - American Indian and Alaska Native
Geographical mobility - Moved from different county within same state (%) - Multirace
Geographical mobility - Moved from different county within same state (%) - Other Race
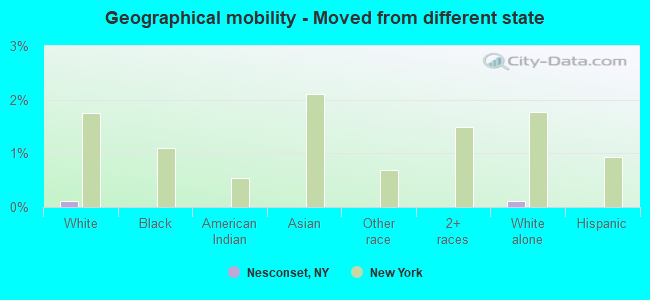
Geographical mobility - Moved from different state (%)
Geographical mobility - Moved from different state (%) - White
Geographical mobility - Moved from different state (%) - Black or African American
Geographical mobility - Moved from different state (%) - Asian
Geographical mobility - Moved from different state (%) - Hispanic or Latino
Geographical mobility - Moved from different state (%) - American Indian and Alaska Native
Geographical mobility - Moved from different state (%) - Multirace
Geographical mobility - Moved from different state (%) - Other Race
Geographical mobility - Moved from abroad (%)
Geographical mobility - Moved from abroad (%) - White
Geographical mobility - Moved from abroad (%) - Black or African American
Geographical mobility - Moved from abroad (%) - Asian
Geographical mobility - Moved from abroad (%) - Hispanic or Latino
Geographical mobility - Moved from abroad (%) - American Indian and Alaska Native
Geographical mobility - Moved from abroad (%) - Multirace
Geographical mobility - Moved from abroad (%) - Other Race
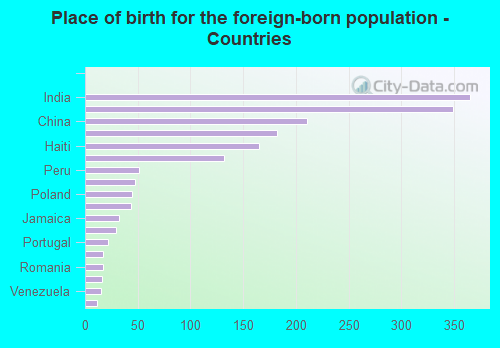
Place of birth for the foreign-born population - Ireland (%)
Place of birth for the foreign-born population - Denmark (%)
Place of birth for the foreign-born population - Norway (%)
Place of birth for the foreign-born population - Sweden (%)
Place of birth for the foreign-born population - United Kingdom (%)
Place of birth for the foreign-born population - England (%)
Place of birth for the foreign-born population - Scotland (%)
Place of birth for the foreign-born population - Other Northern Europe (%)
Place of birth for the foreign-born population - Austria (%)
Place of birth for the foreign-born population - Belgium (%)
Place of birth for the foreign-born population - France (%)
Place of birth for the foreign-born population - Germany (%)
Place of birth for the foreign-born population - Netherlands (%)
Place of birth for the foreign-born population - Switzerland (%)
Place of birth for the foreign-born population - Other Western Europe (%)
Place of birth for the foreign-born population - Greece (%)
Place of birth for the foreign-born population - Italy (%)
Place of birth for the foreign-born population - Portugal (%)
Place of birth for the foreign-born population - Spain (%)
Place of birth for the foreign-born population - Other Southern Europe (%)
Place of birth for the foreign-born population - Albania (%)
Place of birth for the foreign-born population - Belarus (%)
Place of birth for the foreign-born population - Bosnia and Herzegovina (%)
Place of birth for the foreign-born population - Bulgaria (%)
Place of birth for the foreign-born population - Croatia (%)
Place of birth for the foreign-born population - Czechoslovakia (%)
Place of birth for the foreign-born population - Hungary (%)
Place of birth for the foreign-born population - Latvia (%)
Place of birth for the foreign-born population - Lithuania (%)
Place of birth for the foreign-born population - North Macedonia (Macedonia) (%)
Place of birth for the foreign-born population - Moldova (%)
Place of birth for the foreign-born population - Poland (%)
Place of birth for the foreign-born population - Romania (%)
Place of birth for the foreign-born population - Russia (%)
Place of birth for the foreign-born population - Serbia (%)
Place of birth for the foreign-born population - Ukraine (%)
Place of birth for the foreign-born population - Other Eastern Europe (%)
Place of birth for the foreign-born population - China (%)
Place of birth for the foreign-born population - Hong Kong (%)
Place of birth for the foreign-born population - Taiwan (%)
Place of birth for the foreign-born population - Japan (%)
Place of birth for the foreign-born population - Korea (%)
Place of birth for the foreign-born population - Other Eastern Asia (%)
Place of birth for the foreign-born population - Afghanistan (%)
Place of birth for the foreign-born population - Bangladesh (%)
Place of birth for the foreign-born population - India (%)
Place of birth for the foreign-born population - Iran (%)
Place of birth for the foreign-born population - Kazakhstan (%)
Place of birth for the foreign-born population - Nepal (%)
Place of birth for the foreign-born population - Pakistan (%)
Place of birth for the foreign-born population - Sri Lanka (%)
Place of birth for the foreign-born population - Uzbekistan (%)
Place of birth for the foreign-born population - Other South Central Asia (%)
Place of birth for the foreign-born population - Burma (%)
Place of birth for the foreign-born population - Cambodia (%)
Place of birth for the foreign-born population - Indonesia (%)
Place of birth for the foreign-born population - Laos (%)
Place of birth for the foreign-born population - Malaysia (%)
Place of birth for the foreign-born population - Philippines (%)
Place of birth for the foreign-born population - Singapore (%)
Place of birth for the foreign-born population - Thailand (%)
Place of birth for the foreign-born population - Vietnam (%)
Place of birth for the foreign-born population - Other South Eastern Asia (%)
Place of birth for the foreign-born population - Armenia (%)
Place of birth for the foreign-born population - Iraq (%)
Place of birth for the foreign-born population - Israel (%)
Place of birth for the foreign-born population - Jordan (%)
Place of birth for the foreign-born population - Kuwait (%)
Place of birth for the foreign-born population - Lebanon (%)
Place of birth for the foreign-born population - Saudi Arabia (%)
Place of birth for the foreign-born population - Syria (%)
Place of birth for the foreign-born population - Turkey (%)
Place of birth for the foreign-born population - Yemen (%)
Place of birth for the foreign-born population - Other Western Asia (%)
Place of birth for the foreign-born population - Eritrea (%)
Place of birth for the foreign-born population - Ethiopia (%)
Place of birth for the foreign-born population - Kenya (%)
Place of birth for the foreign-born population - Somalia (%)
Place of birth for the foreign-born population - Uganda (%)
Place of birth for the foreign-born population - Zimbabwe (%)
Place of birth for the foreign-born population - Other Eastern Africa (%)
Place of birth for the foreign-born population - Cameroon (%)
Place of birth for the foreign-born population - Congo (%)
Place of birth for the foreign-born population - Democratic Republic of Congo (Zaire) (%)
Place of birth for the foreign-born population - Other Middle Africa (%)
Place of birth for the foreign-born population - Egypt (%)
Place of birth for the foreign-born population - Morocco (%)
Place of birth for the foreign-born population - Sudan (%)
Place of birth for the foreign-born population - Other Northern Africa (%)
Place of birth for the foreign-born population - South Africa (%)
Place of birth for the foreign-born population - Other Southern Africa (%)
Place of birth for the foreign-born population - Cabo Verde (%)
Place of birth for the foreign-born population - Ghana (%)
Place of birth for the foreign-born population - Liberia (%)
Place of birth for the foreign-born population - Nigeria (%)
Place of birth for the foreign-born population - Senegal (%)
Place of birth for the foreign-born population - Sierra Leone (%)
Place of birth for the foreign-born population - Other Western Africa (%)
Place of birth for the foreign-born population - Australia (%)
Place of birth for the foreign-born population - New Zealand (%)
Place of birth for the foreign-born population - Fiji (%)
Place of birth for the foreign-born population - Micronesia (%)
Place of birth for the foreign-born population - Bahamas (%)
Place of birth for the foreign-born population - Barbados (%)
Place of birth for the foreign-born population - Cuba (%)
Place of birth for the foreign-born population - Dominica (%)
Place of birth for the foreign-born population - Dominican Republic (%)
Place of birth for the foreign-born population - Grenada (%)
Place of birth for the foreign-born population - Haiti (%)
Place of birth for the foreign-born population - Jamaica (%)
Place of birth for the foreign-born population - St. Vincent and the Grenadines (%)
Place of birth for the foreign-born population - Trinidad and Tobago (%)
Place of birth for the foreign-born population - West Indies (%)
Place of birth for the foreign-born population - Other Caribbean (%)
Place of birth for the foreign-born population - Belize (%)
Place of birth for the foreign-born population - Costa Rica (%)
Place of birth for the foreign-born population - El Salvador (%)
Place of birth for the foreign-born population - Guatemala (%)
Place of birth for the foreign-born population - Honduras (%)
Place of birth for the foreign-born population - Mexico (%)
Place of birth for the foreign-born population - Nicaragua (%)
Place of birth for the foreign-born population - Panama (%)
Place of birth for the foreign-born population - Other Central America (%)
Place of birth for the foreign-born population - Argentina (%)
Place of birth for the foreign-born population - Bolivia (%)
Place of birth for the foreign-born population - Brazil (%)
Place of birth for the foreign-born population - Chile (%)
Place of birth for the foreign-born population - Colombia (%)
Place of birth for the foreign-born population - Ecuador (%)
Place of birth for the foreign-born population - Guyana (%)
Place of birth for the foreign-born population - Peru (%)
Place of birth for the foreign-born population - Uruguay (%)
Place of birth for the foreign-born population - Venezuela (%)
Place of birth for the foreign-born population - Other South America (%)
Place of birth for the foreign-born population - Canada (%)
Place of birth for the foreign-born population - Other Northern America (%)
Place of birth for the foreign-born population - Other (%)
Latest news about races in Nesconset, NY collected exclusively by city-data.com from local newspapers, TV, and radio stations
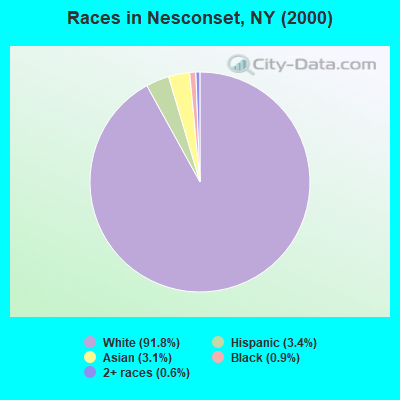
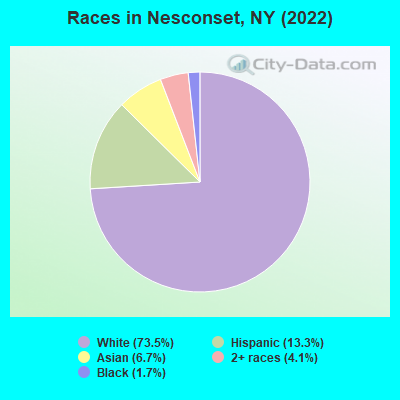
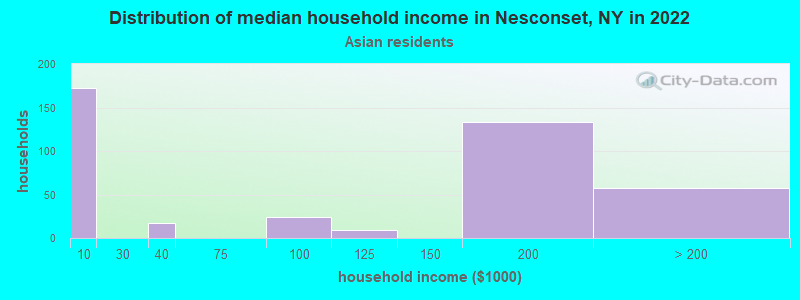
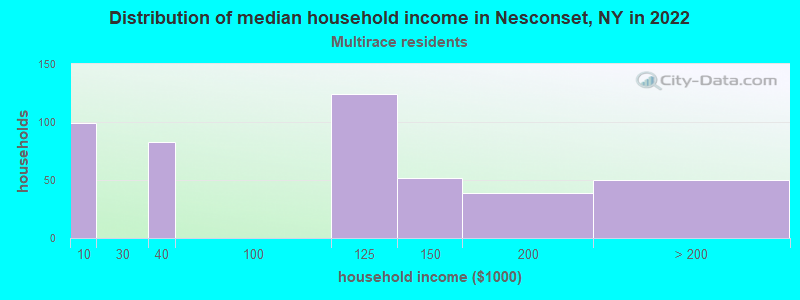
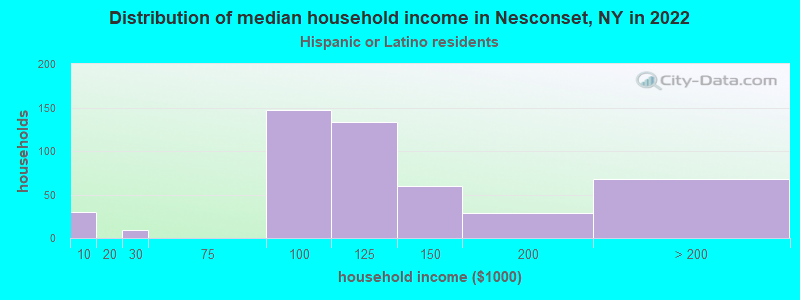
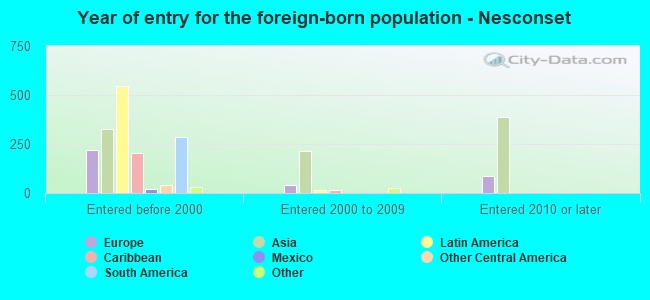
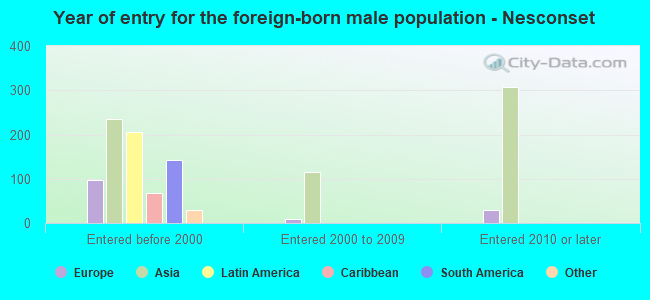
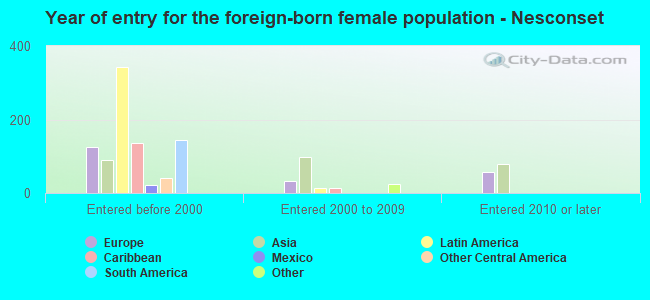
According to 2022 data, the most numerous races in Nesconset, NY are White alone (9,965 residents), Hispanic (1,809 residents), and Black alone (235 residents). 80.2% of Nesconset residents speak English at home. 13.9% of Nesconset, NY residents are foreign-born (6.9% born in Asia, 4.0% born in Latin America, 2.8% born in Europe), which is 58.7% less than the foreign-born rate of 22.0% across the entire state of New York.
Race distribution in Nesconset
2000 2022
11,760,981 62.0% White alone 2,867,583 15.1% Hispanic 2,812,623 14.8% Black alone 1,035,926 5.5% Asian alone 366,116 1.9% Two or more races 75,499 0.4% Other race alone 52,499 0.3% American Indian alone 5,230 0.03% Native Hawaiian and Other
10,408,933 52.9% White alone 3,867,299 19.7% Hispanic 2,633,840 13.4% Black alone 1,776,286 9.0% Asian alone 732,670 3.7% Two or more races 216,110 1.1% Other race alone 35,082 0.2% American Indian alone 6,931 0.04% Native Hawaiian and Other
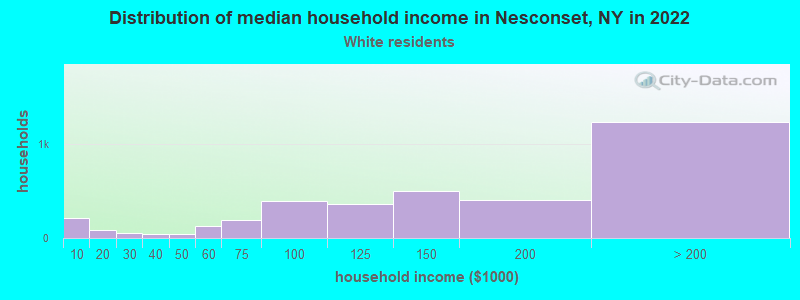
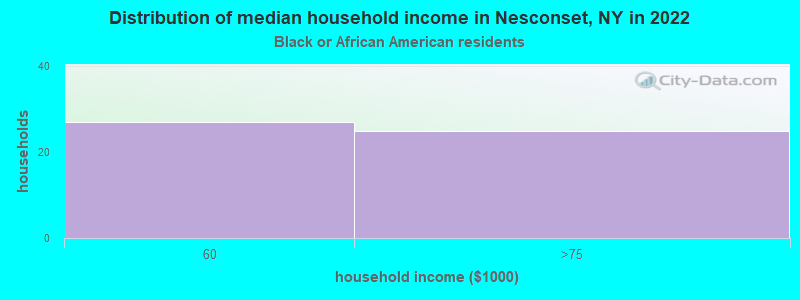
Income and house value in Nesconset Median household income in 2022 $141,614 White non-Hispanic householders$53,137 Black householders$110,330 Two or more races householders$111,715 Hispanic or Latino race householdersMedian 2022 house value $691,896 White Non-Hispanic householders$533,603 Black or African American householders $653,032 Asian householders$638,281 Some other race householders$638,281 Hispanic or Latino householders
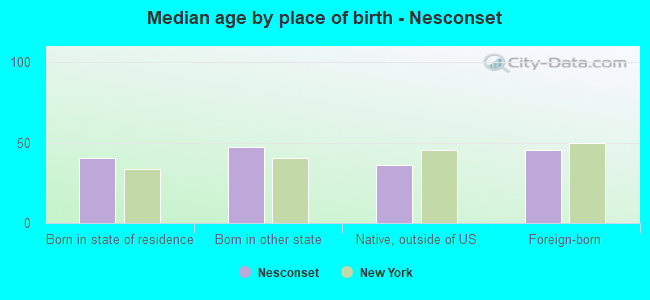
Median age by race in Nesconset
47.3 Median age for White residents43.3 48.7 70.7 Median age for Black or African American residents26.7 81.4 52.8 Median age for American Indian / Alaska Native residents-807,017,543.1 -513,692,161.9 22.6 Median age for Asian residents23.4 22.3 -742,816,091.2 Median age for Native Hawaiian / Pacific Islander residents-831,187,409.8 -771,300,447.7 77.0 Median age for Other race residents-643,206,255.5 70.8 35.3 Median age for Two or more races residents16.1 41.6 47.4 Median age for White alone residents45.9 49.4 27.7 Median age for Hispanic or Latino residents23.5 31.0
Owner/renter occupied households by race in Nesconset
House owners and renters - White residents 3,189 86.3% Owner occupied506 13.7% Renter occupiedHouse owners and renters - Black or African American residents 69 100.0% Owner occupiedHouse owners and renters - American Indian / Alaska Native residents 19 100.0% Owner occupiedHouse owners and renters - Asian residents 220 65.6% Owner occupied116 34.4% Renter occupiedHouse owners and renters - Two or more races residents 285 77.3% Owner occupied83 22.7% Renter occupiedHouse owners and renters - White alone residents 3,103 87.9% Owner occupied426 12.1% Renter occupiedHouse owners and renters - Hispanic or Latino residents 324 69.6% Owner occupied141 30.4% Renter occupied
Language usage in Nesconset
English speakers - Total 80.2% of residents of Nesconset speak English at home.
4.5% of residents speak Spanish at home 522 89.1% Speak English very well64 10.9% Speak English less than very well15.2% of residents speak other language at home 1,577 79.2% Speak English very well415 20.8% Speak English less than very well
English speakers - Born in the United States 81.1% of residents of Nesconset speak English at home.
20.3% of residents speak other language at home 145 100.0% Speak English very well
English speakers - Native, born elsewhere 55.6% of residents of Nesconset speak English at home.
43.5% of residents speak Spanish at home 47 100.0% Speak English very well
English speakers - Foreign-born 16.7% of residents of Nesconset speak English at home.
12.0% of residents speak Spanish at home 220 90.2% Speak English very well24 9.8% Speak English less than very well67.9% of residents speak other language at home 962 69.5% Speak English very well423 30.5% Speak English less than very well
White (Caucasian) - Speak only English Native:
96.9% (9,061)Foreign-born:
25.5% (182)
White (Caucasian) - Speak another language Native:
3.6% (341)Foreign-born:
73.2% (524)
Black or African American - Speak only English Native:
97.0% (111)Foreign-born:
30.6% (40)
American Indian / Alaska Native - Speak another language Native:
100.0% (83)Foreign-born:
100.0% (35)
Asian - Speak only English Native:
43.1% (144)Foreign-born:
5.7% (33)
Asian - Speak another language Native:
57.4% (192)Foreign-born:
98.3% (563)
Two or more races - Speak only English Native:
85.9% (772)Foreign-born:
31.2% (63)
Two or more races - Speak another language Native:
14.9% (134)Foreign-born:
66.3% (135)
White alone - Speak only English Native:
96.4% (8,620)Foreign-born:
17.2% (132)
White alone - Speak another language Native:
3.5% (316)Foreign-born:
82.8% (637)
Hispanic or Latino - Speak only English Native:
77.6% (987)Foreign-born:
19.6% (69)
Hispanic or Latino - Speak another language Native:
24.2% (308)Foreign-born:
79.1% (279)
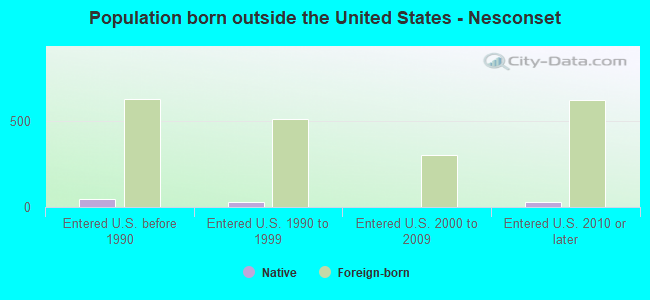
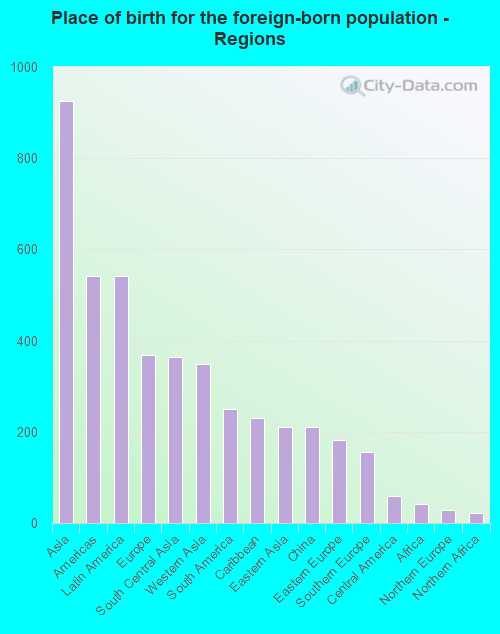
Foreign-born residents in Nesconset 1,879 residents are foreign born (6.9% Asia , 4.0% Latin America , 2.8% Europe ).
This city:
13.9%New York:
22.6%
Marital status for residents in Nesconset Marital status - White (Caucasian) population 15 years and over
Males 35.9% Never married57.9% Now married1.1% Separated1.4% Widowed3.7% DivorcedFemales 25.0% Never married61.2% Now married2.3% Separated6.4% Widowed5.1% DivorcedWomen who gave birth in the past 12 months Now married:
100.0% (14)Unmarried:
0.0% (0)
Women who did not give birth in the past 12 months Now married:
49.9% (1,018)Unmarried:
50.1% (1,023)
Marital status - Black or African American population 15 years and over
Males 57.4% Never married38.0% Now married1.9% Separated0.0% Widowed2.8% DivorcedFemales 0.0% Never married43.8% Now married0.0% Separated50.0% Widowed6.2% DivorcedMarital status - American Indian / Alaska Native population 15 years and over
Males 0.0% Never married50.0% Now married0.0% Separated0.0% Widowed50.0% DivorcedFemales 0.0% Never married50.0% Now married50.0% Separated0.0% Widowed0.0% DivorcedWomen who did not give birth in the past 12 months Now married:
100.0% (24)Unmarried:
0.0% (0)
Marital status - Asian population 15 years and over
Males 49.9% Never married50.1% Now married0.0% Separated0.0% Widowed0.0% DivorcedFemales 61.8% Never married38.2% Now married0.0% Separated0.0% Widowed0.0% DivorcedWomen who did not give birth in the past 12 months Now married:
35.9% (69)Unmarried:
64.1% (123)
Marital status - Other race population 15 years and over
Males 0.0% Never married0.0% Now married0.0% Separated100.0% Widowed0.0% DivorcedFemales 16.7% Never married0.0% Now married0.0% Separated33.3% Widowed50.0% DivorcedWomen who did not give birth in the past 12 months Now married:
0.0% (0)Unmarried:
100.0% (3)
Marital status - Two or more races population 15 years and over
Males 49.8% Never married38.8% Now married0.0% Separated0.0% Widowed11.4% DivorcedFemales 23.6% Never married57.6% Now married0.0% Separated0.0% Widowed18.9% DivorcedWomen who did not give birth in the past 12 months Now married:
41.3% (126)Unmarried:
58.7% (179)
Marital status - White alone, not Hispanic / Latino population 15 years and over
Males 33.0% Never married60.3% Now married1.2% Separated1.6% Widowed4.0% DivorcedFemales 23.7% Never married62.7% Now married0.9% Separated7.3% Widowed5.4% DivorcedWomen who gave birth in the past 12 months Now married:
100.0% (15)Unmarried:
0.0% (0)
Women who did not give birth in the past 12 months Now married:
49.0% (887)Unmarried:
51.0% (924)
Marital status - Hispanic or Latino population 15 years and over
Males 60.8% Never married34.3% Now married0.0% Separated1.2% Widowed3.7% DivorcedFemales 31.3% Never married49.0% Now married11.1% Separated0.5% Widowed8.1% DivorcedWomen who did not give birth in the past 12 months Now married:
50.5% (307)Unmarried:
49.5% (300)
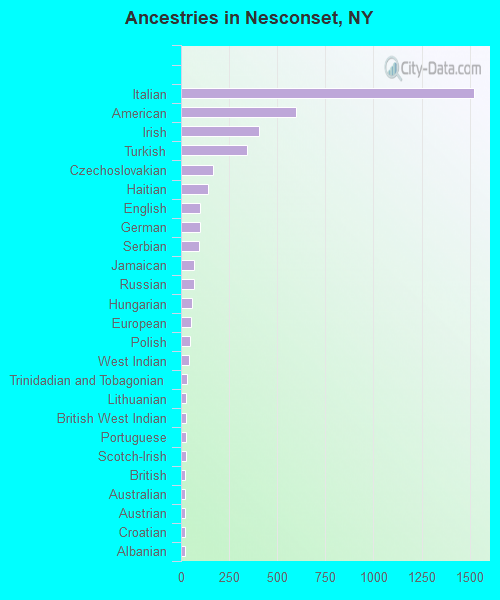
Ancestries in Nesconset
1,524 24.6% Italian598 9.7% American407 6.6% Irish342 5.5% Turkish168 2.7% Czechoslovakian140 2.3% Haitian100 1.6% English98 1.6% German94 1.5% Serbian69 1.1% Jamaican66 1.1% Russian59 1.0% Hungarian51 0.8% European49 0.8% Polish41 0.7% West Indian32 0.5% Trinidadian and Tobagonian26 0.4% Lithuanian26 0.4% British West Indian24 0.4% Portuguese24 0.4% Scotch-Irish23 0.4% British21 0.3% Australian21 0.3% Austrian21 0.3% Croatian19 0.3% Albanian14 0.2% Norwegian13 0.2% Eastern European13 0.2% Romanian13 0.2% Ukrainian12 0.2% French9 0.1% Greek9 0.1% Yugoslavian
Children Nativity (place of birth) in Nesconset
Children under 6 years - Living with two parents Both parents native 353 100.0% NativeChildren under 6 years - Living with one parent Native parent 172 100.0% NativeForeign-born parent 48 100.0% NativeChildren 6 to 17 years - Living with two parents Both parents native 1,002 100.0% Native0 0.0% Foreign-bornBoth parents foreign-born 413 83.6% Native81 16.4% Foreign-bornOne native, one foreign-born parent 53 100.0% NativeChildren 6 to 17 years - Living with one parent Native parent 343 100.0% NativeForeign-born parent 141 51.5% Native133 48.5% Foreign-born
Grandparents responsible for own grandchildren in Nesconset
Grandparents (30 to 59 years) White / Caucasian 32 100.0% Not responsible for grandchildrenWhite alone, not Hispanic / Latino 36 100.0% Not responsible for grandchildrenGrandparents (60 years and over) White / Caucasian 10 6.5% Responsible for grandchildren141 93.5% Not responsible for grandchildrenWhite alone, not Hispanic / Latino 12 10.9% Responsible for grandchildren96 89.1% Not responsible for grandchildren