Races in Nether Providence Township, Pennsylvania (PA) Detailed Stats
Ancestries, Foreign-born residents, place of birth

Recent posts about races in Nether Providence Township, Pennsylvania on our local forum with over 2,400,000 registered users:
 | Would Wallingford be a bad fit for me? (9 replies) |
| Moving to PA w/in 11 Months (15 replies) |
| House hunting now-- am I the only one who thinks these property taxes are ridiculous! (27 replies) |
| Where to live in southeast Pennsylvania suburbs? (11 replies) |
| Rich White People Self-Segregate More in Philly ’Burbs Than Most Anywhere Else (87 replies) |
| South Media area (14 replies) |
6.8% of Nether Providence Township, PA residents are foreign-born (2.9% born in Europe, 2.3% born in Asia, 0.8% born in Latin America), which is 2.7% less than the foreign-born rate of 7.0% across the entire state of Pennsylvania.
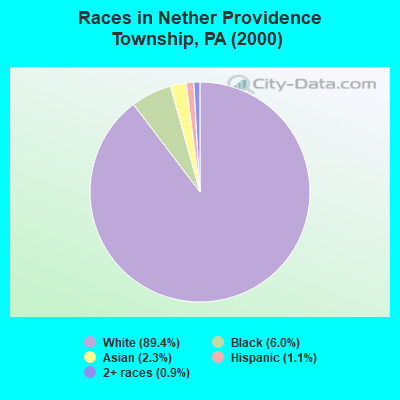
Race distribution in Nether Providence Township

- 12,02889.4%White alone
- 8116.0%Black alone
- 3152.3%Asian alone
- 1521.1%Hispanic
- 1270.9%Two or more races
- 100.07%American Indian alone
- 80.06%Other race alone
- 50.04%Native Hawaiian and Other
Pacific Islander alone
2000
2022
-
- 10,322,45584.1%White alone
- 1,202,4379.8%Black alone
- 394,0883.2%Hispanic
- 218,2961.8%Asian alone
- 113,0970.9%Two or more races
- 13,0860.1%Other race alone
- 14,9040.1%American Indian alone
- 2,6910.02%Native Hawaiian and Other
Pacific Islander alone

-
- 9,487,22873.1%White alone
- 1,311,58110.1%Black alone
- 1,115,9978.6%Hispanic
- 493,9423.8%Two or more races
- 487,1243.8%Asian alone
- 63,5820.5%Other race alone
- 10,1300.08%American Indian alone
- 2,4240.02%Native Hawaiian and Other
Pacific Islander alone

Income and house value in Nether Providence Township
- Median household income in 2022
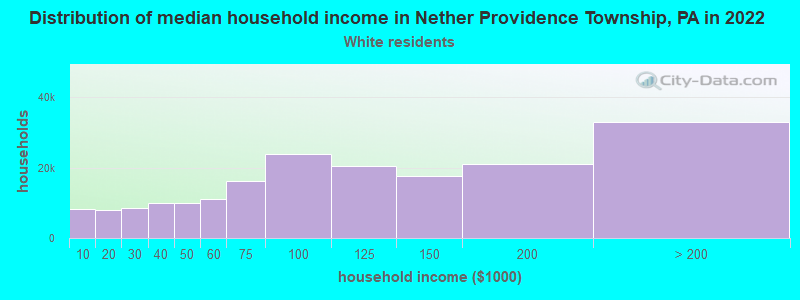
- $124,616White non-Hispanic householders
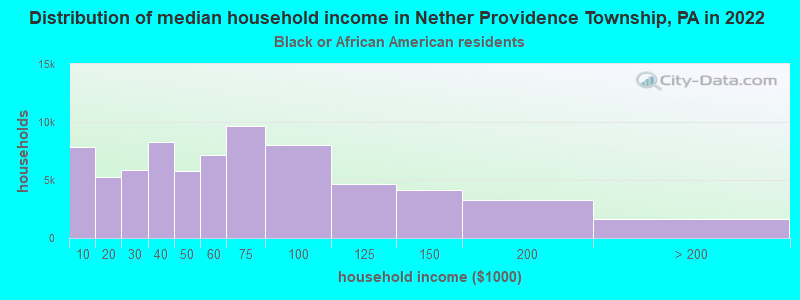
- $80,892Black householders
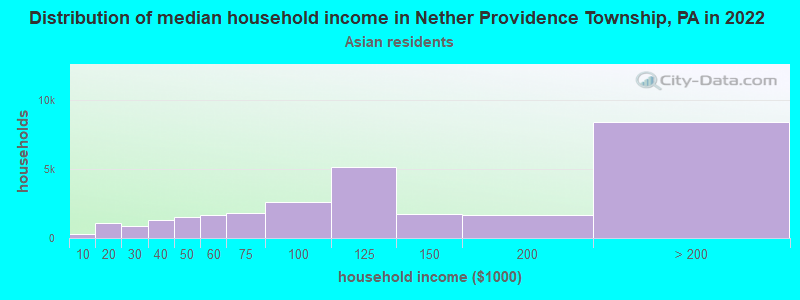
- over $200,000Asian householders
- over $200,000Some other race householders
- $101,138Two or more races householders
- $193,090Hispanic or Latino race householders
- Median 2022 house value
- $461,851White Non-Hispanic householders
- $234,535Black or African American householders
- $448,157Asian householders
- $835,813Some other race householders
- $423,259Two or more races householders
- $490,981Hispanic or Latino householders
Household income for White non-Hispanic householders
Household income for Black householders
Household income for Asian householders
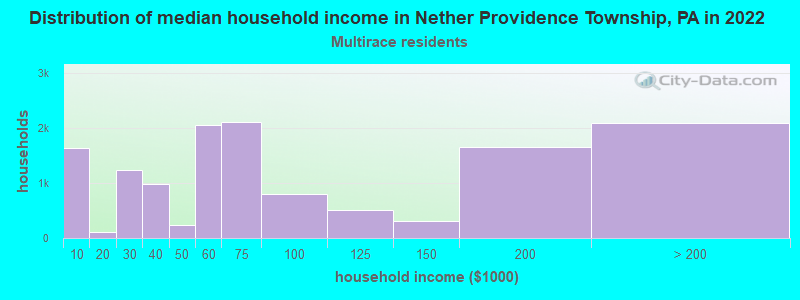
Household income for Two or more races householders
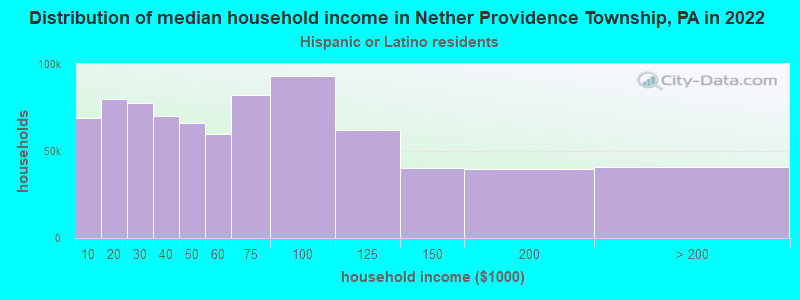
Household income for Hispanic or Latino race householders
Foreign-born residents in Nether Providence Township
917 residents are foreign born (2.9% Europe, 2.3% Asia, 0.8% Latin America).
| This city: | 6.8% |
| Pennsylvania: | 4.1% |
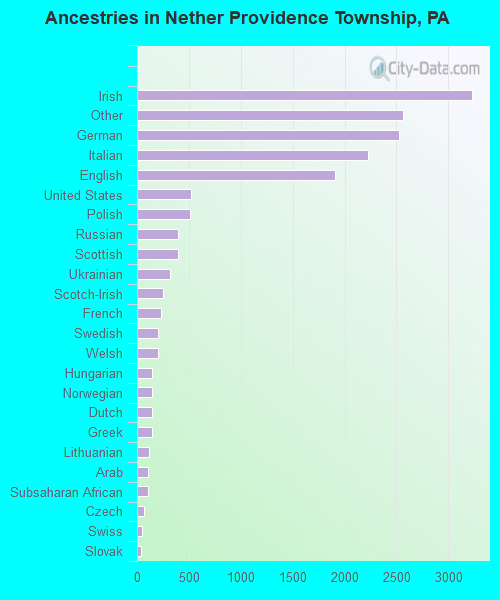
Ancestries in Nether Providence Township

- 3,23119.4%Irish
- 2,56415.4%Other
- 2,52515.2%German
- 2,22813.4%Italian
- 1,90811.5%English
- 5213.1%United States
- 5133.1%Polish
- 3942.4%Russian
- 3932.4%Scottish
- 3191.9%Ukrainian
- 2471.5%Scotch-Irish
- 2281.4%French
- 2061.2%Swedish
- 2011.2%Welsh
- 1490.9%Hungarian
- 1460.9%Norwegian
- 1450.9%Dutch
- 1410.8%Greek
- 1200.7%Lithuanian
- 1070.6%Arab
- 1060.6%Subsaharan African
- 680.4%Czech
- 440.3%Swiss
- 370.2%Slovak
- 280.2%West Indian
- 250.2%French Canadian
- 120.07%Danish
- 70.04%Portuguese
Zip codes: 19086.