Races in New Baltimore, Michigan (MI) Detailed Stats
Data:
Races - White alone (%)
Races - White alone (% change since 2000)
Races - Black alone (%)
Races - Black alone (% change since 2000)
Races - American Indian alone (%)
Races - American Indian alone (% change since 2000)
Races - Asian alone (%)
Races - Asian alone (% change since 2000)
Races - Hispanic (%)
Races - Hispanic (% change since 2000)
Races - Native Hawaiian and Other Pacific Islander alone (%)
Races - Native Hawaiian and Other Pacific Islander alone (% change since 2000)
Races - Two or more races(%)
Races - Two or more races(% change since 2000)
Races - Other race alone (%)
Races - Other race alone (% change since 2000)
Racial diversity
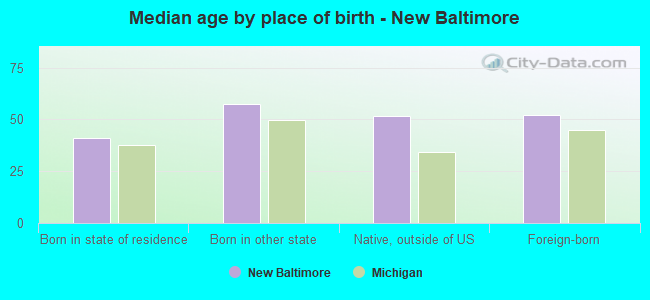
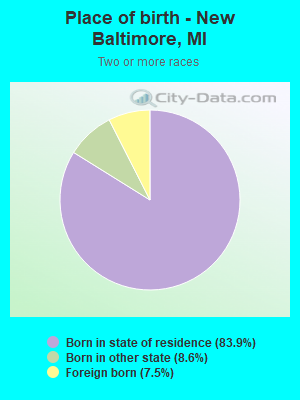
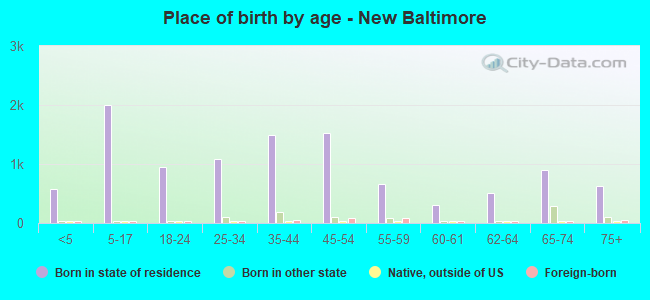
Place of birth - Born in state of residence (%)
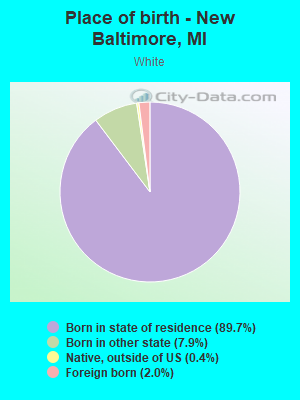
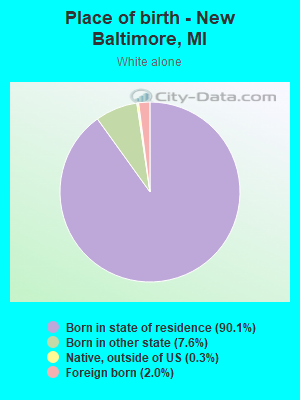
Place of birth - Born in state of residence (%) - White
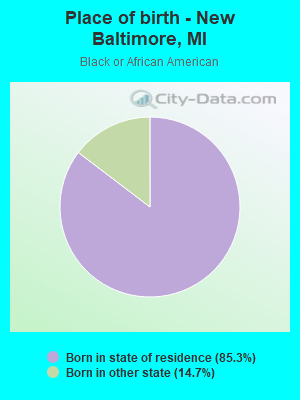
Place of birth - Born in state of residence (%) - Black or African American
Place of birth - Born in state of residence (%) - Asian
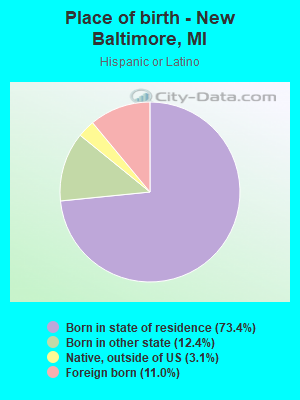
Place of birth - Born in state of residence (%) - Hispanic or Latino
Place of birth - Born in state of residence (%) - American Indian and Alaska Native
Place of birth - Born in state of residence (%) - Multirace
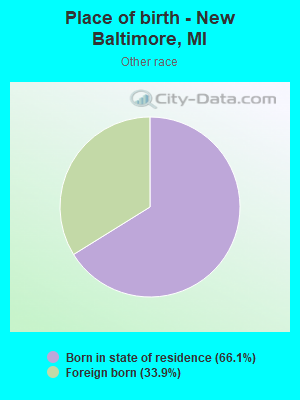
Place of birth - Born in state of residence (%) - Other Race
Place of birth - Born in other state (%)
Place of birth - Born in other state (%) - White
Place of birth - Born in other state (%) - Black or African American
Place of birth - Born in other state (%) - Asian
Place of birth - Born in other state (%) - Hispanic or Latino
Place of birth - Born in other state (%) - American Indian and Alaska Native
Place of birth - Born in other state (%) - Multirace
Place of birth - Born in other state (%) - Other Race
Place of birth - Native, outside of US (%)
Place of birth - Native, outside of US (%) - White
Place of birth - Native, outside of US (%) - Black or African American
Place of birth - Native, outside of US (%) - Asian
Place of birth - Native, outside of US (%) - Hispanic or Latino
Place of birth - Native, outside of US (%) - American Indian and Alaska Native
Place of birth - Native, outside of US (%) - Multirace
Place of birth - Native, outside of US (%) - Other Race
Place of birth - Foreign born (%)
Place of birth - Foreign born (%) - White
Place of birth - Foreign born (%) - Black or African American
Place of birth - Foreign born (%) - Asian
Place of birth - Foreign born (%) - Hispanic or Latino
Place of birth - Foreign born (%) - American Indian and Alaska Native
Place of birth - Foreign born (%) - Multirace
Place of birth - Foreign born (%) - Other Race
Residents speaking English at home (%)
Residents speaking English at home - Born in the United States (%)
Residents speaking English at home - Native, born elsewhere (%)
Residents speaking English at home - Foreign born (%)
Residents speaking Spanish at home (%)
Residents speaking Spanish at home - Born in the United States (%)
Residents speaking Spanish at home - Native, born elsewhere (%)
Residents speaking Spanish at home - Foreign born (%)
Residents speaking other language at home (%)
Residents speaking other language at home - Born in the United States (%)
Residents speaking other language at home - Native, born elsewhere (%)
Residents speaking other language at home - Foreign born (%)
Marital status - Never married (%)
Marital status - Now married (%)
Marital status - Separated (%)
Marital status - Widowed (%)
Marital status - Divorced (%)
Ancestries Reported - Arab (%)
Ancestries Reported - Czech (%)
Ancestries Reported - Danish (%)
Ancestries Reported - Dutch (%)
Ancestries Reported - English (%)
Ancestries Reported - French (%)
Ancestries Reported - French Canadian (%)
Ancestries Reported - German (%)
Ancestries Reported - Greek (%)
Ancestries Reported - Hungarian (%)
Ancestries Reported - Irish (%)
Ancestries Reported - Italian (%)
Ancestries Reported - Lithuanian (%)
Ancestries Reported - Norwegian (%)
Ancestries Reported - Polish (%)
Ancestries Reported - Portuguese (%)
Ancestries Reported - Russian (%)
Ancestries Reported - Scotch-Irish (%)
Ancestries Reported - Scottish (%)
Ancestries Reported - Slovak (%)
Ancestries Reported - Subsaharan African (%)
Ancestries Reported - Swedish (%)
Ancestries Reported - Swiss (%)
Ancestries Reported - Ukrainian (%)
Ancestries Reported - United States (%)
Ancestries Reported - Welsh (%)
Ancestries Reported - West Indian (%)
Ancestries Reported - Other (%)
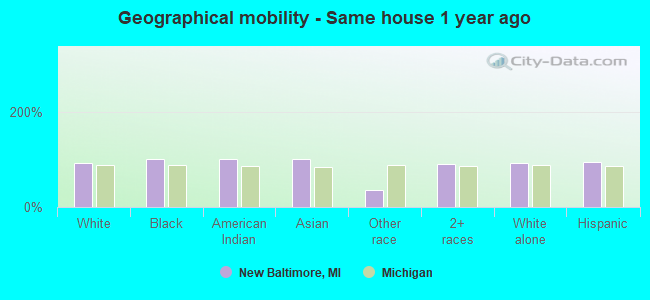
Geographical mobility - Same house 1 year ago (%)
Geographical mobility - Same house 1 year ago (%) - White
Geographical mobility - Same house 1 year ago (%) - Black or African American
Geographical mobility - Same house 1 year ago (%) - Asian
Geographical mobility - Same house 1 year ago (%) - Hispanic or Latino
Geographical mobility - Same house 1 year ago (%) - American Indian and Alaska Native
Geographical mobility - Same house 1 year ago (%) - Multirace
Geographical mobility - Same house 1 year ago (%) - Other Race
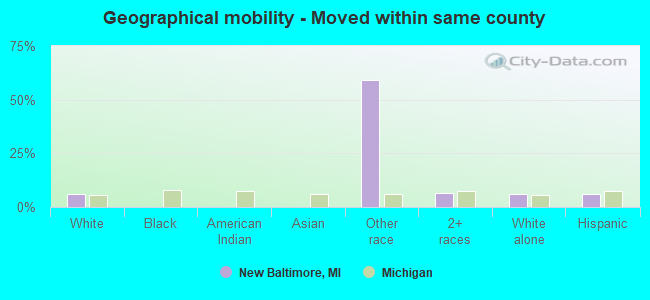
Geographical mobility - Moved within same county (%)
Geographical mobility - Moved within same county (%) - White
Geographical mobility - Moved within same county (%) - Black or African American
Geographical mobility - Moved within same county (%) - Asian
Geographical mobility - Moved within same county (%) - Hispanic or Latino
Geographical mobility - Moved within same county (%) - American Indian and Alaska Native
Geographical mobility - Moved within same county (%) - Multirace
Geographical mobility - Moved within same county (%) - Other Race
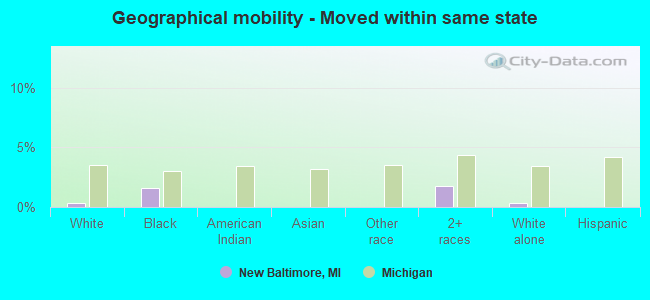
Geographical mobility - Moved from different county within same state (%)
Geographical mobility - Moved from different county within same state (%) - White
Geographical mobility - Moved from different county within same state (%) - Black or African American
Geographical mobility - Moved from different county within same state (%) - Asian
Geographical mobility - Moved from different county within same state (%) - Hispanic or Latino
Geographical mobility - Moved from different county within same state (%) - American Indian and Alaska Native
Geographical mobility - Moved from different county within same state (%) - Multirace
Geographical mobility - Moved from different county within same state (%) - Other Race
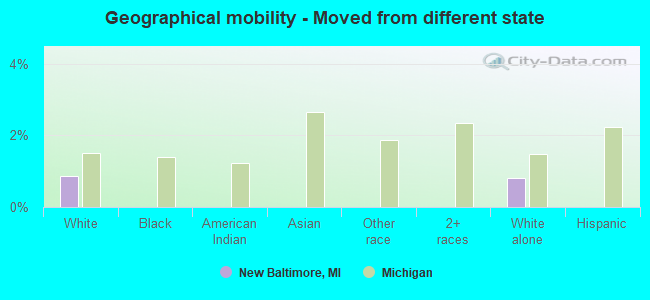
Geographical mobility - Moved from different state (%)
Geographical mobility - Moved from different state (%) - White
Geographical mobility - Moved from different state (%) - Black or African American
Geographical mobility - Moved from different state (%) - Asian
Geographical mobility - Moved from different state (%) - Hispanic or Latino
Geographical mobility - Moved from different state (%) - American Indian and Alaska Native
Geographical mobility - Moved from different state (%) - Multirace
Geographical mobility - Moved from different state (%) - Other Race
Geographical mobility - Moved from abroad (%)
Geographical mobility - Moved from abroad (%) - White
Geographical mobility - Moved from abroad (%) - Black or African American
Geographical mobility - Moved from abroad (%) - Asian
Geographical mobility - Moved from abroad (%) - Hispanic or Latino
Geographical mobility - Moved from abroad (%) - American Indian and Alaska Native
Geographical mobility - Moved from abroad (%) - Multirace
Geographical mobility - Moved from abroad (%) - Other Race
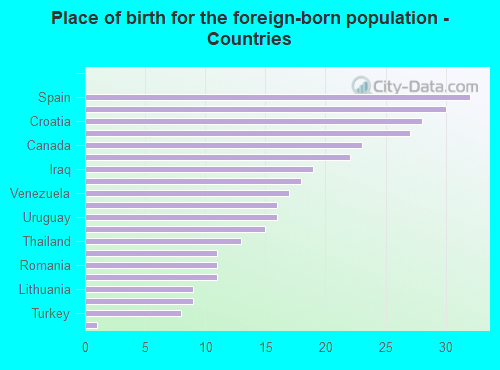
Place of birth for the foreign-born population - Ireland (%)
Place of birth for the foreign-born population - Denmark (%)
Place of birth for the foreign-born population - Norway (%)
Place of birth for the foreign-born population - Sweden (%)
Place of birth for the foreign-born population - United Kingdom (%)
Place of birth for the foreign-born population - England (%)
Place of birth for the foreign-born population - Scotland (%)
Place of birth for the foreign-born population - Other Northern Europe (%)
Place of birth for the foreign-born population - Austria (%)
Place of birth for the foreign-born population - Belgium (%)
Place of birth for the foreign-born population - France (%)
Place of birth for the foreign-born population - Germany (%)
Place of birth for the foreign-born population - Netherlands (%)
Place of birth for the foreign-born population - Switzerland (%)
Place of birth for the foreign-born population - Other Western Europe (%)
Place of birth for the foreign-born population - Greece (%)
Place of birth for the foreign-born population - Italy (%)
Place of birth for the foreign-born population - Portugal (%)
Place of birth for the foreign-born population - Spain (%)
Place of birth for the foreign-born population - Other Southern Europe (%)
Place of birth for the foreign-born population - Albania (%)
Place of birth for the foreign-born population - Belarus (%)
Place of birth for the foreign-born population - Bosnia and Herzegovina (%)
Place of birth for the foreign-born population - Bulgaria (%)
Place of birth for the foreign-born population - Croatia (%)
Place of birth for the foreign-born population - Czechoslovakia (%)
Place of birth for the foreign-born population - Hungary (%)
Place of birth for the foreign-born population - Latvia (%)
Place of birth for the foreign-born population - Lithuania (%)
Place of birth for the foreign-born population - North Macedonia (Macedonia) (%)
Place of birth for the foreign-born population - Moldova (%)
Place of birth for the foreign-born population - Poland (%)
Place of birth for the foreign-born population - Romania (%)
Place of birth for the foreign-born population - Russia (%)
Place of birth for the foreign-born population - Serbia (%)
Place of birth for the foreign-born population - Ukraine (%)
Place of birth for the foreign-born population - Other Eastern Europe (%)
Place of birth for the foreign-born population - China (%)
Place of birth for the foreign-born population - Hong Kong (%)
Place of birth for the foreign-born population - Taiwan (%)
Place of birth for the foreign-born population - Japan (%)
Place of birth for the foreign-born population - Korea (%)
Place of birth for the foreign-born population - Other Eastern Asia (%)
Place of birth for the foreign-born population - Afghanistan (%)
Place of birth for the foreign-born population - Bangladesh (%)
Place of birth for the foreign-born population - India (%)
Place of birth for the foreign-born population - Iran (%)
Place of birth for the foreign-born population - Kazakhstan (%)
Place of birth for the foreign-born population - Nepal (%)
Place of birth for the foreign-born population - Pakistan (%)
Place of birth for the foreign-born population - Sri Lanka (%)
Place of birth for the foreign-born population - Uzbekistan (%)
Place of birth for the foreign-born population - Other South Central Asia (%)
Place of birth for the foreign-born population - Burma (%)
Place of birth for the foreign-born population - Cambodia (%)
Place of birth for the foreign-born population - Indonesia (%)
Place of birth for the foreign-born population - Laos (%)
Place of birth for the foreign-born population - Malaysia (%)
Place of birth for the foreign-born population - Philippines (%)
Place of birth for the foreign-born population - Singapore (%)
Place of birth for the foreign-born population - Thailand (%)
Place of birth for the foreign-born population - Vietnam (%)
Place of birth for the foreign-born population - Other South Eastern Asia (%)
Place of birth for the foreign-born population - Armenia (%)
Place of birth for the foreign-born population - Iraq (%)
Place of birth for the foreign-born population - Israel (%)
Place of birth for the foreign-born population - Jordan (%)
Place of birth for the foreign-born population - Kuwait (%)
Place of birth for the foreign-born population - Lebanon (%)
Place of birth for the foreign-born population - Saudi Arabia (%)
Place of birth for the foreign-born population - Syria (%)
Place of birth for the foreign-born population - Turkey (%)
Place of birth for the foreign-born population - Yemen (%)
Place of birth for the foreign-born population - Other Western Asia (%)
Place of birth for the foreign-born population - Eritrea (%)
Place of birth for the foreign-born population - Ethiopia (%)
Place of birth for the foreign-born population - Kenya (%)
Place of birth for the foreign-born population - Somalia (%)
Place of birth for the foreign-born population - Uganda (%)
Place of birth for the foreign-born population - Zimbabwe (%)
Place of birth for the foreign-born population - Other Eastern Africa (%)
Place of birth for the foreign-born population - Cameroon (%)
Place of birth for the foreign-born population - Congo (%)
Place of birth for the foreign-born population - Democratic Republic of Congo (Zaire) (%)
Place of birth for the foreign-born population - Other Middle Africa (%)
Place of birth for the foreign-born population - Egypt (%)
Place of birth for the foreign-born population - Morocco (%)
Place of birth for the foreign-born population - Sudan (%)
Place of birth for the foreign-born population - Other Northern Africa (%)
Place of birth for the foreign-born population - South Africa (%)
Place of birth for the foreign-born population - Other Southern Africa (%)
Place of birth for the foreign-born population - Cabo Verde (%)
Place of birth for the foreign-born population - Ghana (%)
Place of birth for the foreign-born population - Liberia (%)
Place of birth for the foreign-born population - Nigeria (%)
Place of birth for the foreign-born population - Senegal (%)
Place of birth for the foreign-born population - Sierra Leone (%)
Place of birth for the foreign-born population - Other Western Africa (%)
Place of birth for the foreign-born population - Australia (%)
Place of birth for the foreign-born population - New Zealand (%)
Place of birth for the foreign-born population - Fiji (%)
Place of birth for the foreign-born population - Micronesia (%)
Place of birth for the foreign-born population - Bahamas (%)
Place of birth for the foreign-born population - Barbados (%)
Place of birth for the foreign-born population - Cuba (%)
Place of birth for the foreign-born population - Dominica (%)
Place of birth for the foreign-born population - Dominican Republic (%)
Place of birth for the foreign-born population - Grenada (%)
Place of birth for the foreign-born population - Haiti (%)
Place of birth for the foreign-born population - Jamaica (%)
Place of birth for the foreign-born population - St. Vincent and the Grenadines (%)
Place of birth for the foreign-born population - Trinidad and Tobago (%)
Place of birth for the foreign-born population - West Indies (%)
Place of birth for the foreign-born population - Other Caribbean (%)
Place of birth for the foreign-born population - Belize (%)
Place of birth for the foreign-born population - Costa Rica (%)
Place of birth for the foreign-born population - El Salvador (%)
Place of birth for the foreign-born population - Guatemala (%)
Place of birth for the foreign-born population - Honduras (%)
Place of birth for the foreign-born population - Mexico (%)
Place of birth for the foreign-born population - Nicaragua (%)
Place of birth for the foreign-born population - Panama (%)
Place of birth for the foreign-born population - Other Central America (%)
Place of birth for the foreign-born population - Argentina (%)
Place of birth for the foreign-born population - Bolivia (%)
Place of birth for the foreign-born population - Brazil (%)
Place of birth for the foreign-born population - Chile (%)
Place of birth for the foreign-born population - Colombia (%)
Place of birth for the foreign-born population - Ecuador (%)
Place of birth for the foreign-born population - Guyana (%)
Place of birth for the foreign-born population - Peru (%)
Place of birth for the foreign-born population - Uruguay (%)
Place of birth for the foreign-born population - Venezuela (%)
Place of birth for the foreign-born population - Other South America (%)
Place of birth for the foreign-born population - Canada (%)
Place of birth for the foreign-born population - Other Northern America (%)
Place of birth for the foreign-born population - Other (%)
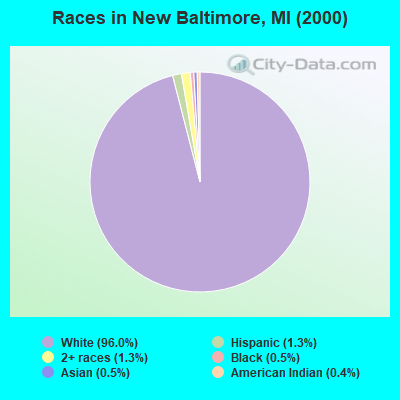
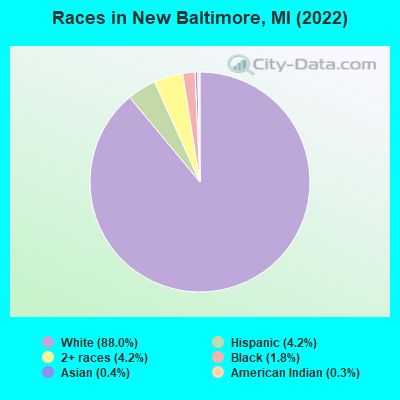
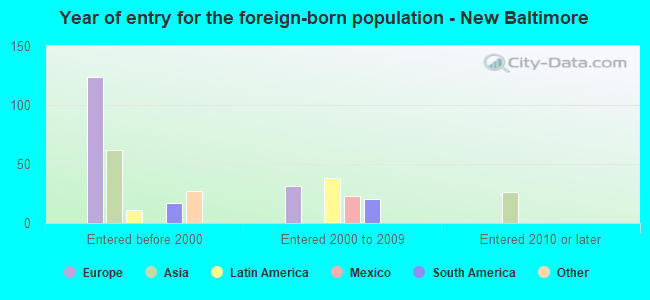
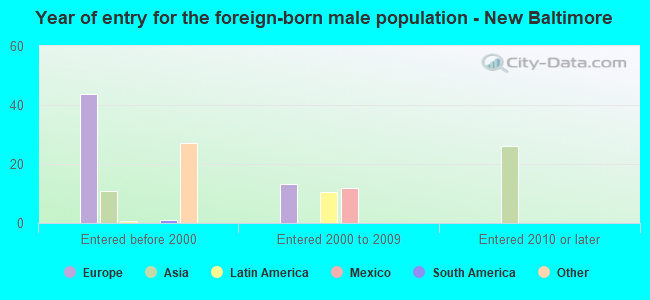
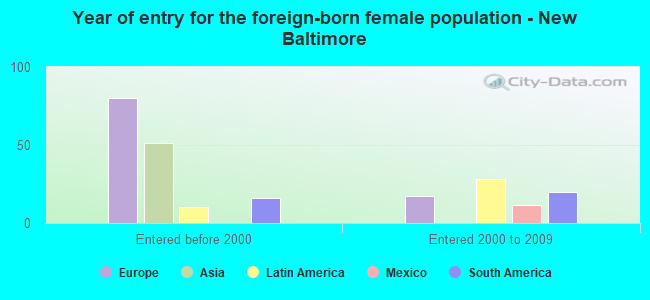
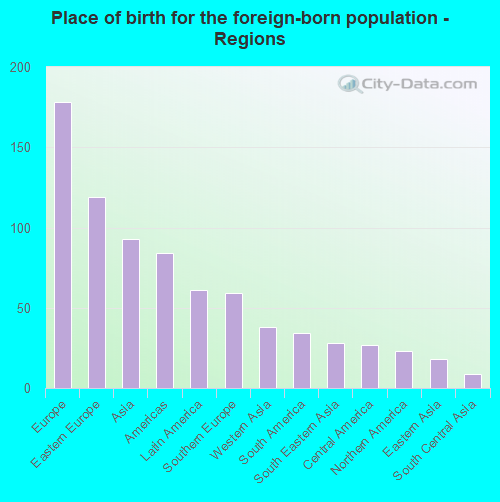
According to 2022 data, the most numerous races in New Baltimore, MI are White alone (10,595 residents), Black alone (215 residents), and Hispanic (511 residents). 96.5% of New Baltimore residents speak English at home. 2.9% of New Baltimore, MI residents are foreign-born (1.5% born in Europe, 0.8% born in Asia, 0.5% born in Latin America), which is 103.6% less than the foreign-born rate of 6.0% across the entire state of Michigan.
Race distribution in New Baltimore
2000 2022
7,806,691 78.6% White alone 1,402,047 14.1% Black alone 323,877 3.3% Hispanic 175,311 1.8% Asian alone 163,487 1.6% Two or more races 53,421 0.5% American Indian alone 11,465 0.1% Other race alone 2,145 0.02% Native Hawaiian and Other
7,289,051 72.6% White alone 1,310,464 13.1% Black alone 572,405 5.7% Hispanic 450,031 4.5% Two or more races 335,732 3.3% Asian alone 45,217 0.5% Other race alone 29,011 0.3% American Indian alone 2,207 0.02% Native Hawaiian and Other
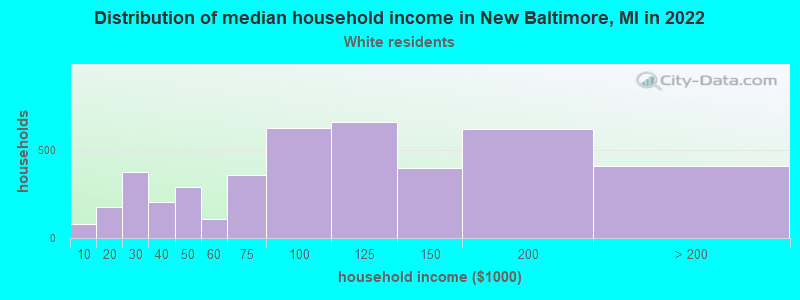
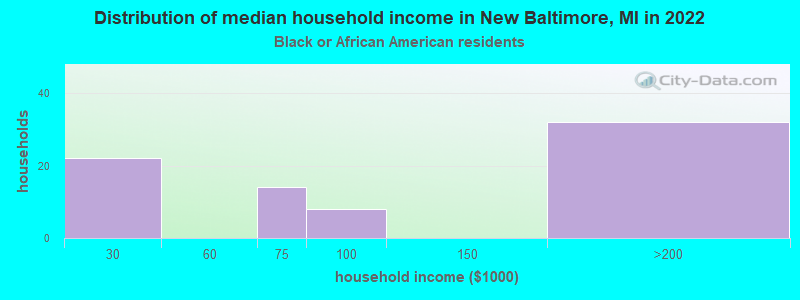
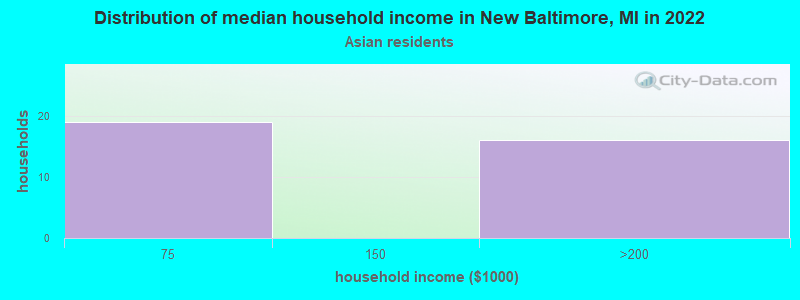
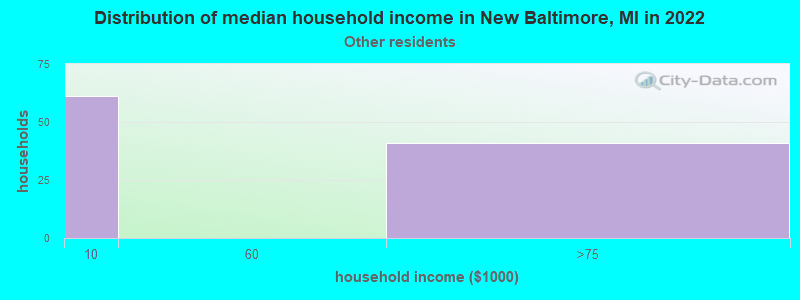
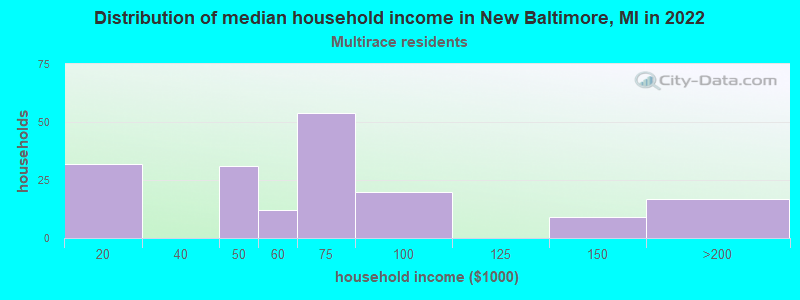
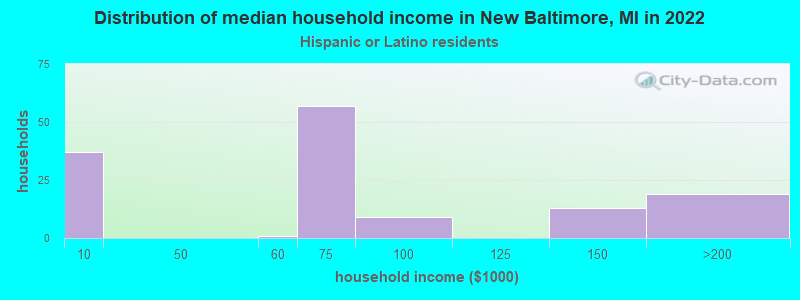
Income and house value in New Baltimore Median household income in 2022 $94,617 White non-Hispanic householders$60,655 Two or more races householders$68,276 Hispanic or Latino race householdersMedian 2022 house value $318,912 White Non-Hispanic householders$435,672 Some other race householders$435,672 Two or more races householders$338,856 Hispanic or Latino householders
Median age by race in New Baltimore
43.5 Median age for White residents42.3 46.3 26.2 Median age for Black or African American residents35.8 24.3 55.1 Median age for American Indian / Alaska Native residents-553,963,705.3 -906,367,040.3 56.8 Median age for Asian residents-683,127,571.3 56.3 -670,531,400.3 Median age for Native Hawaiian / Pacific Islander residents-674,772,035.8 -699,588,476.7 -674,796,747.3 Median age for Other race residents-672,690,762.4 -670,731,706.6 21.3 Median age for Two or more races residents17.2 20.6 43.8 Median age for White alone residents42.2 46.9 19.7 Median age for Hispanic or Latino residents17.4 20.8
Owner/renter occupied households by race in New Baltimore
House owners and renters - White residents 3,560 81.9% Owner occupied786 18.1% Renter occupiedHouse owners and renters - Black or African American residents 56 64.7% Owner occupied31 35.3% Renter occupiedHouse owners and renters - Asian residents 38 100.0% Owner occupiedHouse owners and renters - Other race residents 29 36.9% Owner occupied50 63.1% Renter occupiedHouse owners and renters - Two or more races residents 119 72.7% Owner occupied44 27.3% Renter occupiedHouse owners and renters - White alone residents 3,543 82.2% Owner occupied768 17.8% Renter occupiedHouse owners and renters - Hispanic or Latino residents 92 62.7% Owner occupied55 37.3% Renter occupied
Language usage in New Baltimore
English speakers - Total 96.5% of residents of New Baltimore speak English at home.
0.9% of residents speak Spanish at home 57 53.3% Speak English very well50 46.7% Speak English less than very well2.3% of residents speak other language at home 228 86.7% Speak English very well35 13.3% Speak English less than very well
English speakers - Born in the United States 97.1% of residents of New Baltimore speak English at home.
2.7% of residents speak other language at home 26 100.0% Speak English very well
All residents speak only English at home
English speakers - Foreign-born 30.7% of residents of New Baltimore speak English at home.
17.5% of residents speak Spanish at home 26 42.6% Speak English very well35 57.4% Speak English less than very well47.1% of residents speak other language at home 128 78.0% Speak English very well36 22.0% Speak English less than very well
White (Caucasian) - Speak only English Native:
98.9% (9,905)Foreign-born:
33.4% (70)
White (Caucasian) - Speak another language Native:
1.1% (106)Foreign-born:
65.8% (138)
Two or more races - Speak another language Native:
4.3% (34)Foreign-born:
100.0% (67)
White alone - Speak only English Native:
98.7% (9,798)Foreign-born:
33.2% (71)
White alone - Speak another language Native:
1.1% (112)Foreign-born:
65.9% (141)
Hispanic or Latino - Speak another language Native:
5.1% (22)Foreign-born:
100.0% (57)
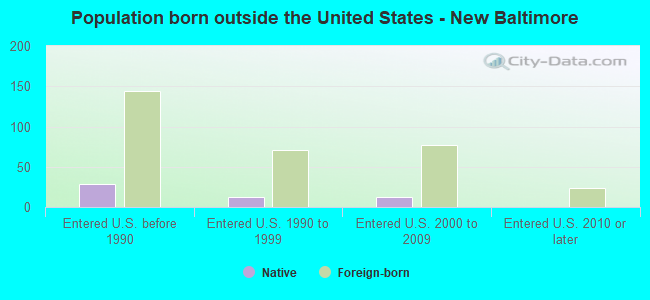
Foreign-born residents in New Baltimore 355 residents are foreign born (1.5% Europe , 0.8% Asia , 0.5% Latin America ).
This city:
2.9%Michigan:
6.9%
Marital status for residents in New Baltimore Marital status - White (Caucasian) population 15 years and over
Males 28.8% Never married61.2% Now married0.0% Separated2.6% Widowed7.4% DivorcedFemales 24.2% Never married53.0% Now married1.9% Separated8.9% Widowed12.0% DivorcedWomen who gave birth in the past 12 months Now married:
100.0% (137)Unmarried:
0.0% (0)
Women who did not give birth in the past 12 months Now married:
49.5% (1,101)Unmarried:
50.5% (1,123)
Marital status - Black or African American population 15 years and over
Males 52.0% Never married48.0% Now married0.0% Separated0.0% Widowed0.0% DivorcedFemales 89.9% Never married0.0% Now married0.0% Separated0.0% Widowed10.1% DivorcedWomen who did not give birth in the past 12 months Now married:
0.0% (0)Unmarried:
100.0% (37)
Marital status - Two or more races population 15 years and over
Males 74.1% Never married25.9% Now married0.0% Separated0.0% Widowed0.0% DivorcedFemales 49.2% Never married34.3% Now married0.0% Separated13.1% Widowed3.4% DivorcedWomen who did not give birth in the past 12 months Now married:
23.7% (66)Unmarried:
76.3% (212)
Marital status - White alone, not Hispanic / Latino population 15 years and over
Males 29.1% Never married60.9% Now married0.0% Separated2.6% Widowed7.4% DivorcedFemales 23.9% Never married52.9% Now married2.0% Separated9.0% Widowed12.2% DivorcedWomen who gave birth in the past 12 months Now married:
100.0% (130)Unmarried:
0.0% (0)
Women who did not give birth in the past 12 months Now married:
49.5% (1,077)Unmarried:
50.5% (1,098)
Marital status - Hispanic or Latino population 15 years and over
Males 25.9% Never married48.3% Now married0.0% Separated0.0% Widowed25.9% DivorcedFemales 42.4% Never married41.9% Now married0.0% Separated15.8% Widowed0.0% DivorcedWomen who gave birth in the past 12 months Now married:
100.0% (9)Unmarried:
0.0% (0)
Women who did not give birth in the past 12 months Now married:
31.7% (43)Unmarried:
68.3% (93)
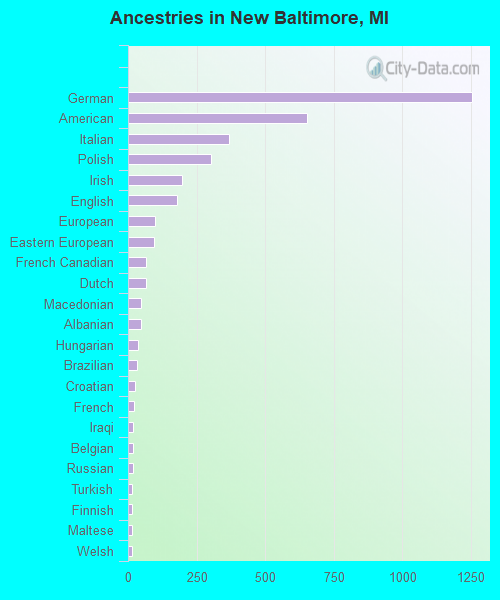
Ancestries in New Baltimore
1,253 28.7% German651 14.9% American368 8.4% Italian301 6.9% Polish197 4.5% Irish180 4.1% English100 2.3% European93 2.1% Eastern European65 1.5% French Canadian65 1.5% Dutch49 1.1% Macedonian46 1.1% Albanian38 0.9% Hungarian32 0.7% Brazilian25 0.6% Croatian22 0.5% French18 0.4% Iraqi17 0.4% Belgian17 0.4% Russian16 0.4% Turkish15 0.3% Finnish15 0.3% Maltese13 0.3% Welsh11 0.3% Lebanese10 0.2% Iranian9 0.2% Canadian9 0.2% Swedish8 0.2% Czech8 0.2% Lithuanian8 0.2% Scottish7 0.2% Celtic7 0.2% Armenian7 0.2% Romanian
Children Nativity (place of birth) in New Baltimore
Children under 6 years - Living with two parents Both parents native 634 100.0% NativeOne native, one foreign-born parent 60 100.0% NativeChildren under 6 years - Living with one parent Native parent 39 100.0% Native
Children 6 to 17 years - Living with two parents Both parents native 1,481 100.0% NativeBoth parents foreign-born 50 100.0% NativeOne native, one foreign-born parent 37 100.0% NativeChildren 6 to 17 years - Living with one parent Native parent 229 100.0% Native
Grandparents responsible for own grandchildren in New Baltimore
Grandparents (30 to 59 years) White / Caucasian 6 100.0% Not responsible for grandchildrenWhite alone, not Hispanic / Latino 7 100.0% Not responsible for grandchildren
Grandparents (60 years and over) White / Caucasian 107 100.0% Not responsible for grandchildrenWhite alone, not Hispanic / Latino 109 100.0% Not responsible for grandchildren