Races in New Braunfels, Texas (TX) Detailed Stats
Data:
Races - White alone (%)
Races - White alone (% change since 2000)
Races - Black alone (%)
Races - Black alone (% change since 2000)
Races - American Indian alone (%)
Races - American Indian alone (% change since 2000)
Races - Asian alone (%)
Races - Asian alone (% change since 2000)
Races - Hispanic (%)
Races - Hispanic (% change since 2000)
Races - Native Hawaiian and Other Pacific Islander alone (%)
Races - Native Hawaiian and Other Pacific Islander alone (% change since 2000)
Races - Two or more races(%)
Races - Two or more races(% change since 2000)
Races - Other race alone (%)
Races - Other race alone (% change since 2000)
Racial diversity
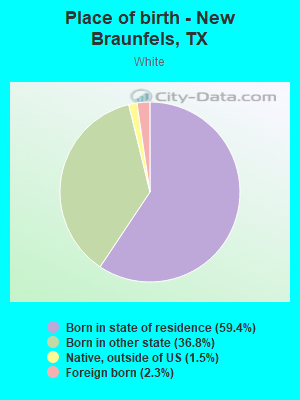
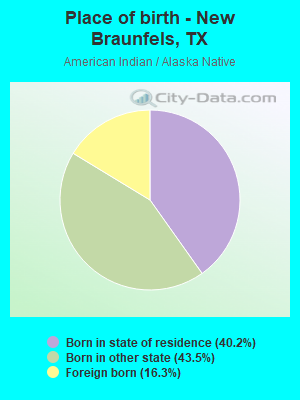
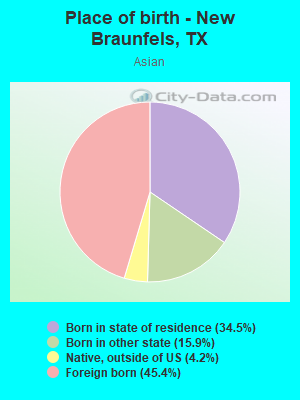
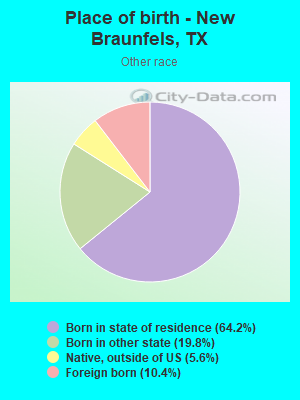
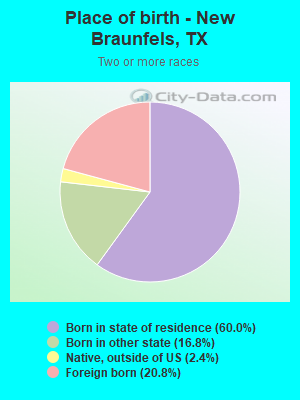
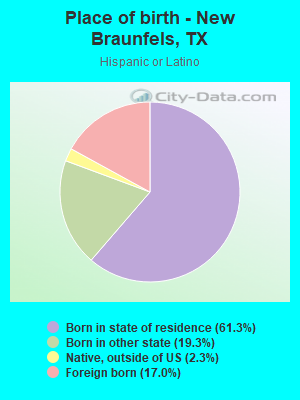
Place of birth - Born in state of residence (%)
Place of birth - Born in state of residence (%) - White
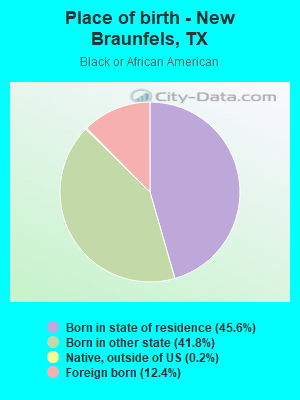
Place of birth - Born in state of residence (%) - Black or African American
Place of birth - Born in state of residence (%) - Asian
Place of birth - Born in state of residence (%) - Hispanic or Latino
Place of birth - Born in state of residence (%) - American Indian and Alaska Native
Place of birth - Born in state of residence (%) - Multirace
Place of birth - Born in state of residence (%) - Other Race
Place of birth - Born in other state (%)
Place of birth - Born in other state (%) - White
Place of birth - Born in other state (%) - Black or African American
Place of birth - Born in other state (%) - Asian
Place of birth - Born in other state (%) - Hispanic or Latino
Place of birth - Born in other state (%) - American Indian and Alaska Native
Place of birth - Born in other state (%) - Multirace
Place of birth - Born in other state (%) - Other Race
Place of birth - Native, outside of US (%)
Place of birth - Native, outside of US (%) - White
Place of birth - Native, outside of US (%) - Black or African American
Place of birth - Native, outside of US (%) - Asian
Place of birth - Native, outside of US (%) - Hispanic or Latino
Place of birth - Native, outside of US (%) - American Indian and Alaska Native
Place of birth - Native, outside of US (%) - Multirace
Place of birth - Native, outside of US (%) - Other Race
Place of birth - Foreign born (%)
Place of birth - Foreign born (%) - White
Place of birth - Foreign born (%) - Black or African American
Place of birth - Foreign born (%) - Asian
Place of birth - Foreign born (%) - Hispanic or Latino
Place of birth - Foreign born (%) - American Indian and Alaska Native
Place of birth - Foreign born (%) - Multirace
Place of birth - Foreign born (%) - Other Race
Residents speaking English at home (%)
Residents speaking English at home - Born in the United States (%)
Residents speaking English at home - Native, born elsewhere (%)
Residents speaking English at home - Foreign born (%)
Residents speaking Spanish at home (%)
Residents speaking Spanish at home - Born in the United States (%)
Residents speaking Spanish at home - Native, born elsewhere (%)
Residents speaking Spanish at home - Foreign born (%)
Residents speaking other language at home (%)
Residents speaking other language at home - Born in the United States (%)
Residents speaking other language at home - Native, born elsewhere (%)
Residents speaking other language at home - Foreign born (%)
Marital status - Never married (%)
Marital status - Now married (%)
Marital status - Separated (%)
Marital status - Widowed (%)
Marital status - Divorced (%)
Ancestries Reported - Arab (%)
Ancestries Reported - Czech (%)
Ancestries Reported - Danish (%)
Ancestries Reported - Dutch (%)
Ancestries Reported - English (%)
Ancestries Reported - French (%)
Ancestries Reported - French Canadian (%)
Ancestries Reported - German (%)
Ancestries Reported - Greek (%)
Ancestries Reported - Hungarian (%)
Ancestries Reported - Irish (%)
Ancestries Reported - Italian (%)
Ancestries Reported - Lithuanian (%)
Ancestries Reported - Norwegian (%)
Ancestries Reported - Polish (%)
Ancestries Reported - Portuguese (%)
Ancestries Reported - Russian (%)
Ancestries Reported - Scotch-Irish (%)
Ancestries Reported - Scottish (%)
Ancestries Reported - Slovak (%)
Ancestries Reported - Subsaharan African (%)
Ancestries Reported - Swedish (%)
Ancestries Reported - Swiss (%)
Ancestries Reported - Ukrainian (%)
Ancestries Reported - United States (%)
Ancestries Reported - Welsh (%)
Ancestries Reported - West Indian (%)
Ancestries Reported - Other (%)
Geographical mobility - Same house 1 year ago (%)
Geographical mobility - Same house 1 year ago (%) - White
Geographical mobility - Same house 1 year ago (%) - Black or African American
Geographical mobility - Same house 1 year ago (%) - Asian
Geographical mobility - Same house 1 year ago (%) - Hispanic or Latino
Geographical mobility - Same house 1 year ago (%) - American Indian and Alaska Native
Geographical mobility - Same house 1 year ago (%) - Multirace
Geographical mobility - Same house 1 year ago (%) - Other Race
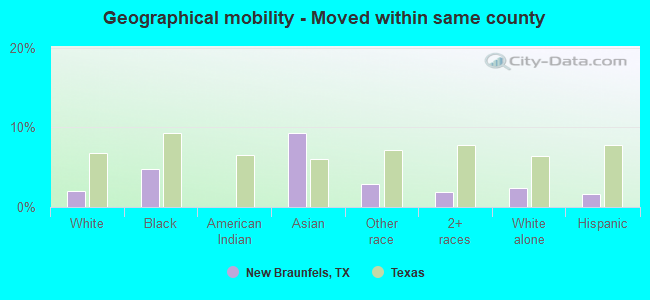
Geographical mobility - Moved within same county (%)
Geographical mobility - Moved within same county (%) - White
Geographical mobility - Moved within same county (%) - Black or African American
Geographical mobility - Moved within same county (%) - Asian
Geographical mobility - Moved within same county (%) - Hispanic or Latino
Geographical mobility - Moved within same county (%) - American Indian and Alaska Native
Geographical mobility - Moved within same county (%) - Multirace
Geographical mobility - Moved within same county (%) - Other Race
Geographical mobility - Moved from different county within same state (%)
Geographical mobility - Moved from different county within same state (%) - White
Geographical mobility - Moved from different county within same state (%) - Black or African American
Geographical mobility - Moved from different county within same state (%) - Asian
Geographical mobility - Moved from different county within same state (%) - Hispanic or Latino
Geographical mobility - Moved from different county within same state (%) - American Indian and Alaska Native
Geographical mobility - Moved from different county within same state (%) - Multirace
Geographical mobility - Moved from different county within same state (%) - Other Race
Geographical mobility - Moved from different state (%)
Geographical mobility - Moved from different state (%) - White
Geographical mobility - Moved from different state (%) - Black or African American
Geographical mobility - Moved from different state (%) - Asian
Geographical mobility - Moved from different state (%) - Hispanic or Latino
Geographical mobility - Moved from different state (%) - American Indian and Alaska Native
Geographical mobility - Moved from different state (%) - Multirace
Geographical mobility - Moved from different state (%) - Other Race
Geographical mobility - Moved from abroad (%)
Geographical mobility - Moved from abroad (%) - White
Geographical mobility - Moved from abroad (%) - Black or African American
Geographical mobility - Moved from abroad (%) - Asian
Geographical mobility - Moved from abroad (%) - Hispanic or Latino
Geographical mobility - Moved from abroad (%) - American Indian and Alaska Native
Geographical mobility - Moved from abroad (%) - Multirace
Geographical mobility - Moved from abroad (%) - Other Race
Place of birth for the foreign-born population - Ireland (%)
Place of birth for the foreign-born population - Denmark (%)
Place of birth for the foreign-born population - Norway (%)
Place of birth for the foreign-born population - Sweden (%)
Place of birth for the foreign-born population - United Kingdom (%)
Place of birth for the foreign-born population - England (%)
Place of birth for the foreign-born population - Scotland (%)
Place of birth for the foreign-born population - Other Northern Europe (%)
Place of birth for the foreign-born population - Austria (%)
Place of birth for the foreign-born population - Belgium (%)
Place of birth for the foreign-born population - France (%)
Place of birth for the foreign-born population - Germany (%)
Place of birth for the foreign-born population - Netherlands (%)
Place of birth for the foreign-born population - Switzerland (%)
Place of birth for the foreign-born population - Other Western Europe (%)
Place of birth for the foreign-born population - Greece (%)
Place of birth for the foreign-born population - Italy (%)
Place of birth for the foreign-born population - Portugal (%)
Place of birth for the foreign-born population - Spain (%)
Place of birth for the foreign-born population - Other Southern Europe (%)
Place of birth for the foreign-born population - Albania (%)
Place of birth for the foreign-born population - Belarus (%)
Place of birth for the foreign-born population - Bosnia and Herzegovina (%)
Place of birth for the foreign-born population - Bulgaria (%)
Place of birth for the foreign-born population - Croatia (%)
Place of birth for the foreign-born population - Czechoslovakia (%)
Place of birth for the foreign-born population - Hungary (%)
Place of birth for the foreign-born population - Latvia (%)
Place of birth for the foreign-born population - Lithuania (%)
Place of birth for the foreign-born population - North Macedonia (Macedonia) (%)
Place of birth for the foreign-born population - Moldova (%)
Place of birth for the foreign-born population - Poland (%)
Place of birth for the foreign-born population - Romania (%)
Place of birth for the foreign-born population - Russia (%)
Place of birth for the foreign-born population - Serbia (%)
Place of birth for the foreign-born population - Ukraine (%)
Place of birth for the foreign-born population - Other Eastern Europe (%)
Place of birth for the foreign-born population - China (%)
Place of birth for the foreign-born population - Hong Kong (%)
Place of birth for the foreign-born population - Taiwan (%)
Place of birth for the foreign-born population - Japan (%)
Place of birth for the foreign-born population - Korea (%)
Place of birth for the foreign-born population - Other Eastern Asia (%)
Place of birth for the foreign-born population - Afghanistan (%)
Place of birth for the foreign-born population - Bangladesh (%)
Place of birth for the foreign-born population - India (%)
Place of birth for the foreign-born population - Iran (%)
Place of birth for the foreign-born population - Kazakhstan (%)
Place of birth for the foreign-born population - Nepal (%)
Place of birth for the foreign-born population - Pakistan (%)
Place of birth for the foreign-born population - Sri Lanka (%)
Place of birth for the foreign-born population - Uzbekistan (%)
Place of birth for the foreign-born population - Other South Central Asia (%)
Place of birth for the foreign-born population - Burma (%)
Place of birth for the foreign-born population - Cambodia (%)
Place of birth for the foreign-born population - Indonesia (%)
Place of birth for the foreign-born population - Laos (%)
Place of birth for the foreign-born population - Malaysia (%)
Place of birth for the foreign-born population - Philippines (%)
Place of birth for the foreign-born population - Singapore (%)
Place of birth for the foreign-born population - Thailand (%)
Place of birth for the foreign-born population - Vietnam (%)
Place of birth for the foreign-born population - Other South Eastern Asia (%)
Place of birth for the foreign-born population - Armenia (%)
Place of birth for the foreign-born population - Iraq (%)
Place of birth for the foreign-born population - Israel (%)
Place of birth for the foreign-born population - Jordan (%)
Place of birth for the foreign-born population - Kuwait (%)
Place of birth for the foreign-born population - Lebanon (%)
Place of birth for the foreign-born population - Saudi Arabia (%)
Place of birth for the foreign-born population - Syria (%)
Place of birth for the foreign-born population - Turkey (%)
Place of birth for the foreign-born population - Yemen (%)
Place of birth for the foreign-born population - Other Western Asia (%)
Place of birth for the foreign-born population - Eritrea (%)
Place of birth for the foreign-born population - Ethiopia (%)
Place of birth for the foreign-born population - Kenya (%)
Place of birth for the foreign-born population - Somalia (%)
Place of birth for the foreign-born population - Uganda (%)
Place of birth for the foreign-born population - Zimbabwe (%)
Place of birth for the foreign-born population - Other Eastern Africa (%)
Place of birth for the foreign-born population - Cameroon (%)
Place of birth for the foreign-born population - Congo (%)
Place of birth for the foreign-born population - Democratic Republic of Congo (Zaire) (%)
Place of birth for the foreign-born population - Other Middle Africa (%)
Place of birth for the foreign-born population - Egypt (%)
Place of birth for the foreign-born population - Morocco (%)
Place of birth for the foreign-born population - Sudan (%)
Place of birth for the foreign-born population - Other Northern Africa (%)
Place of birth for the foreign-born population - South Africa (%)
Place of birth for the foreign-born population - Other Southern Africa (%)
Place of birth for the foreign-born population - Cabo Verde (%)
Place of birth for the foreign-born population - Ghana (%)
Place of birth for the foreign-born population - Liberia (%)
Place of birth for the foreign-born population - Nigeria (%)
Place of birth for the foreign-born population - Senegal (%)
Place of birth for the foreign-born population - Sierra Leone (%)
Place of birth for the foreign-born population - Other Western Africa (%)
Place of birth for the foreign-born population - Australia (%)
Place of birth for the foreign-born population - New Zealand (%)
Place of birth for the foreign-born population - Fiji (%)
Place of birth for the foreign-born population - Micronesia (%)
Place of birth for the foreign-born population - Bahamas (%)
Place of birth for the foreign-born population - Barbados (%)
Place of birth for the foreign-born population - Cuba (%)
Place of birth for the foreign-born population - Dominica (%)
Place of birth for the foreign-born population - Dominican Republic (%)
Place of birth for the foreign-born population - Grenada (%)
Place of birth for the foreign-born population - Haiti (%)
Place of birth for the foreign-born population - Jamaica (%)
Place of birth for the foreign-born population - St. Vincent and the Grenadines (%)
Place of birth for the foreign-born population - Trinidad and Tobago (%)
Place of birth for the foreign-born population - West Indies (%)
Place of birth for the foreign-born population - Other Caribbean (%)
Place of birth for the foreign-born population - Belize (%)
Place of birth for the foreign-born population - Costa Rica (%)
Place of birth for the foreign-born population - El Salvador (%)
Place of birth for the foreign-born population - Guatemala (%)
Place of birth for the foreign-born population - Honduras (%)
Place of birth for the foreign-born population - Mexico (%)
Place of birth for the foreign-born population - Nicaragua (%)
Place of birth for the foreign-born population - Panama (%)
Place of birth for the foreign-born population - Other Central America (%)
Place of birth for the foreign-born population - Argentina (%)
Place of birth for the foreign-born population - Bolivia (%)
Place of birth for the foreign-born population - Brazil (%)
Place of birth for the foreign-born population - Chile (%)
Place of birth for the foreign-born population - Colombia (%)
Place of birth for the foreign-born population - Ecuador (%)
Place of birth for the foreign-born population - Guyana (%)
Place of birth for the foreign-born population - Peru (%)
Place of birth for the foreign-born population - Uruguay (%)
Place of birth for the foreign-born population - Venezuela (%)
Place of birth for the foreign-born population - Other South America (%)
Place of birth for the foreign-born population - Canada (%)
Place of birth for the foreign-born population - Other Northern America (%)
Place of birth for the foreign-born population - Other (%)
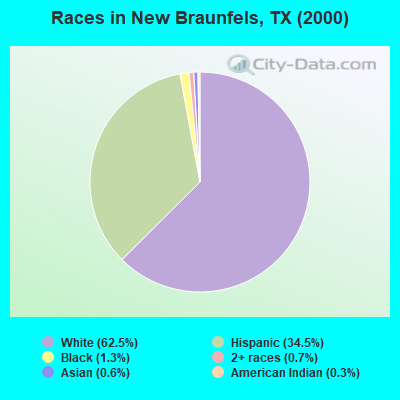
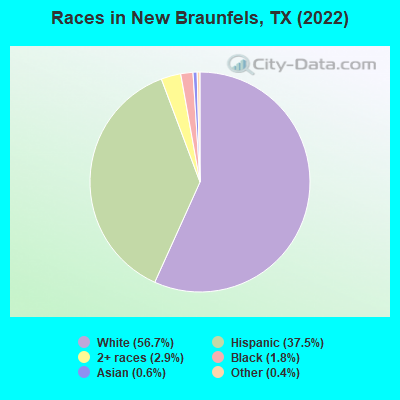
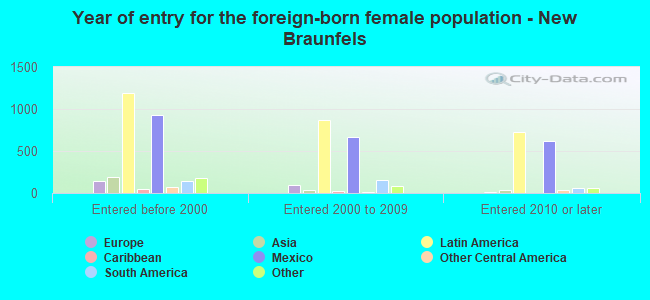
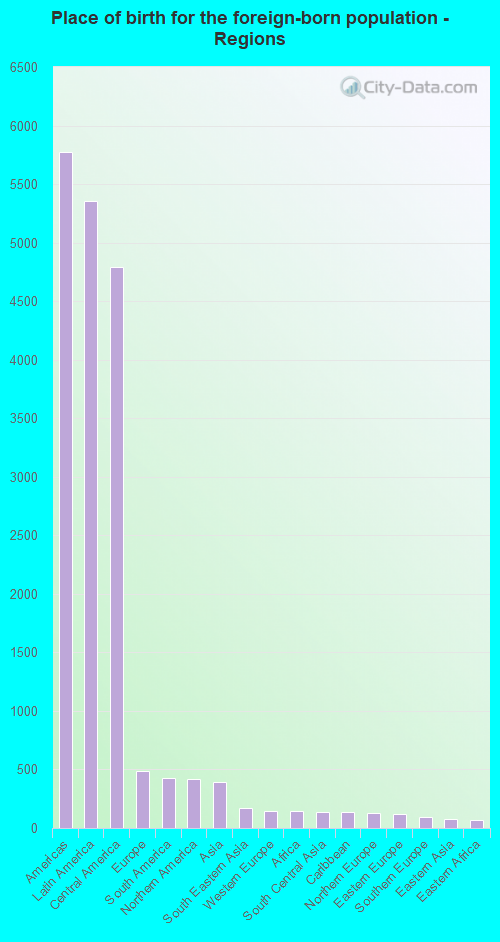
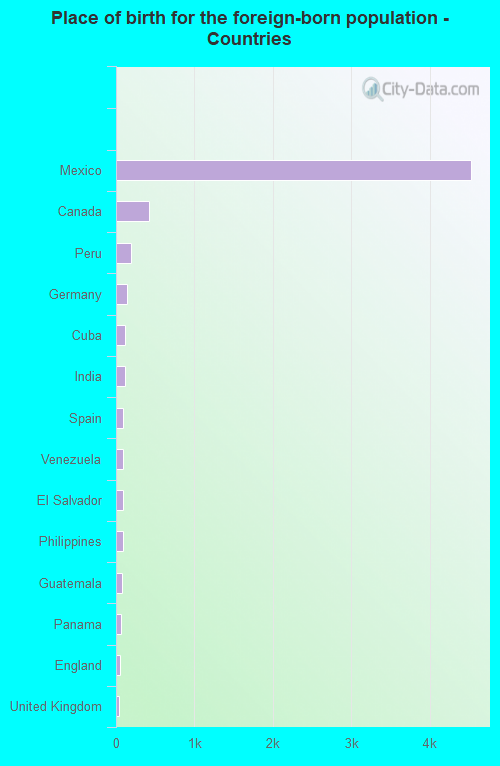
According to 2022 data, the most numerous races in New Braunfels, TX are Hispanic (38,979 residents), White alone (58,977 residents), and Black alone (1,916 residents). 79.1% of New Braunfels residents speak English at home. 6.6% of New Braunfels, TX residents are foreign-born (5.6% born in Latin America), which is 158.7% less than the foreign-born rate of 17.0% across the entire state of Texas.
Race distribution in New Braunfels
2000 2022
10,933,313 52.4% White alone 6,669,666 32.0% Hispanic 2,364,255 11.3% Black alone 554,445 2.7% Asian alone 230,567 1.1% Two or more races 68,859 0.3% American Indian alone 19,958 0.10% Other race alone 10,757 0.05% Native Hawaiian and Other
12,070,642 40.2% Hispanic 11,683,430 38.9% White alone 3,508,706 11.7% Black alone 1,608,173 5.4% Asian alone 956,560 3.2% Two or more races 125,763 0.4% Other race alone 47,023 0.2% American Indian alone 29,275 0.10% Native Hawaiian and Other
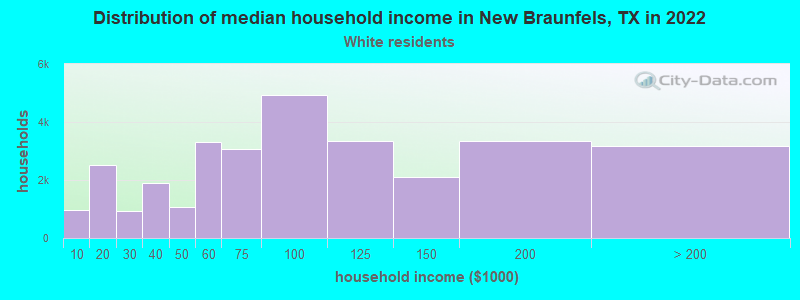
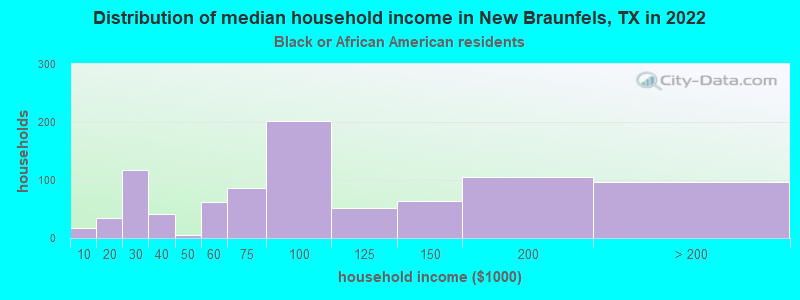
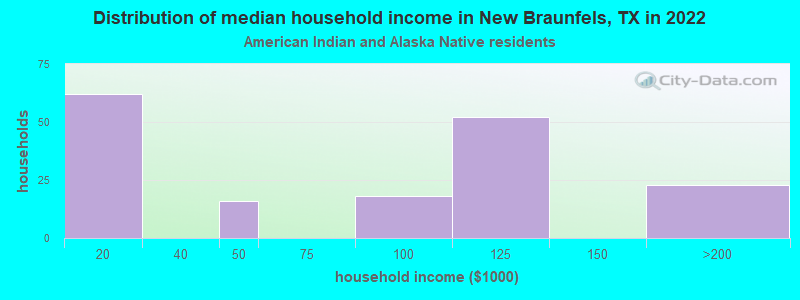
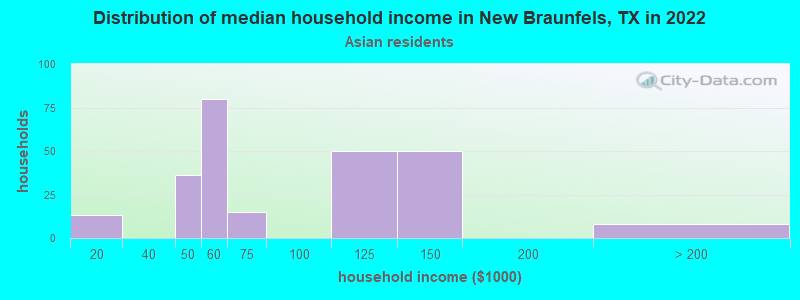
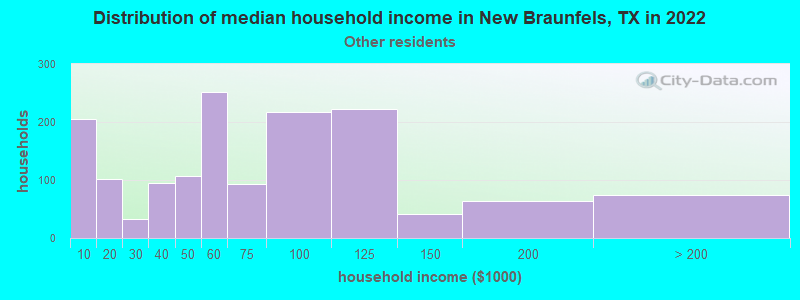
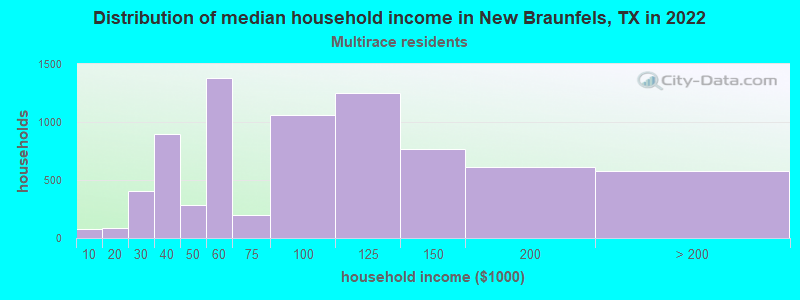
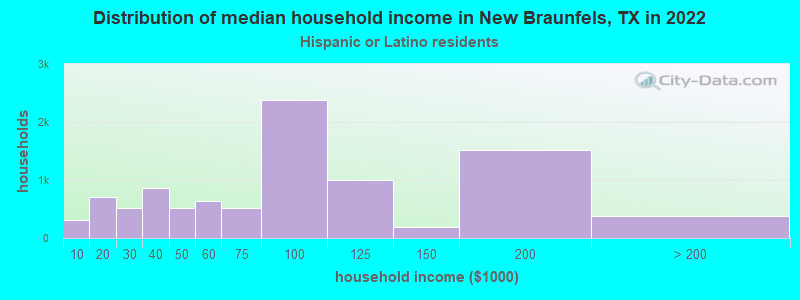
Income and house value in New Braunfels Median household income in 2022 $84,495 White non-Hispanic householders$56,315 Black householders$58,827 Asian householders$59,300 Some other race householders$88,028 Two or more races householders$77,974 Hispanic or Latino race householdersMedian 2022 house value $394,809 White Non-Hispanic householders$254,934 Black or African American householders$413,609 American Indian or Alaska Native householders $443,314 Asian householders$188,004 Some other race householders$266,214 Two or more races householders$230,869 Hispanic or Latino householders
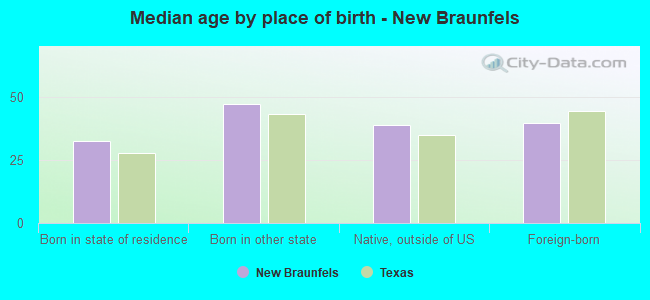
Median age by race in New Braunfels
39.9 Median age for White residents38.5 43.7 37.1 Median age for Black or African American residents21.9 52.0 -666,666,666.0 Median age for American Indian / Alaska Native residents-666,666,666.0 -666,666,666.0 37.1 Median age for Asian residents26.9 38.7 -666,666,666.0 Median age for Native Hawaiian / Pacific Islander residents-666,666,666.0 -666,666,666.0 37.5 Median age for Other race residents37.5 31.9 30.8 Median age for Two or more races residents37.0 30.3 41.3 Median age for White alone residents39.4 44.5 30.4 Median age for Hispanic or Latino residents30.7 30.2
Owner/renter occupied households by race in New Braunfels
House owners and renters - White residents 20,248 66.1% Owner occupied10,390 33.9% Renter occupiedHouse owners and renters - Black or African American residents 240 36.0% Owner occupied427 64.0% Renter occupiedHouse owners and renters - American Indian / Alaska Native residents 104 60.8% Owner occupied67 39.2% Renter occupiedHouse owners and renters - Asian residents 217 87.2% Owner occupied32 12.8% Renter occupiedHouse owners and renters - Other race residents 939 58.3% Owner occupied671 41.7% Renter occupiedHouse owners and renters - Two or more races residents 5,446 80.3% Owner occupied1,333 19.7% Renter occupiedHouse owners and renters - White alone residents 18,966 66.9% Owner occupied9,368 33.1% Renter occupiedHouse owners and renters - Hispanic or Latino residents 6,845 71.8% Owner occupied2,694 28.2% Renter occupied
Language usage in New Braunfels
English speakers - Total 79.1% of residents of New Braunfels speak English at home.
18.6% of residents speak Spanish at home 12,977 74.0% Speak English very well4,571 26.0% Speak English less than very well2.3% of residents speak other language at home 1,881 87.2% Speak English very well276 12.8% Speak English less than very well
English speakers - Born in the United States 85.8% of residents of New Braunfels speak English at home.
10.3% of residents speak Spanish at home 3,011 95.7% Speak English very well136 4.3% Speak English less than very well3.9% of residents speak other language at home 1,147 96.1% Speak English very well46 3.9% Speak English less than very well
English speakers - Native, born elsewhere 69.7% of residents of New Braunfels speak English at home.
19.9% of residents speak Spanish at home 319 100.0% Speak English very well10.4% of residents speak other language at home 115 68.9% Speak English very well52 31.1% Speak English less than very well
English speakers - Foreign-born 13.0% of residents of New Braunfels speak English at home.
76.5% of residents speak Spanish at home 2,201 41.9% Speak English very well3,053 58.1% Speak English less than very well10.5% of residents speak other language at home 543 75.3% Speak English very well178 24.7% Speak English less than very well
White (Caucasian) - Speak only English Native:
93.8% (60,873)Foreign-born:
37.8% (608)
White (Caucasian) - Speak another language Native:
6.2% (4,017)Foreign-born:
62.2% (999)
Black or African American - Speak only English Native:
100.0% (1,961)Foreign-born:
41.6% (46)
American Indian / Alaska Native - Speak another language Native:
22.2% (62)Foreign-born:
98.9% (54)
Asian - Speak only English Native:
100.0% (500)Foreign-born:
21.7% (87)
Asian - Speak another language Native:
1.1% (6)Foreign-born:
78.6% (317)
Other race - Speak only English Native:
50.1% (2,179)Foreign-born:
3.5% (56)
Other race - Speak another language Native:
49.7% (2,161)Foreign-born:
92.2% (1,479)
Two or more races - Speak only English Native:
46.3% (6,742)Foreign-born:
1.7% (70)
Two or more races - Speak another language Native:
53.7% (7,808)Foreign-born:
98.3% (4,020)
White alone - Speak only English Native:
96.5% (55,907)Foreign-born:
64.3% (608)
White alone - Speak another language Native:
3.5% (2,016)Foreign-born:
35.7% (338)
Hispanic or Latino - Speak only English Native:
53.2% (13,163)Foreign-born:
2.3% (126)
Hispanic or Latino - Speak another language Native:
46.8% (11,573)Foreign-born:
97.7% (5,290)
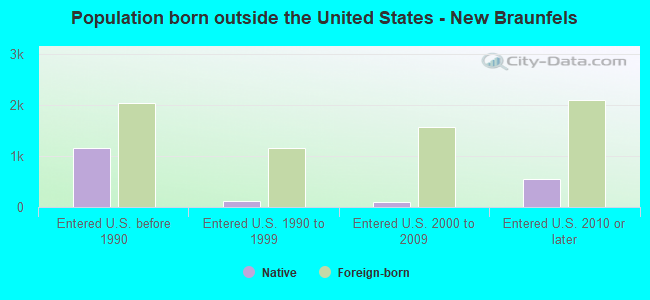
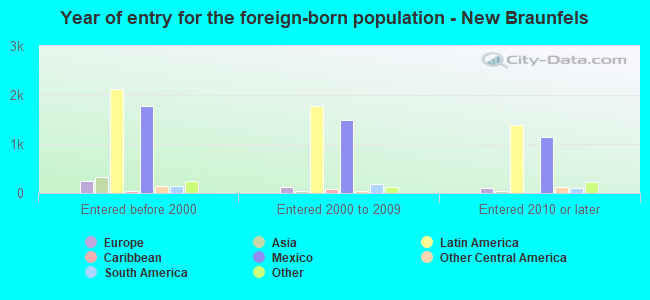
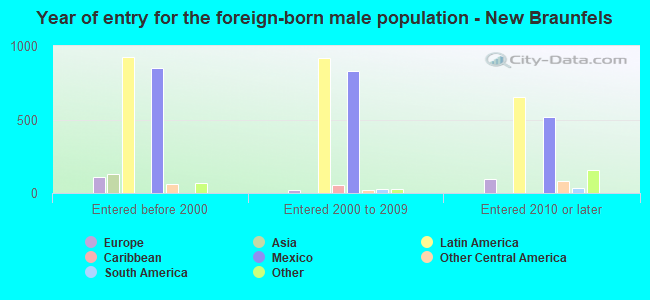
Foreign-born residents in New Braunfels 6,829 residents are foreign born (5.6% Latin America ).
This city:
6.6%Texas:
17.1%
Marital status for residents in New Braunfels Marital status - White (Caucasian) population 15 years and over
Males 31.6% Never married57.3% Now married1.3% Separated1.4% Widowed8.4% DivorcedFemales 25.2% Never married47.6% Now married2.6% Separated8.0% Widowed16.7% DivorcedWomen who gave birth in the past 12 months Now married:
64.0% (1,006)Unmarried:
36.0% (566)
Women who did not give birth in the past 12 months Now married:
43.3% (6,509)Unmarried:
56.7% (8,516)
Marital status - Black or African American population 15 years and over
Males 38.9% Never married46.4% Now married8.5% Separated1.1% Widowed5.0% DivorcedFemales 25.9% Never married50.6% Now married0.5% Separated6.5% Widowed16.5% DivorcedWomen who gave birth in the past 12 months Now married:
100.0% (61)Unmarried:
0.0% (0)
Women who did not give birth in the past 12 months Now married:
45.2% (176)Unmarried:
54.8% (213)
Marital status - American Indian / Alaska Native population 15 years and over
Males 50.0% Never married38.3% Now married0.0% Separated0.0% Widowed11.7% DivorcedFemales 0.0% Never married74.0% Now married0.0% Separated0.0% Widowed26.0% DivorcedMarital status - Asian population 15 years and over
Males 39.1% Never married60.9% Now married0.0% Separated0.0% Widowed0.0% DivorcedFemales 38.3% Never married47.7% Now married0.0% Separated6.5% Widowed7.6% DivorcedWomen who gave birth in the past 12 months Now married:
100.0% (16)Unmarried:
0.0% (0)
Women who did not give birth in the past 12 months Now married:
32.5% (101)Unmarried:
67.5% (210)
Marital status - Other race population 15 years and over
Males 52.5% Never married34.8% Now married0.0% Separated0.0% Widowed12.7% DivorcedFemales 41.1% Never married38.0% Now married0.0% Separated4.5% Widowed16.5% DivorcedWomen who gave birth in the past 12 months Now married:
92.8% (124)Unmarried:
7.2% (10)
Women who did not give birth in the past 12 months Now married:
18.5% (232)Unmarried:
81.5% (1,020)
Marital status - Two or more races population 15 years and over
Males 25.2% Never married66.7% Now married0.6% Separated1.0% Widowed6.6% DivorcedFemales 26.4% Never married61.3% Now married2.2% Separated7.3% Widowed2.8% DivorcedWomen who gave birth in the past 12 months Now married:
100.0% (239)Unmarried:
0.0% (0)
Women who did not give birth in the past 12 months Now married:
61.4% (4,077)Unmarried:
38.6% (2,568)
Marital status - White alone, not Hispanic / Latino population 15 years and over
Males 31.4% Never married56.4% Now married1.3% Separated1.5% Widowed9.4% DivorcedFemales 23.6% Never married48.0% Now married2.6% Separated8.6% Widowed17.2% DivorcedWomen who gave birth in the past 12 months Now married:
69.0% (946)Unmarried:
31.0% (426)
Women who did not give birth in the past 12 months Now married:
42.7% (5,630)Unmarried:
57.3% (7,543)
Marital status - Hispanic or Latino population 15 years and over
Males 37.1% Never married58.0% Now married0.7% Separated0.6% Widowed3.7% DivorcedFemales 33.4% Never married52.8% Now married1.9% Separated5.2% Widowed6.7% DivorcedWomen who gave birth in the past 12 months Now married:
57.1% (186)Unmarried:
42.9% (140)
Women who did not give birth in the past 12 months Now married:
52.2% (4,400)Unmarried:
47.8% (4,023)
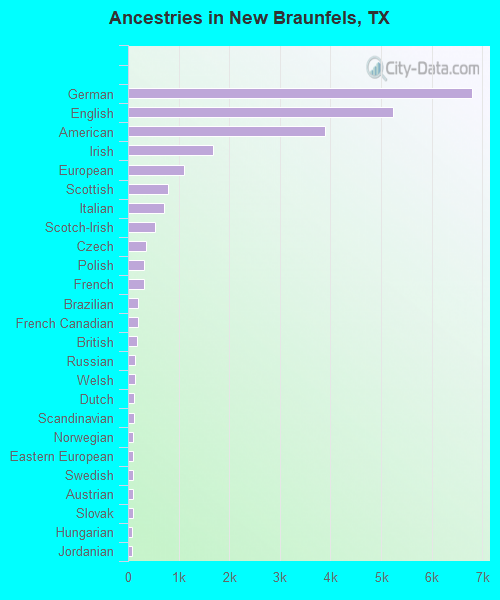
Ancestries in New Braunfels
6,792 14.0% German5,230 10.8% English3,883 8.0% American1,686 3.5% Irish1,108 2.3% European799 1.6% Scottish710 1.5% Italian533 1.1% Scotch-Irish350 0.7% Czech319 0.7% Polish318 0.7% French200 0.4% Brazilian190 0.4% French Canadian171 0.4% British145 0.3% Russian136 0.3% Welsh122 0.3% Dutch109 0.2% Scandinavian104 0.2% Norwegian99 0.2% Eastern European98 0.2% Swedish97 0.2% Austrian92 0.2% Slovak88 0.2% Hungarian74 0.2% Jordanian71 0.1% Celtic55 0.1% Canadian50 0.1% Czechoslovakian48 0.10% Basque36 0.07% Danish35 0.07% Swiss30 0.06% Portuguese30 0.06% African29 0.06% Australian28 0.06% Pennsylvania German24 0.05% West Indian22 0.05% Northern European18 0.04% Finnish15 0.03% Ukrainian14 0.03% Lithuanian13 0.03% Belgian8 0.02% Romanian
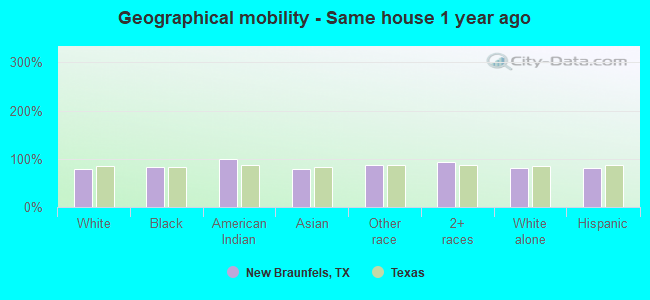
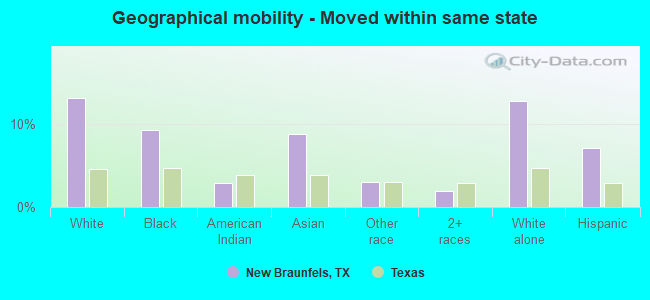
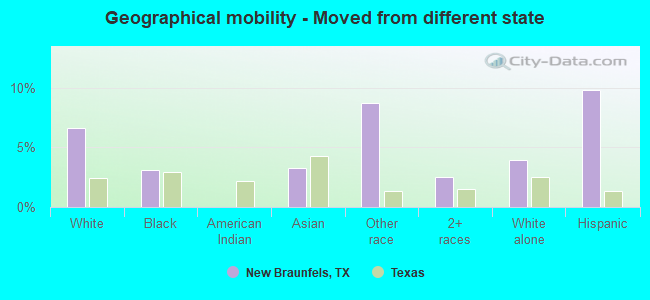
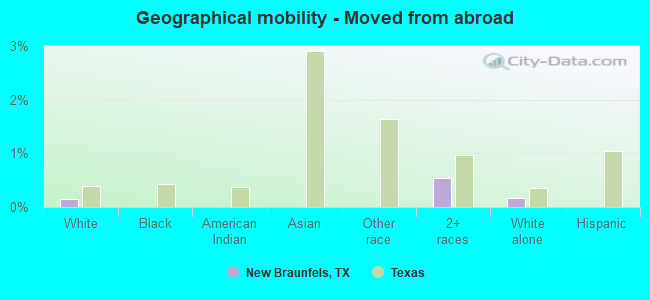
Geographical mobility in New Braunfels Same house 1 year ago 53,445 77.9% White (Caucasian)1,877 83.6% Black or African American356 99.3% American Indian / Alaska Native689 78.0% Asian4,580 86.4% Other race22,271 94.3% Two or more races48,928 80.8% White alone, not Hispanic / Latino25,444 81.4% Hispanic or LatinoMoved within same county 1,407 2.1% White / Caucasian106 4.7% Black or African American82 9.3% Asian155 2.9% Other race433 1.8% Two or more races1,407 2.3% White alone, not Hispanic / Latino499 1.6% Hispanic or LatinoMoved within same state 9,078 13.2% White / Caucasian210 9.4% Black or African American10 2.9% American Indian / Alaska Native78 8.8% Asian164 3.1% Other race453 1.9% Two or more races7,738 12.8% White alone, not Hispanic / Latino2,238 7.2% Hispanic or LatinoMoved from different state 4,559 6.6% White / Caucasian70 3.1% Black or African American29 3.3% Asian463 8.7% Other race603 2.6% Two or more races2,373 3.9% White alone, not Hispanic / Latino3,078 9.8% Hispanic or LatinoMoved from abroad 105 0.2% White129 0.5% Two or more races105 0.2% White alone, not Hispanic / Latino
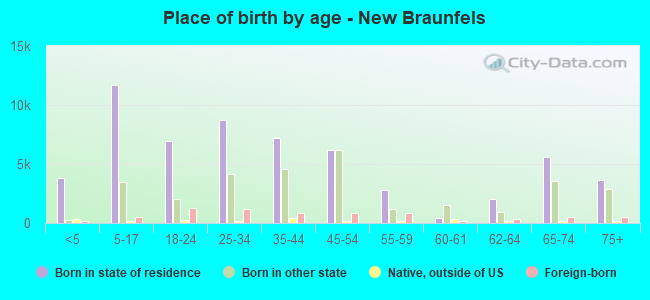
Children Nativity (place of birth) in New Braunfels
Children under 6 years - Living with two parents Both parents native 4,415 100.0% NativeBoth parents foreign-born 384 100.0% NativeOne native, one foreign-born parent 472 100.0% NativeChildren under 6 years - Living with one parent Native parent 1,467 100.0% NativeForeign-born parent 30 100.0% NativeChildren 6 to 17 years - Living with two parents Both parents native 8,250 99.0% Native81 1.0% Foreign-bornBoth parents foreign-born 637 72.8% Native238 27.2% Foreign-bornOne native, one foreign-born parent 1,026 94.1% Native65 5.9% Foreign-bornChildren 6 to 17 years - Living with one parent Native parent 4,260 100.0% NativeForeign-born parent 119 50.5% Native117 49.5% Foreign-born
Grandparents responsible for own grandchildren in New Braunfels
Grandparents (30 to 59 years) White / Caucasian 172 38.8% Responsible for grandchildren271 61.2% Not responsible for grandchildrenOther race 30 100.0% Not responsible for grandchildrenTwo or more races 54 26.4% Responsible for grandchildren151 73.6% Not responsible for grandchildrenWhite alone, not Hispanic / Latino 139 59.5% Responsible for grandchildren94 40.5% Not responsible for grandchildrenHispanic or Latino 131 23.2% Responsible for grandchildren433 76.8% Not responsible for grandchildrenGrandparents (60 years and over) White / Caucasian 205 41.1% Responsible for grandchildren294 58.9% Not responsible for grandchildrenOther race 29 23.3% Responsible for grandchildren94 76.7% Not responsible for grandchildrenTwo or more races 272 67.6% Responsible for grandchildren130 32.4% Not responsible for grandchildrenWhite alone, not Hispanic / Latino 226 42.1% Responsible for grandchildren310 57.9% Not responsible for grandchildrenHispanic or Latino 212 49.3% Responsible for grandchildren218 50.7% Not responsible for grandchildren