Races in New Castle, Indiana (IN) Detailed Stats
Data:
Races - White alone (%)
Races - White alone (% change since 2000)
Races - Black alone (%)
Races - Black alone (% change since 2000)
Races - American Indian alone (%)
Races - American Indian alone (% change since 2000)
Races - Asian alone (%)
Races - Asian alone (% change since 2000)
Races - Hispanic (%)
Races - Hispanic (% change since 2000)
Races - Native Hawaiian and Other Pacific Islander alone (%)
Races - Native Hawaiian and Other Pacific Islander alone (% change since 2000)
Races - Two or more races(%)
Races - Two or more races(% change since 2000)
Races - Other race alone (%)
Races - Other race alone (% change since 2000)
Racial diversity
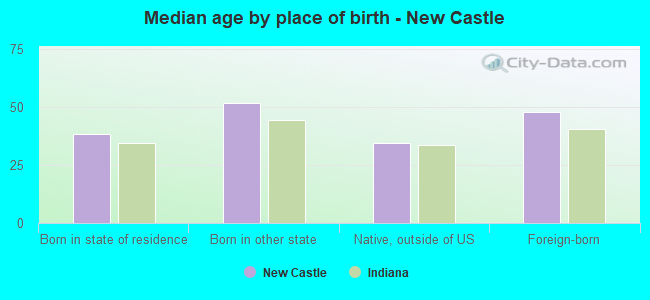
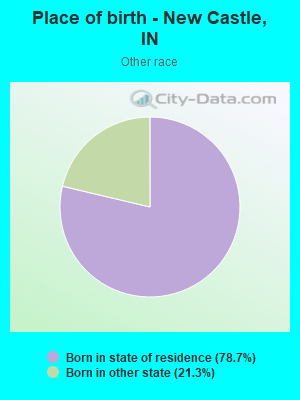
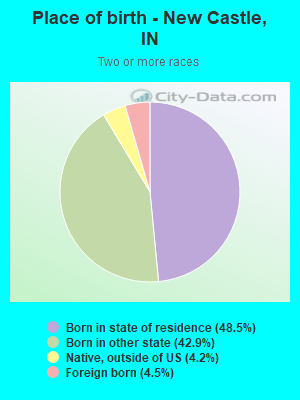
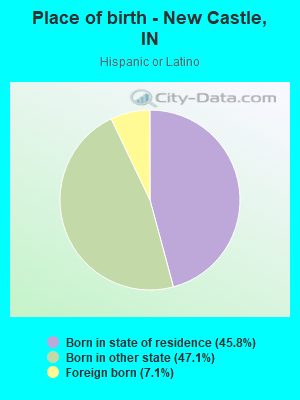
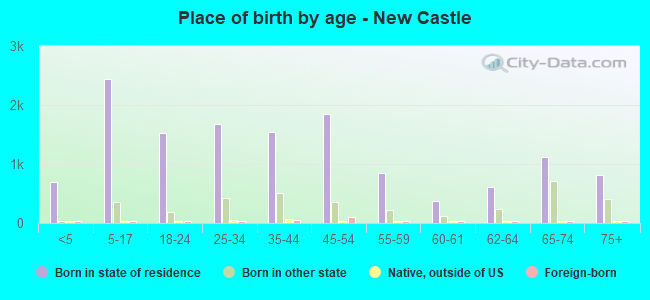
Place of birth - Born in state of residence (%)
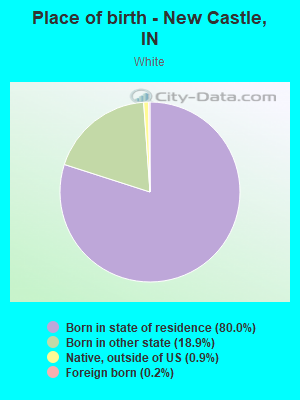
Place of birth - Born in state of residence (%) - White
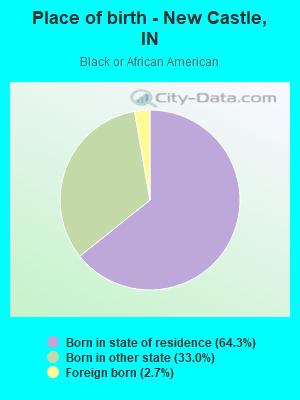
Place of birth - Born in state of residence (%) - Black or African American
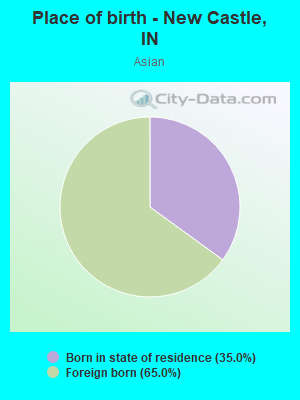
Place of birth - Born in state of residence (%) - Asian
Place of birth - Born in state of residence (%) - Hispanic or Latino
Place of birth - Born in state of residence (%) - American Indian and Alaska Native
Place of birth - Born in state of residence (%) - Multirace
Place of birth - Born in state of residence (%) - Other Race
Place of birth - Born in other state (%)
Place of birth - Born in other state (%) - White
Place of birth - Born in other state (%) - Black or African American
Place of birth - Born in other state (%) - Asian
Place of birth - Born in other state (%) - Hispanic or Latino
Place of birth - Born in other state (%) - American Indian and Alaska Native
Place of birth - Born in other state (%) - Multirace
Place of birth - Born in other state (%) - Other Race
Place of birth - Native, outside of US (%)
Place of birth - Native, outside of US (%) - White
Place of birth - Native, outside of US (%) - Black or African American
Place of birth - Native, outside of US (%) - Asian
Place of birth - Native, outside of US (%) - Hispanic or Latino
Place of birth - Native, outside of US (%) - American Indian and Alaska Native
Place of birth - Native, outside of US (%) - Multirace
Place of birth - Native, outside of US (%) - Other Race
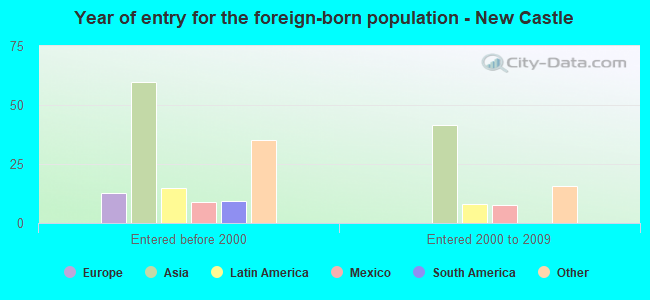
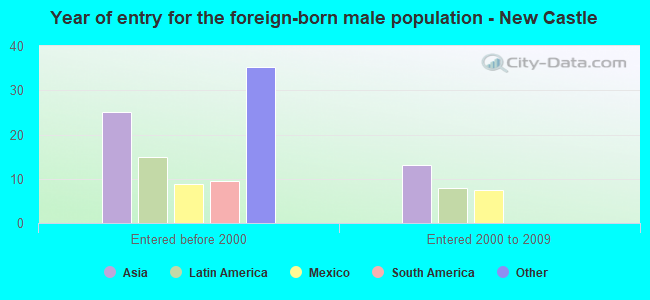
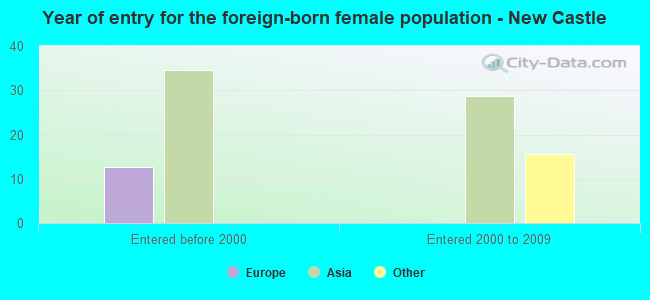
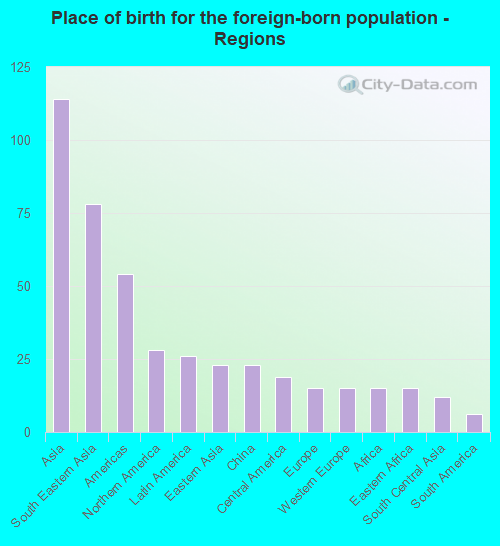
Place of birth - Foreign born (%)
Place of birth - Foreign born (%) - White
Place of birth - Foreign born (%) - Black or African American
Place of birth - Foreign born (%) - Asian
Place of birth - Foreign born (%) - Hispanic or Latino
Place of birth - Foreign born (%) - American Indian and Alaska Native
Place of birth - Foreign born (%) - Multirace
Place of birth - Foreign born (%) - Other Race
Residents speaking English at home (%)
Residents speaking English at home - Born in the United States (%)
Residents speaking English at home - Native, born elsewhere (%)
Residents speaking English at home - Foreign born (%)
Residents speaking Spanish at home (%)
Residents speaking Spanish at home - Born in the United States (%)
Residents speaking Spanish at home - Native, born elsewhere (%)
Residents speaking Spanish at home - Foreign born (%)
Residents speaking other language at home (%)
Residents speaking other language at home - Born in the United States (%)
Residents speaking other language at home - Native, born elsewhere (%)
Residents speaking other language at home - Foreign born (%)
Marital status - Never married (%)
Marital status - Now married (%)
Marital status - Separated (%)
Marital status - Widowed (%)
Marital status - Divorced (%)
Ancestries Reported - Arab (%)
Ancestries Reported - Czech (%)
Ancestries Reported - Danish (%)
Ancestries Reported - Dutch (%)
Ancestries Reported - English (%)
Ancestries Reported - French (%)
Ancestries Reported - French Canadian (%)
Ancestries Reported - German (%)
Ancestries Reported - Greek (%)
Ancestries Reported - Hungarian (%)
Ancestries Reported - Irish (%)
Ancestries Reported - Italian (%)
Ancestries Reported - Lithuanian (%)
Ancestries Reported - Norwegian (%)
Ancestries Reported - Polish (%)
Ancestries Reported - Portuguese (%)
Ancestries Reported - Russian (%)
Ancestries Reported - Scotch-Irish (%)
Ancestries Reported - Scottish (%)
Ancestries Reported - Slovak (%)
Ancestries Reported - Subsaharan African (%)
Ancestries Reported - Swedish (%)
Ancestries Reported - Swiss (%)
Ancestries Reported - Ukrainian (%)
Ancestries Reported - United States (%)
Ancestries Reported - Welsh (%)
Ancestries Reported - West Indian (%)
Ancestries Reported - Other (%)
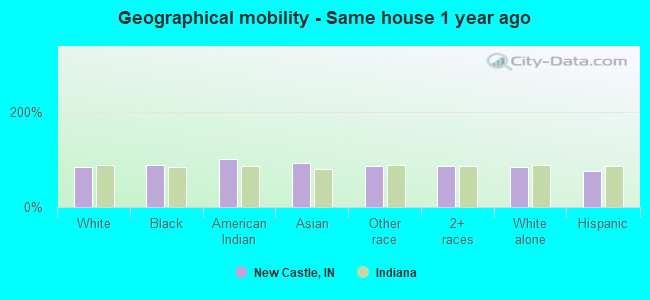
Geographical mobility - Same house 1 year ago (%)
Geographical mobility - Same house 1 year ago (%) - White
Geographical mobility - Same house 1 year ago (%) - Black or African American
Geographical mobility - Same house 1 year ago (%) - Asian
Geographical mobility - Same house 1 year ago (%) - Hispanic or Latino
Geographical mobility - Same house 1 year ago (%) - American Indian and Alaska Native
Geographical mobility - Same house 1 year ago (%) - Multirace
Geographical mobility - Same house 1 year ago (%) - Other Race
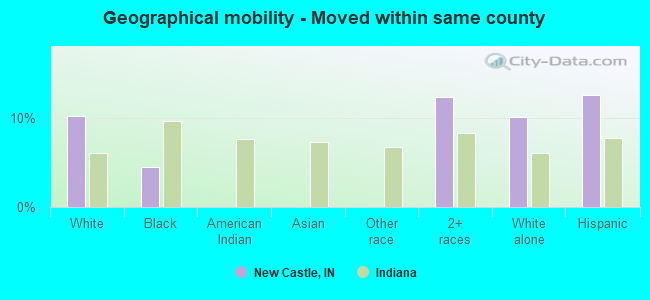
Geographical mobility - Moved within same county (%)
Geographical mobility - Moved within same county (%) - White
Geographical mobility - Moved within same county (%) - Black or African American
Geographical mobility - Moved within same county (%) - Asian
Geographical mobility - Moved within same county (%) - Hispanic or Latino
Geographical mobility - Moved within same county (%) - American Indian and Alaska Native
Geographical mobility - Moved within same county (%) - Multirace
Geographical mobility - Moved within same county (%) - Other Race
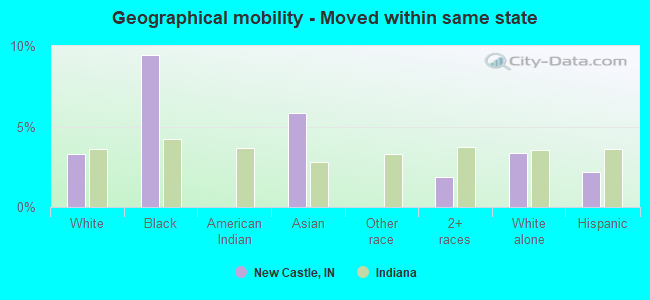
Geographical mobility - Moved from different county within same state (%)
Geographical mobility - Moved from different county within same state (%) - White
Geographical mobility - Moved from different county within same state (%) - Black or African American
Geographical mobility - Moved from different county within same state (%) - Asian
Geographical mobility - Moved from different county within same state (%) - Hispanic or Latino
Geographical mobility - Moved from different county within same state (%) - American Indian and Alaska Native
Geographical mobility - Moved from different county within same state (%) - Multirace
Geographical mobility - Moved from different county within same state (%) - Other Race
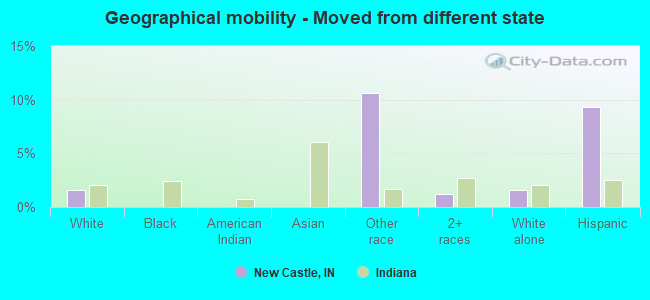
Geographical mobility - Moved from different state (%)
Geographical mobility - Moved from different state (%) - White
Geographical mobility - Moved from different state (%) - Black or African American
Geographical mobility - Moved from different state (%) - Asian
Geographical mobility - Moved from different state (%) - Hispanic or Latino
Geographical mobility - Moved from different state (%) - American Indian and Alaska Native
Geographical mobility - Moved from different state (%) - Multirace
Geographical mobility - Moved from different state (%) - Other Race
Geographical mobility - Moved from abroad (%)
Geographical mobility - Moved from abroad (%) - White
Geographical mobility - Moved from abroad (%) - Black or African American
Geographical mobility - Moved from abroad (%) - Asian
Geographical mobility - Moved from abroad (%) - Hispanic or Latino
Geographical mobility - Moved from abroad (%) - American Indian and Alaska Native
Geographical mobility - Moved from abroad (%) - Multirace
Geographical mobility - Moved from abroad (%) - Other Race
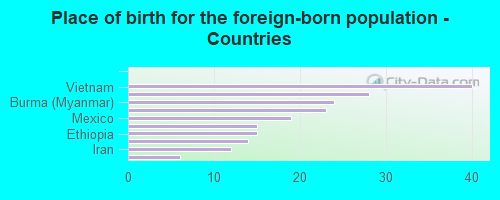
Place of birth for the foreign-born population - Ireland (%)
Place of birth for the foreign-born population - Denmark (%)
Place of birth for the foreign-born population - Norway (%)
Place of birth for the foreign-born population - Sweden (%)
Place of birth for the foreign-born population - United Kingdom (%)
Place of birth for the foreign-born population - England (%)
Place of birth for the foreign-born population - Scotland (%)
Place of birth for the foreign-born population - Other Northern Europe (%)
Place of birth for the foreign-born population - Austria (%)
Place of birth for the foreign-born population - Belgium (%)
Place of birth for the foreign-born population - France (%)
Place of birth for the foreign-born population - Germany (%)
Place of birth for the foreign-born population - Netherlands (%)
Place of birth for the foreign-born population - Switzerland (%)
Place of birth for the foreign-born population - Other Western Europe (%)
Place of birth for the foreign-born population - Greece (%)
Place of birth for the foreign-born population - Italy (%)
Place of birth for the foreign-born population - Portugal (%)
Place of birth for the foreign-born population - Spain (%)
Place of birth for the foreign-born population - Other Southern Europe (%)
Place of birth for the foreign-born population - Albania (%)
Place of birth for the foreign-born population - Belarus (%)
Place of birth for the foreign-born population - Bosnia and Herzegovina (%)
Place of birth for the foreign-born population - Bulgaria (%)
Place of birth for the foreign-born population - Croatia (%)
Place of birth for the foreign-born population - Czechoslovakia (%)
Place of birth for the foreign-born population - Hungary (%)
Place of birth for the foreign-born population - Latvia (%)
Place of birth for the foreign-born population - Lithuania (%)
Place of birth for the foreign-born population - North Macedonia (Macedonia) (%)
Place of birth for the foreign-born population - Moldova (%)
Place of birth for the foreign-born population - Poland (%)
Place of birth for the foreign-born population - Romania (%)
Place of birth for the foreign-born population - Russia (%)
Place of birth for the foreign-born population - Serbia (%)
Place of birth for the foreign-born population - Ukraine (%)
Place of birth for the foreign-born population - Other Eastern Europe (%)
Place of birth for the foreign-born population - China (%)
Place of birth for the foreign-born population - Hong Kong (%)
Place of birth for the foreign-born population - Taiwan (%)
Place of birth for the foreign-born population - Japan (%)
Place of birth for the foreign-born population - Korea (%)
Place of birth for the foreign-born population - Other Eastern Asia (%)
Place of birth for the foreign-born population - Afghanistan (%)
Place of birth for the foreign-born population - Bangladesh (%)
Place of birth for the foreign-born population - India (%)
Place of birth for the foreign-born population - Iran (%)
Place of birth for the foreign-born population - Kazakhstan (%)
Place of birth for the foreign-born population - Nepal (%)
Place of birth for the foreign-born population - Pakistan (%)
Place of birth for the foreign-born population - Sri Lanka (%)
Place of birth for the foreign-born population - Uzbekistan (%)
Place of birth for the foreign-born population - Other South Central Asia (%)
Place of birth for the foreign-born population - Burma (%)
Place of birth for the foreign-born population - Cambodia (%)
Place of birth for the foreign-born population - Indonesia (%)
Place of birth for the foreign-born population - Laos (%)
Place of birth for the foreign-born population - Malaysia (%)
Place of birth for the foreign-born population - Philippines (%)
Place of birth for the foreign-born population - Singapore (%)
Place of birth for the foreign-born population - Thailand (%)
Place of birth for the foreign-born population - Vietnam (%)
Place of birth for the foreign-born population - Other South Eastern Asia (%)
Place of birth for the foreign-born population - Armenia (%)
Place of birth for the foreign-born population - Iraq (%)
Place of birth for the foreign-born population - Israel (%)
Place of birth for the foreign-born population - Jordan (%)
Place of birth for the foreign-born population - Kuwait (%)
Place of birth for the foreign-born population - Lebanon (%)
Place of birth for the foreign-born population - Saudi Arabia (%)
Place of birth for the foreign-born population - Syria (%)
Place of birth for the foreign-born population - Turkey (%)
Place of birth for the foreign-born population - Yemen (%)
Place of birth for the foreign-born population - Other Western Asia (%)
Place of birth for the foreign-born population - Eritrea (%)
Place of birth for the foreign-born population - Ethiopia (%)
Place of birth for the foreign-born population - Kenya (%)
Place of birth for the foreign-born population - Somalia (%)
Place of birth for the foreign-born population - Uganda (%)
Place of birth for the foreign-born population - Zimbabwe (%)
Place of birth for the foreign-born population - Other Eastern Africa (%)
Place of birth for the foreign-born population - Cameroon (%)
Place of birth for the foreign-born population - Congo (%)
Place of birth for the foreign-born population - Democratic Republic of Congo (Zaire) (%)
Place of birth for the foreign-born population - Other Middle Africa (%)
Place of birth for the foreign-born population - Egypt (%)
Place of birth for the foreign-born population - Morocco (%)
Place of birth for the foreign-born population - Sudan (%)
Place of birth for the foreign-born population - Other Northern Africa (%)
Place of birth for the foreign-born population - South Africa (%)
Place of birth for the foreign-born population - Other Southern Africa (%)
Place of birth for the foreign-born population - Cabo Verde (%)
Place of birth for the foreign-born population - Ghana (%)
Place of birth for the foreign-born population - Liberia (%)
Place of birth for the foreign-born population - Nigeria (%)
Place of birth for the foreign-born population - Senegal (%)
Place of birth for the foreign-born population - Sierra Leone (%)
Place of birth for the foreign-born population - Other Western Africa (%)
Place of birth for the foreign-born population - Australia (%)
Place of birth for the foreign-born population - New Zealand (%)
Place of birth for the foreign-born population - Fiji (%)
Place of birth for the foreign-born population - Micronesia (%)
Place of birth for the foreign-born population - Bahamas (%)
Place of birth for the foreign-born population - Barbados (%)
Place of birth for the foreign-born population - Cuba (%)
Place of birth for the foreign-born population - Dominica (%)
Place of birth for the foreign-born population - Dominican Republic (%)
Place of birth for the foreign-born population - Grenada (%)
Place of birth for the foreign-born population - Haiti (%)
Place of birth for the foreign-born population - Jamaica (%)
Place of birth for the foreign-born population - St. Vincent and the Grenadines (%)
Place of birth for the foreign-born population - Trinidad and Tobago (%)
Place of birth for the foreign-born population - West Indies (%)
Place of birth for the foreign-born population - Other Caribbean (%)
Place of birth for the foreign-born population - Belize (%)
Place of birth for the foreign-born population - Costa Rica (%)
Place of birth for the foreign-born population - El Salvador (%)
Place of birth for the foreign-born population - Guatemala (%)
Place of birth for the foreign-born population - Honduras (%)
Place of birth for the foreign-born population - Mexico (%)
Place of birth for the foreign-born population - Nicaragua (%)
Place of birth for the foreign-born population - Panama (%)
Place of birth for the foreign-born population - Other Central America (%)
Place of birth for the foreign-born population - Argentina (%)
Place of birth for the foreign-born population - Bolivia (%)
Place of birth for the foreign-born population - Brazil (%)
Place of birth for the foreign-born population - Chile (%)
Place of birth for the foreign-born population - Colombia (%)
Place of birth for the foreign-born population - Ecuador (%)
Place of birth for the foreign-born population - Guyana (%)
Place of birth for the foreign-born population - Peru (%)
Place of birth for the foreign-born population - Uruguay (%)
Place of birth for the foreign-born population - Venezuela (%)
Place of birth for the foreign-born population - Other South America (%)
Place of birth for the foreign-born population - Canada (%)
Place of birth for the foreign-born population - Other Northern America (%)
Place of birth for the foreign-born population - Other (%)
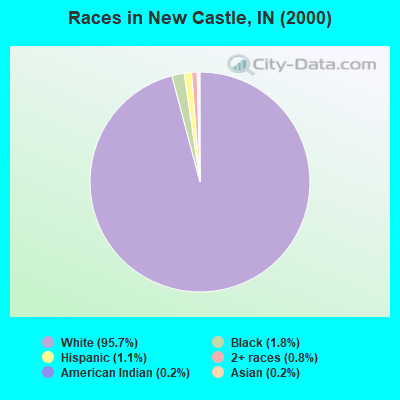
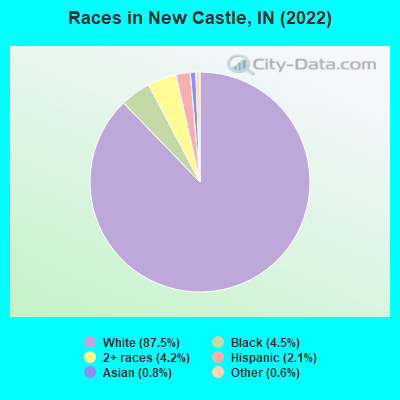
According to 2022 data, the most numerous races in New Castle, IN are White alone (15,341 residents), Black alone (782 residents), and Hispanic (375 residents). 97.5% of New Castle residents speak English at home. 1.1% of New Castle, IN residents are foreign-born , which is 428.8% less than the foreign-born rate of 6.0% across the entire state of Indiana.
Race distribution in New Castle
2000 2022
5,219,373 85.8% White alone 505,462 8.3% Black alone 214,536 3.5% Hispanic 61,115 1.0% Two or more races 58,424 1.0% Asian alone 13,654 0.2% American Indian alone 6,348 0.1% Other race alone 1,573 0.03% Native Hawaiian and Other
5,192,455 76.0% White alone 628,054 9.2% Black alone 534,528 7.8% Hispanic 263,242 3.9% Two or more races 172,880 2.5% Asian alone 33,467 0.5% Other race alone 5,866 0.09% American Indian alone 2,545 0.04% Native Hawaiian and Other
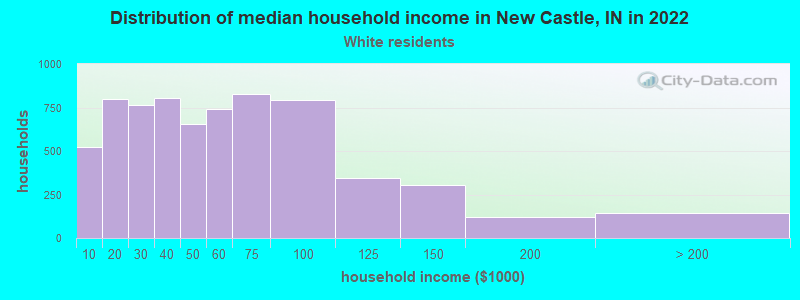
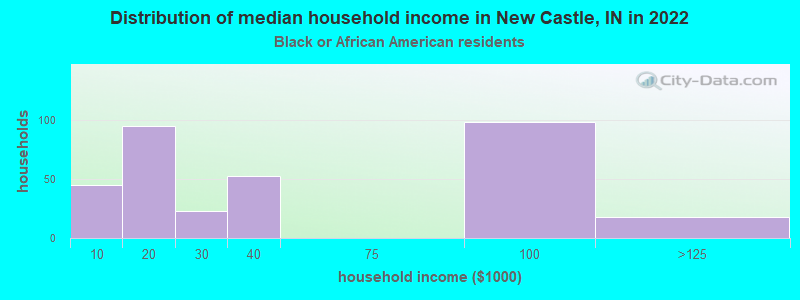
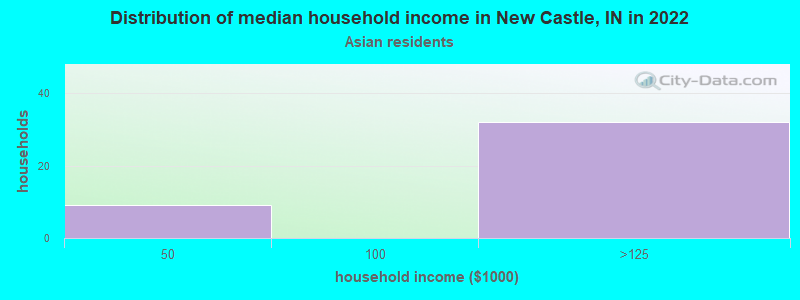
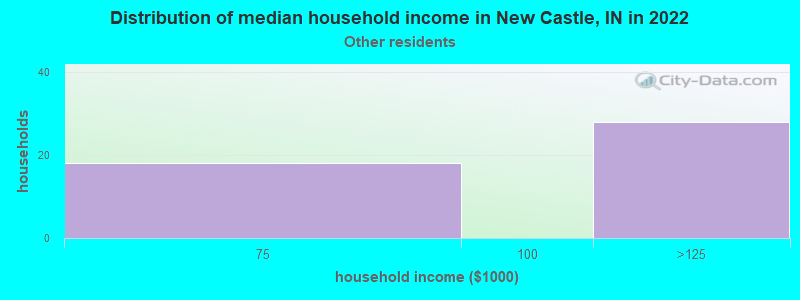
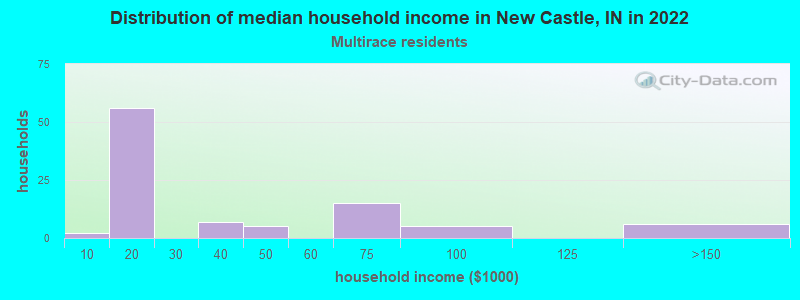
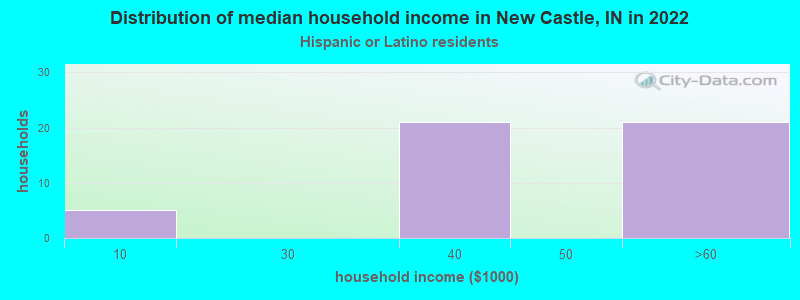
Income and house value in New Castle Median household income in 2022 $47,379 White non-Hispanic householders$118,165 Asian householdersMedian 2022 house value $104,186 White Non-Hispanic householders$131,003 Black or African American householders$115,591 American Indian or Alaska Native householders$61,186 Some other race householders$196,967 Two or more races householders$61,186 Hispanic or Latino householders
Median age by race in New Castle
42.5 Median age for White residents40.0 45.3 45.3 Median age for Black or African American residents44.7 45.3 -558,797,523.8 Median age for American Indian / Alaska Native residents-654,255,318.5 -491,600,353.2 42.9 Median age for Asian residents48.5 41.6 -664,335,663.7 Median age for Native Hawaiian / Pacific Islander residents-644,025,156.6 -664,437,011.6 42.8 Median age for Other race residents25.8 44.1 19.2 Median age for Two or more races residents17.4 33.5 42.8 Median age for White alone residents40.4 44.9 22.2 Median age for Hispanic or Latino residents12.3 31.2
Owner/renter occupied households by race in New Castle
House owners and renters - White residents 4,403 65.1% Owner occupied2,365 34.9% Renter occupiedHouse owners and renters - Black or African American residents 100 31.0% Owner occupied222 69.0% Renter occupiedHouse owners and renters - American Indian / Alaska Native residents 4 100.0% Owner occupiedHouse owners and renters - Asian residents 43 100.0% Owner occupiedHouse owners and renters - Other race residents 27 57.1% Owner occupied20 42.9% Renter occupiedHouse owners and renters - Two or more races residents 53 55.3% Owner occupied43 44.7% Renter occupiedHouse owners and renters - White alone residents 4,434 65.2% Owner occupied2,364 34.8% Renter occupiedHouse owners and renters - Hispanic or Latino residents 5 10.2% Owner occupied47 89.8% Renter occupied
Language usage in New Castle
English speakers - Total 97.5% of residents of New Castle speak English at home.
0.8% of residents speak Spanish at home 89 64.5% Speak English very well49 35.5% Speak English less than very well0.9% of residents speak other language at home 65 40.9% Speak English very well94 59.1% Speak English less than very well
English speakers - Born in the United States 97.3% of residents of New Castle speak English at home.
2.0% of residents speak Spanish at home 43 61.4% Speak English very well27 38.6% Speak English less than very well0.2% of residents speak other language at home 8 100.0% Speak English very well
All residents speak only English at home
English speakers - Foreign-born 31.0% of residents of New Castle speak English at home.
9.0% of residents speak Spanish at home 8 44.4% Speak English very well10 55.6% Speak English less than very well58.5% of residents speak other language at home 27 23.1% Speak English very well90 76.9% Speak English less than very well
White (Caucasian) - Speak only English Native:
99.3% (14,670)Foreign-born:
91.5% (35)
White (Caucasian) - Speak another language Native:
0.9% (129)Foreign-born:
20.0% (8)
Black or African American - Speak only English Native:
98.6% (737)Foreign-born:
68.2% (14)
Two or more races - Speak only English Native:
96.8% (710)Foreign-born:
26.8% (10)
Two or more races - Speak another language Native:
0.4% (3)Foreign-born:
74.2% (29)
White alone - Speak only English Native:
99.2% (14,587)Foreign-born:
73.1% (39)
White alone - Speak another language Native:
0.7% (99)Foreign-born:
22.7% (12)
Hispanic or Latino - Speak only English Native:
82.0% (262)Foreign-born:
26.0% (7)
Hispanic or Latino - Speak another language Native:
16.3% (52)Foreign-born:
74.7% (20)
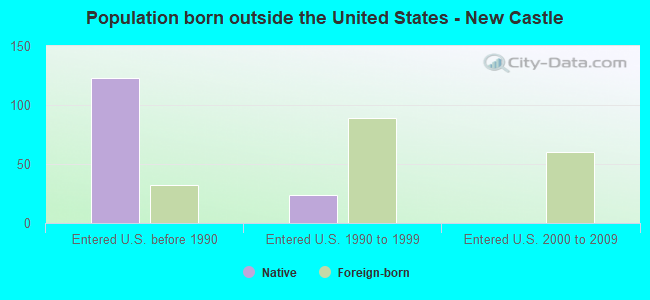
Foreign-born residents in New Castle 199 residents are foreign born
This city:
1.1%Indiana:
5.6%
Marital status for residents in New Castle Marital status - White (Caucasian) population 15 years and over
Males 35.0% Never married45.0% Now married2.3% Separated3.4% Widowed14.3% DivorcedFemales 26.4% Never married41.3% Now married2.3% Separated10.5% Widowed19.5% DivorcedWomen who gave birth in the past 12 months Now married:
29.9% (54)Unmarried:
70.1% (127)
Women who did not give birth in the past 12 months Now married:
42.0% (1,307)Unmarried:
58.0% (1,806)
Marital status - Black or African American population 15 years and over
Males 82.6% Never married4.1% Now married2.3% Separated1.4% Widowed9.5% DivorcedFemales 61.4% Never married38.6% Now married0.0% Separated0.0% Widowed0.0% DivorcedWomen who did not give birth in the past 12 months Now married:
0.0% (0)Unmarried:
100.0% (27)
Marital status - Asian population 15 years and over
Males 0.0% Never married80.0% Now married20.0% Separated0.0% Widowed0.0% DivorcedFemales 0.0% Never married73.8% Now married0.0% Separated26.2% Widowed0.0% DivorcedWomen who did not give birth in the past 12 months Now married:
73.8% (47)Unmarried:
26.2% (17)
Marital status - Other race population 15 years and over
Males 55.1% Never married44.9% Now married0.0% Separated0.0% Widowed0.0% DivorcedFemales 27.1% Never married61.4% Now married0.0% Separated11.4% Widowed0.0% DivorcedWomen who did not give birth in the past 12 months Now married:
52.5% (25)Unmarried:
47.5% (23)
Marital status - Two or more races population 15 years and over
Males 48.9% Never married33.9% Now married0.0% Separated0.0% Widowed17.2% DivorcedFemales 79.8% Never married6.1% Now married0.0% Separated12.6% Widowed1.5% DivorcedWomen who did not give birth in the past 12 months Now married:
5.3% (12)Unmarried:
94.7% (220)
Marital status - White alone, not Hispanic / Latino population 15 years and over
Males 34.6% Never married45.2% Now married2.3% Separated3.4% Widowed14.4% DivorcedFemales 26.6% Never married41.3% Now married2.3% Separated10.6% Widowed19.2% DivorcedWomen who gave birth in the past 12 months Now married:
22.0% (36)Unmarried:
78.0% (129)
Women who did not give birth in the past 12 months Now married:
42.0% (1,329)Unmarried:
58.0% (1,836)
Marital status - Hispanic or Latino population 15 years and over
Males 61.6% Never married29.3% Now married0.0% Separated0.0% Widowed9.1% DivorcedFemales 19.4% Never married45.9% Now married0.0% Separated8.2% Widowed26.5% DivorcedWomen who gave birth in the past 12 months Now married:
100.0% (20)Unmarried:
0.0% (0)
Women who did not give birth in the past 12 months Now married:
52.5% (23)Unmarried:
47.5% (20)
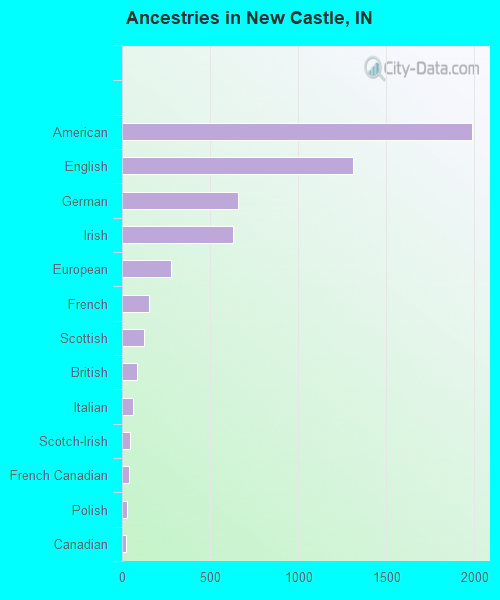
Ancestries in New Castle
1,985 25.6% American1,310 16.9% English660 8.5% German628 8.1% Irish281 3.6% European152 2.0% French125 1.6% Scottish84 1.1% British64 0.8% Italian47 0.6% Scotch-Irish42 0.5% French Canadian31 0.4% Polish22 0.3% Canadian17 0.2% Scandinavian15 0.2% Ethiopian13 0.2% German Russian10 0.1% Swedish7 0.09% Slovak3 0.04% Hungarian2 0.03% Welsh
Children Nativity (place of birth) in New Castle
Children under 6 years - Living with two parents Both parents native 349 100.0% NativeOne native, one foreign-born parent 6 100.0% NativeChildren under 6 years - Living with one parent Native parent 477 100.0% NativeChildren 6 to 17 years - Living with two parents Both parents native 1,259 98.6% Native17 1.4% Foreign-bornOne native, one foreign-born parent 221 100.0% NativeChildren 6 to 17 years - Living with one parent Native parent 889 100.0% NativeForeign-born parent 19 52.0% Native18 48.0% Foreign-born
Grandparents responsible for own grandchildren in New Castle
Grandparents (30 to 59 years) White / Caucasian 102 67.1% Responsible for grandchildren50 32.9% Not responsible for grandchildrenTwo or more races 2 100.0% Not responsible for grandchildrenWhite alone, not Hispanic / Latino 105 66.5% Responsible for grandchildren53 33.5% Not responsible for grandchildrenGrandparents (60 years and over) White / Caucasian 61 32.1% Responsible for grandchildren128 67.9% Not responsible for grandchildrenWhite alone, not Hispanic / Latino 61 32.0% Responsible for grandchildren130 68.0% Not responsible for grandchildren