Races in New Hope, Minnesota (MN) Detailed Stats
Data:
Races - White alone (%)
Races - White alone (% change since 2000)
Races - Black alone (%)
Races - Black alone (% change since 2000)
Races - American Indian alone (%)
Races - American Indian alone (% change since 2000)
Races - Asian alone (%)
Races - Asian alone (% change since 2000)
Races - Hispanic (%)
Races - Hispanic (% change since 2000)
Races - Native Hawaiian and Other Pacific Islander alone (%)
Races - Native Hawaiian and Other Pacific Islander alone (% change since 2000)
Races - Two or more races(%)
Races - Two or more races(% change since 2000)
Races - Other race alone (%)
Races - Other race alone (% change since 2000)
Racial diversity
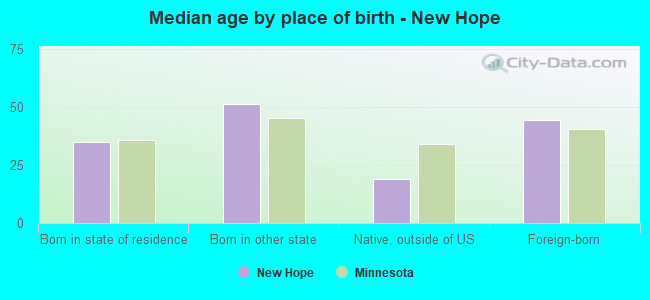
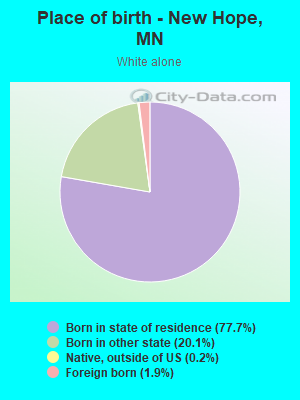
Place of birth - Born in state of residence (%)
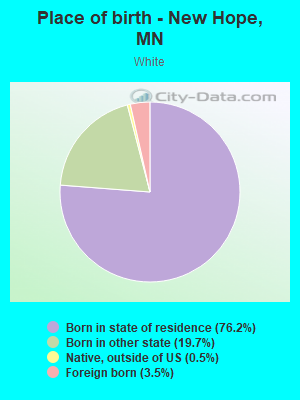
Place of birth - Born in state of residence (%) - White
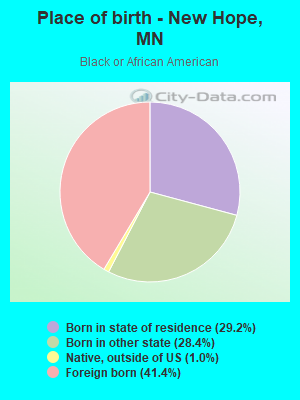
Place of birth - Born in state of residence (%) - Black or African American
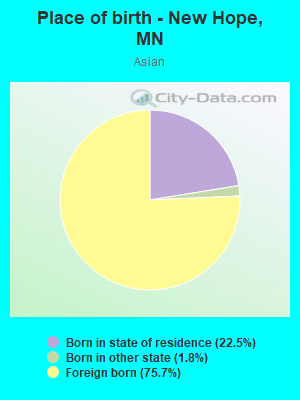
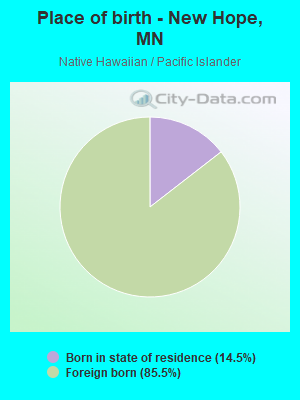
Place of birth - Born in state of residence (%) - Asian
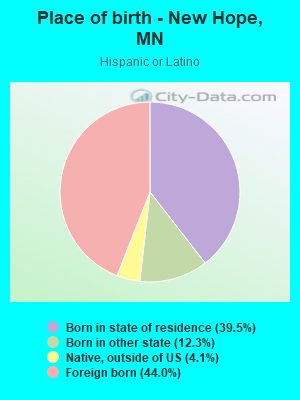
Place of birth - Born in state of residence (%) - Hispanic or Latino
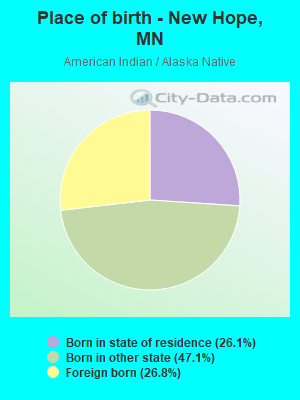
Place of birth - Born in state of residence (%) - American Indian and Alaska Native
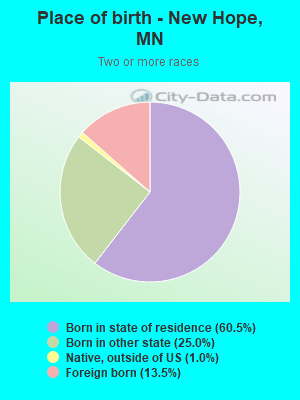
Place of birth - Born in state of residence (%) - Multirace
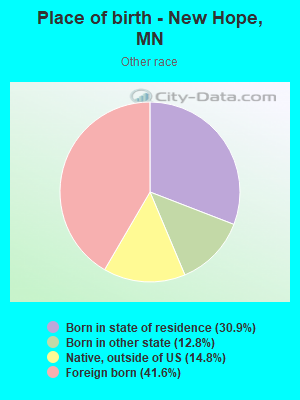
Place of birth - Born in state of residence (%) - Other Race
Place of birth - Born in other state (%)
Place of birth - Born in other state (%) - White
Place of birth - Born in other state (%) - Black or African American
Place of birth - Born in other state (%) - Asian
Place of birth - Born in other state (%) - Hispanic or Latino
Place of birth - Born in other state (%) - American Indian and Alaska Native
Place of birth - Born in other state (%) - Multirace
Place of birth - Born in other state (%) - Other Race
Place of birth - Native, outside of US (%)
Place of birth - Native, outside of US (%) - White
Place of birth - Native, outside of US (%) - Black or African American
Place of birth - Native, outside of US (%) - Asian
Place of birth - Native, outside of US (%) - Hispanic or Latino
Place of birth - Native, outside of US (%) - American Indian and Alaska Native
Place of birth - Native, outside of US (%) - Multirace
Place of birth - Native, outside of US (%) - Other Race
Place of birth - Foreign born (%)
Place of birth - Foreign born (%) - White
Place of birth - Foreign born (%) - Black or African American
Place of birth - Foreign born (%) - Asian
Place of birth - Foreign born (%) - Hispanic or Latino
Place of birth - Foreign born (%) - American Indian and Alaska Native
Place of birth - Foreign born (%) - Multirace
Place of birth - Foreign born (%) - Other Race
Residents speaking English at home (%)
Residents speaking English at home - Born in the United States (%)
Residents speaking English at home - Native, born elsewhere (%)
Residents speaking English at home - Foreign born (%)
Residents speaking Spanish at home (%)
Residents speaking Spanish at home - Born in the United States (%)
Residents speaking Spanish at home - Native, born elsewhere (%)
Residents speaking Spanish at home - Foreign born (%)
Residents speaking other language at home (%)
Residents speaking other language at home - Born in the United States (%)
Residents speaking other language at home - Native, born elsewhere (%)
Residents speaking other language at home - Foreign born (%)
Marital status - Never married (%)
Marital status - Now married (%)
Marital status - Separated (%)
Marital status - Widowed (%)
Marital status - Divorced (%)
Ancestries Reported - Arab (%)
Ancestries Reported - Czech (%)
Ancestries Reported - Danish (%)
Ancestries Reported - Dutch (%)
Ancestries Reported - English (%)
Ancestries Reported - French (%)
Ancestries Reported - French Canadian (%)
Ancestries Reported - German (%)
Ancestries Reported - Greek (%)
Ancestries Reported - Hungarian (%)
Ancestries Reported - Irish (%)
Ancestries Reported - Italian (%)
Ancestries Reported - Lithuanian (%)
Ancestries Reported - Norwegian (%)
Ancestries Reported - Polish (%)
Ancestries Reported - Portuguese (%)
Ancestries Reported - Russian (%)
Ancestries Reported - Scotch-Irish (%)
Ancestries Reported - Scottish (%)
Ancestries Reported - Slovak (%)
Ancestries Reported - Subsaharan African (%)
Ancestries Reported - Swedish (%)
Ancestries Reported - Swiss (%)
Ancestries Reported - Ukrainian (%)
Ancestries Reported - United States (%)
Ancestries Reported - Welsh (%)
Ancestries Reported - West Indian (%)
Ancestries Reported - Other (%)
Geographical mobility - Same house 1 year ago (%)
Geographical mobility - Same house 1 year ago (%) - White
Geographical mobility - Same house 1 year ago (%) - Black or African American
Geographical mobility - Same house 1 year ago (%) - Asian
Geographical mobility - Same house 1 year ago (%) - Hispanic or Latino
Geographical mobility - Same house 1 year ago (%) - American Indian and Alaska Native
Geographical mobility - Same house 1 year ago (%) - Multirace
Geographical mobility - Same house 1 year ago (%) - Other Race
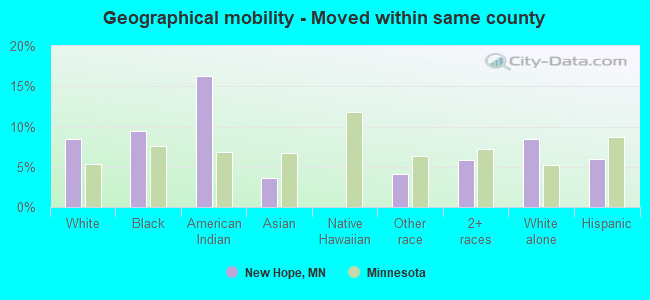
Geographical mobility - Moved within same county (%)
Geographical mobility - Moved within same county (%) - White
Geographical mobility - Moved within same county (%) - Black or African American
Geographical mobility - Moved within same county (%) - Asian
Geographical mobility - Moved within same county (%) - Hispanic or Latino
Geographical mobility - Moved within same county (%) - American Indian and Alaska Native
Geographical mobility - Moved within same county (%) - Multirace
Geographical mobility - Moved within same county (%) - Other Race
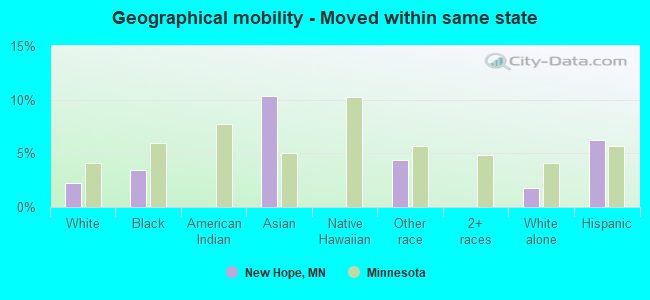
Geographical mobility - Moved from different county within same state (%)
Geographical mobility - Moved from different county within same state (%) - White
Geographical mobility - Moved from different county within same state (%) - Black or African American
Geographical mobility - Moved from different county within same state (%) - Asian
Geographical mobility - Moved from different county within same state (%) - Hispanic or Latino
Geographical mobility - Moved from different county within same state (%) - American Indian and Alaska Native
Geographical mobility - Moved from different county within same state (%) - Multirace
Geographical mobility - Moved from different county within same state (%) - Other Race
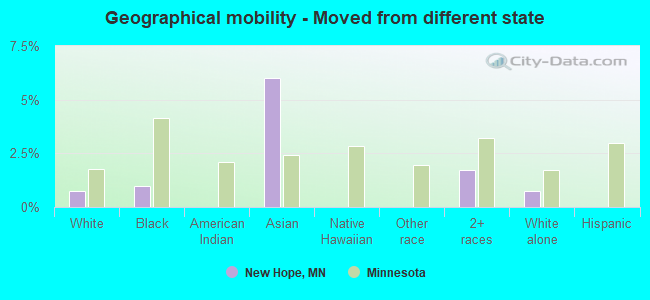
Geographical mobility - Moved from different state (%)
Geographical mobility - Moved from different state (%) - White
Geographical mobility - Moved from different state (%) - Black or African American
Geographical mobility - Moved from different state (%) - Asian
Geographical mobility - Moved from different state (%) - Hispanic or Latino
Geographical mobility - Moved from different state (%) - American Indian and Alaska Native
Geographical mobility - Moved from different state (%) - Multirace
Geographical mobility - Moved from different state (%) - Other Race
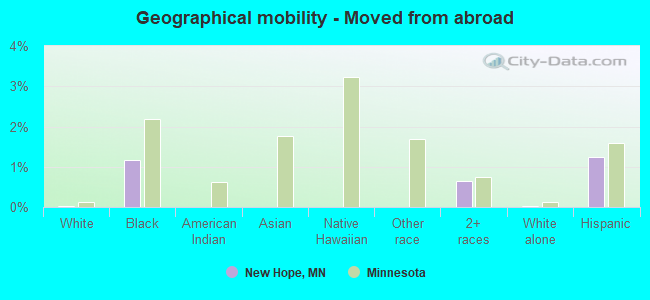
Geographical mobility - Moved from abroad (%)
Geographical mobility - Moved from abroad (%) - White
Geographical mobility - Moved from abroad (%) - Black or African American
Geographical mobility - Moved from abroad (%) - Asian
Geographical mobility - Moved from abroad (%) - Hispanic or Latino
Geographical mobility - Moved from abroad (%) - American Indian and Alaska Native
Geographical mobility - Moved from abroad (%) - Multirace
Geographical mobility - Moved from abroad (%) - Other Race
Place of birth for the foreign-born population - Ireland (%)
Place of birth for the foreign-born population - Denmark (%)
Place of birth for the foreign-born population - Norway (%)
Place of birth for the foreign-born population - Sweden (%)
Place of birth for the foreign-born population - United Kingdom (%)
Place of birth for the foreign-born population - England (%)
Place of birth for the foreign-born population - Scotland (%)
Place of birth for the foreign-born population - Other Northern Europe (%)
Place of birth for the foreign-born population - Austria (%)
Place of birth for the foreign-born population - Belgium (%)
Place of birth for the foreign-born population - France (%)
Place of birth for the foreign-born population - Germany (%)
Place of birth for the foreign-born population - Netherlands (%)
Place of birth for the foreign-born population - Switzerland (%)
Place of birth for the foreign-born population - Other Western Europe (%)
Place of birth for the foreign-born population - Greece (%)
Place of birth for the foreign-born population - Italy (%)
Place of birth for the foreign-born population - Portugal (%)
Place of birth for the foreign-born population - Spain (%)
Place of birth for the foreign-born population - Other Southern Europe (%)
Place of birth for the foreign-born population - Albania (%)
Place of birth for the foreign-born population - Belarus (%)
Place of birth for the foreign-born population - Bosnia and Herzegovina (%)
Place of birth for the foreign-born population - Bulgaria (%)
Place of birth for the foreign-born population - Croatia (%)
Place of birth for the foreign-born population - Czechoslovakia (%)
Place of birth for the foreign-born population - Hungary (%)
Place of birth for the foreign-born population - Latvia (%)
Place of birth for the foreign-born population - Lithuania (%)
Place of birth for the foreign-born population - North Macedonia (Macedonia) (%)
Place of birth for the foreign-born population - Moldova (%)
Place of birth for the foreign-born population - Poland (%)
Place of birth for the foreign-born population - Romania (%)
Place of birth for the foreign-born population - Russia (%)
Place of birth for the foreign-born population - Serbia (%)
Place of birth for the foreign-born population - Ukraine (%)
Place of birth for the foreign-born population - Other Eastern Europe (%)
Place of birth for the foreign-born population - China (%)
Place of birth for the foreign-born population - Hong Kong (%)
Place of birth for the foreign-born population - Taiwan (%)
Place of birth for the foreign-born population - Japan (%)
Place of birth for the foreign-born population - Korea (%)
Place of birth for the foreign-born population - Other Eastern Asia (%)
Place of birth for the foreign-born population - Afghanistan (%)
Place of birth for the foreign-born population - Bangladesh (%)
Place of birth for the foreign-born population - India (%)
Place of birth for the foreign-born population - Iran (%)
Place of birth for the foreign-born population - Kazakhstan (%)
Place of birth for the foreign-born population - Nepal (%)
Place of birth for the foreign-born population - Pakistan (%)
Place of birth for the foreign-born population - Sri Lanka (%)
Place of birth for the foreign-born population - Uzbekistan (%)
Place of birth for the foreign-born population - Other South Central Asia (%)
Place of birth for the foreign-born population - Burma (%)
Place of birth for the foreign-born population - Cambodia (%)
Place of birth for the foreign-born population - Indonesia (%)
Place of birth for the foreign-born population - Laos (%)
Place of birth for the foreign-born population - Malaysia (%)
Place of birth for the foreign-born population - Philippines (%)
Place of birth for the foreign-born population - Singapore (%)
Place of birth for the foreign-born population - Thailand (%)
Place of birth for the foreign-born population - Vietnam (%)
Place of birth for the foreign-born population - Other South Eastern Asia (%)
Place of birth for the foreign-born population - Armenia (%)
Place of birth for the foreign-born population - Iraq (%)
Place of birth for the foreign-born population - Israel (%)
Place of birth for the foreign-born population - Jordan (%)
Place of birth for the foreign-born population - Kuwait (%)
Place of birth for the foreign-born population - Lebanon (%)
Place of birth for the foreign-born population - Saudi Arabia (%)
Place of birth for the foreign-born population - Syria (%)
Place of birth for the foreign-born population - Turkey (%)
Place of birth for the foreign-born population - Yemen (%)
Place of birth for the foreign-born population - Other Western Asia (%)
Place of birth for the foreign-born population - Eritrea (%)
Place of birth for the foreign-born population - Ethiopia (%)
Place of birth for the foreign-born population - Kenya (%)
Place of birth for the foreign-born population - Somalia (%)
Place of birth for the foreign-born population - Uganda (%)
Place of birth for the foreign-born population - Zimbabwe (%)
Place of birth for the foreign-born population - Other Eastern Africa (%)
Place of birth for the foreign-born population - Cameroon (%)
Place of birth for the foreign-born population - Congo (%)
Place of birth for the foreign-born population - Democratic Republic of Congo (Zaire) (%)
Place of birth for the foreign-born population - Other Middle Africa (%)
Place of birth for the foreign-born population - Egypt (%)
Place of birth for the foreign-born population - Morocco (%)
Place of birth for the foreign-born population - Sudan (%)
Place of birth for the foreign-born population - Other Northern Africa (%)
Place of birth for the foreign-born population - South Africa (%)
Place of birth for the foreign-born population - Other Southern Africa (%)
Place of birth for the foreign-born population - Cabo Verde (%)
Place of birth for the foreign-born population - Ghana (%)
Place of birth for the foreign-born population - Liberia (%)
Place of birth for the foreign-born population - Nigeria (%)
Place of birth for the foreign-born population - Senegal (%)
Place of birth for the foreign-born population - Sierra Leone (%)
Place of birth for the foreign-born population - Other Western Africa (%)
Place of birth for the foreign-born population - Australia (%)
Place of birth for the foreign-born population - New Zealand (%)
Place of birth for the foreign-born population - Fiji (%)
Place of birth for the foreign-born population - Micronesia (%)
Place of birth for the foreign-born population - Bahamas (%)
Place of birth for the foreign-born population - Barbados (%)
Place of birth for the foreign-born population - Cuba (%)
Place of birth for the foreign-born population - Dominica (%)
Place of birth for the foreign-born population - Dominican Republic (%)
Place of birth for the foreign-born population - Grenada (%)
Place of birth for the foreign-born population - Haiti (%)
Place of birth for the foreign-born population - Jamaica (%)
Place of birth for the foreign-born population - St. Vincent and the Grenadines (%)
Place of birth for the foreign-born population - Trinidad and Tobago (%)
Place of birth for the foreign-born population - West Indies (%)
Place of birth for the foreign-born population - Other Caribbean (%)
Place of birth for the foreign-born population - Belize (%)
Place of birth for the foreign-born population - Costa Rica (%)
Place of birth for the foreign-born population - El Salvador (%)
Place of birth for the foreign-born population - Guatemala (%)
Place of birth for the foreign-born population - Honduras (%)
Place of birth for the foreign-born population - Mexico (%)
Place of birth for the foreign-born population - Nicaragua (%)
Place of birth for the foreign-born population - Panama (%)
Place of birth for the foreign-born population - Other Central America (%)
Place of birth for the foreign-born population - Argentina (%)
Place of birth for the foreign-born population - Bolivia (%)
Place of birth for the foreign-born population - Brazil (%)
Place of birth for the foreign-born population - Chile (%)
Place of birth for the foreign-born population - Colombia (%)
Place of birth for the foreign-born population - Ecuador (%)
Place of birth for the foreign-born population - Guyana (%)
Place of birth for the foreign-born population - Peru (%)
Place of birth for the foreign-born population - Uruguay (%)
Place of birth for the foreign-born population - Venezuela (%)
Place of birth for the foreign-born population - Other South America (%)
Place of birth for the foreign-born population - Canada (%)
Place of birth for the foreign-born population - Other Northern America (%)
Place of birth for the foreign-born population - Other (%)
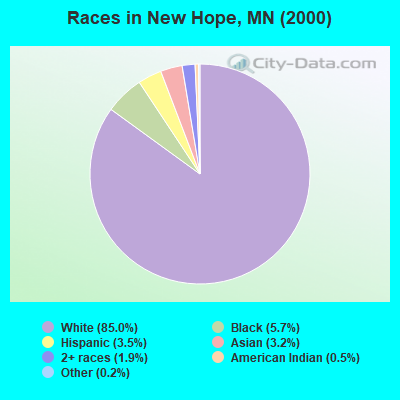
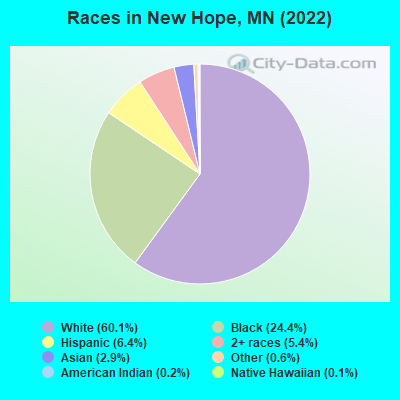
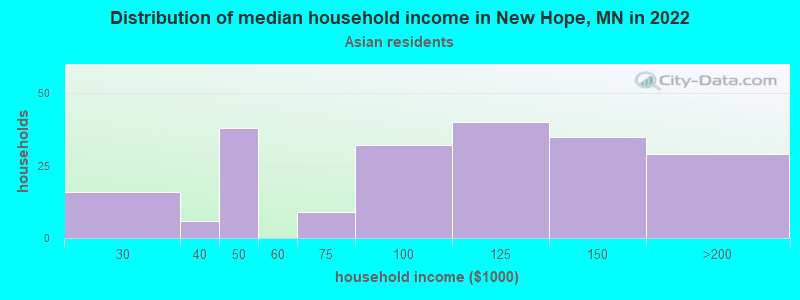
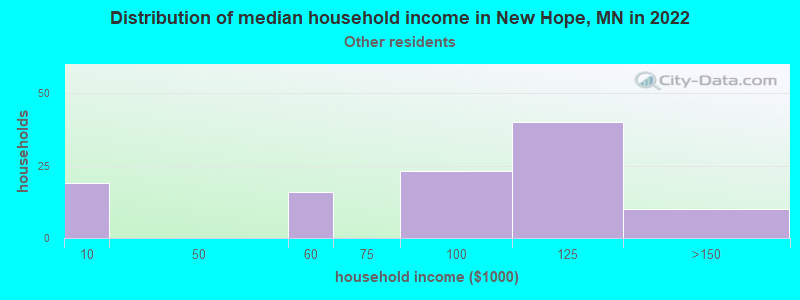
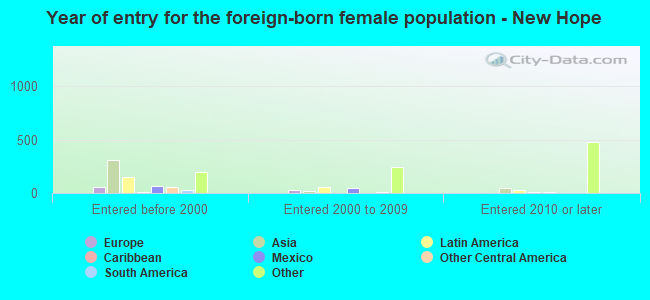
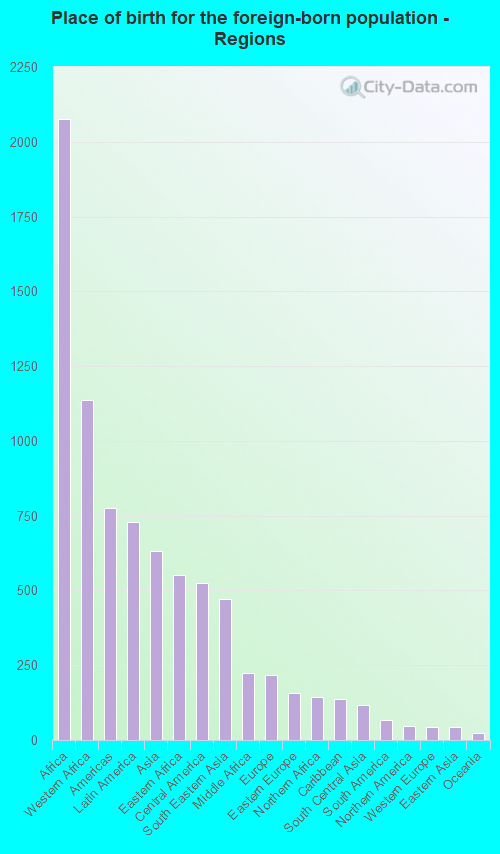
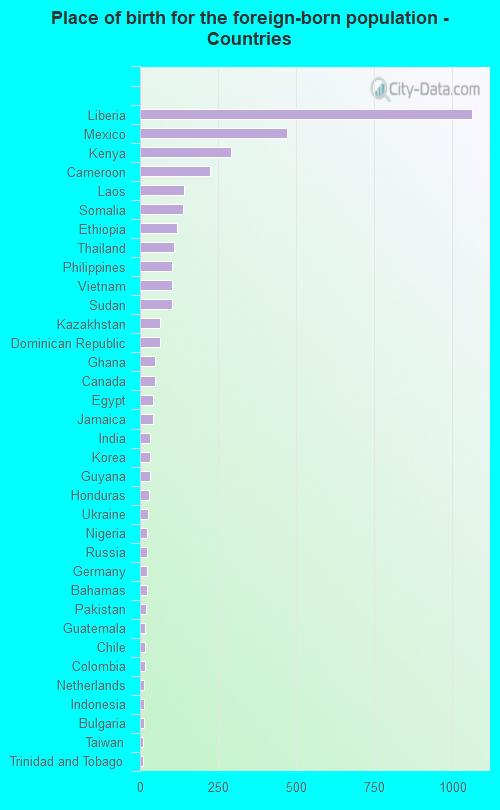
According to 2022 data, the most numerous races in New Hope, MN are White alone (12,881 residents), Black alone (5,227 residents), and Hispanic (1,376 residents). 84.0% of New Hope residents speak English at home. 17.4% of New Hope, MN residents are foreign-born (9.3% born in Africa, 3.3% born in Latin America, 2.8% born in Asia), which is 54.0% greater than the foreign-born rate of 8.0% across the entire state of Minnesota.
Race distribution in New Hope
2000 2022
4,337,143 88.2% White alone 168,813 3.4% Black alone 143,382 2.9% Hispanic 141,083 2.9% Asian alone 70,304 1.4% Two or more races 52,009 1.1% American Indian alone 5,031 0.1% Other race alone 1,714 0.03% Native Hawaiian and Other
4,356,347 76.2% White alone 395,179 6.9% Black alone 333,830 5.8% Hispanic 294,800 5.2% Asian alone 259,649 4.5% Two or more races 42,125 0.7% American Indian alone 32,976 0.6% Other race alone 2,278 0.04% Native Hawaiian and Other
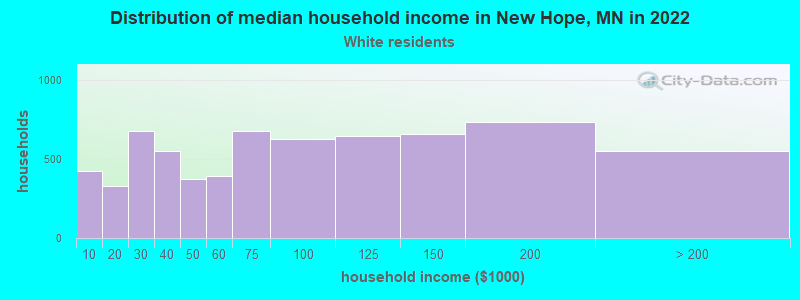
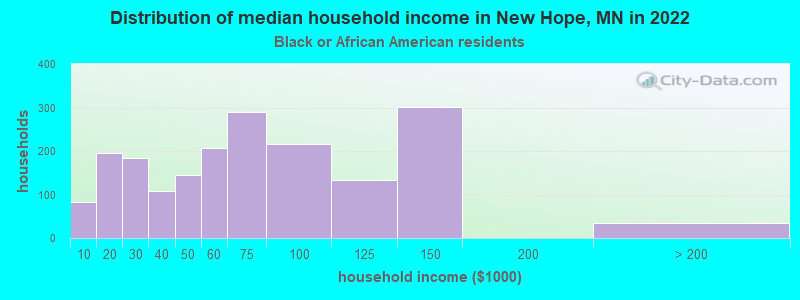
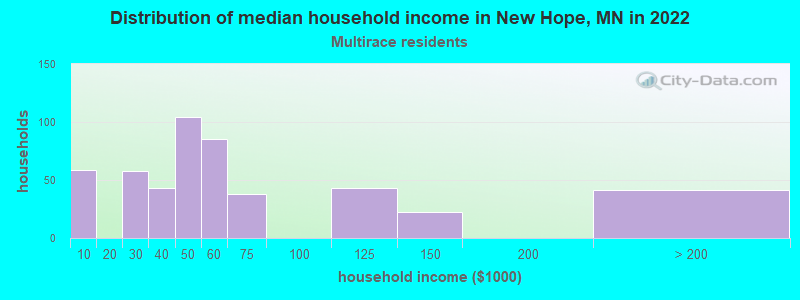
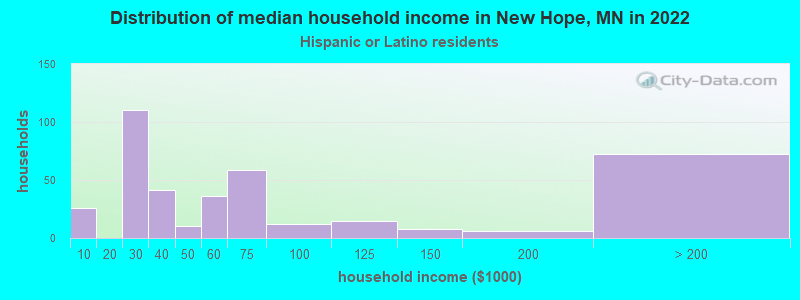
Income and house value in New Hope Median household income in 2022 $73,242 White non-Hispanic householders$62,819 Black householders$98,018 Asian householders$102,974 Some other race householders$42,519 Two or more races householders$53,867 Hispanic or Latino race householdersMedian 2022 house value $312,144 White Non-Hispanic householders$289,309 Black or African American householders$205,508 American Indian or Alaska Native householders $305,750 Asian householders$302,553 Some other race householders$313,970 Two or more races householders$342,513 Hispanic or Latino householders
Median age by race in New Hope
47.9 Median age for White residents48.8 47.0 33.5 Median age for Black or African American residents38.0 25.9 31.2 Median age for American Indian / Alaska Native residents19.5 32.3 46.6 Median age for Asian residents45.7 53.4 -790,303,029.5 Median age for Native Hawaiian / Pacific Islander residents-856,799,036.4 -365,948,037.2 29.0 Median age for Other race residents50.2 27.6 22.2 Median age for Two or more races residents26.5 23.7 48.9 Median age for White alone residents49.8 48.0 28.7 Median age for Hispanic or Latino residents34.1 24.4
Owner/renter occupied households by race in New Hope
House owners and renters - White residents 4,049 61.7% Owner occupied2,517 38.3% Renter occupiedHouse owners and renters - Black or African American residents 571 29.4% Owner occupied1,373 70.6% Renter occupiedHouse owners and renters - American Indian / Alaska Native residents 5 100.0% Owner occupiedHouse owners and renters - Asian residents 96 45.4% Owner occupied115 54.6% Renter occupiedHouse owners and renters - Other race residents 55 45.8% Owner occupied65 54.2% Renter occupiedHouse owners and renters - Two or more races residents 135 26.0% Owner occupied385 74.0% Renter occupiedHouse owners and renters - White alone residents 4,028 63.5% Owner occupied2,318 36.5% Renter occupiedHouse owners and renters - Hispanic or Latino residents 67 14.2% Owner occupied402 85.8% Renter occupied
Language usage in New Hope
English speakers - Total 84.0% of residents of New Hope speak English at home.
4.7% of residents speak Spanish at home 674 71.0% Speak English very well275 29.0% Speak English less than very well11.1% of residents speak other language at home 1,481 66.5% Speak English very well746 33.5% Speak English less than very well
English speakers - Born in the United States 96.1% of residents of New Hope speak English at home.
2.1% of residents speak Spanish at home 93 100.0% Speak English very well1.0% of residents speak other language at home 46 100.0% Speak English very well
English speakers - Native, born elsewhere 61.0% of residents of New Hope speak English at home.
31.6% of residents speak other language at home 49 87.5% Speak English very well7 12.5% Speak English less than very well
English speakers - Foreign-born 30.8% of residents of New Hope speak English at home.
14.6% of residents speak Spanish at home 289 56.6% Speak English very well222 43.4% Speak English less than very well53.2% of residents speak other language at home 1,202 64.8% Speak English very well654 35.2% Speak English less than very well
White (Caucasian) - Speak only English Native:
97.2% (12,157)Foreign-born:
23.5% (112)
White (Caucasian) - Speak another language Native:
2.8% (350)Foreign-born:
70.1% (334)
Black or African American - Speak only English Native:
90.5% (2,263)Foreign-born:
30.2% (661)
Black or African American - Speak another language Native:
5.7% (142)Foreign-born:
63.6% (1,392)
Asian - Speak only English Native:
48.0% (68)Foreign-born:
24.3% (114)
Asian - Speak another language Native:
52.7% (75)Foreign-born:
75.9% (355)
Native Hawaiian / Pacific Islander - Speak another language Native:
84.8% (7)Foreign-born:
91.2% (44)
Other race - Speak only English Native:
82.0% (162)Foreign-born:
14.1% (25)
Other race - Speak another language Native:
25.5% (50)Foreign-born:
85.9% (151)
Two or more races - Speak only English Native:
81.7% (799)Foreign-born:
27.8% (53)
Two or more races - Speak another language Native:
17.3% (170)Foreign-born:
73.1% (139)
White alone - Speak only English Native:
98.3% (11,960)Foreign-born:
40.1% (100)
White alone - Speak another language Native:
1.8% (219)Foreign-born:
58.5% (146)
Hispanic or Latino - Speak only English Native:
55.6% (344)Foreign-born:
14.5% (88)
Hispanic or Latino - Speak another language Native:
44.6% (276)Foreign-born:
85.7% (520)
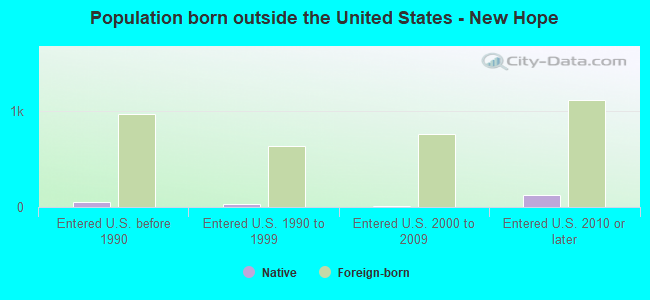
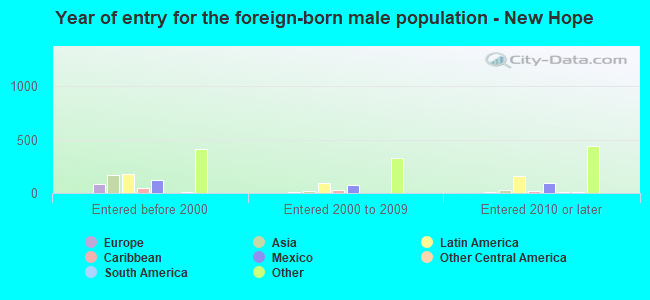
Foreign-born residents in New Hope 3,726 residents are foreign born (9.3% Africa , 3.3% Latin America , 2.8% Asia ).
This city:
17.4%Minnesota:
8.5%
Marital status for residents in New Hope Marital status - White (Caucasian) population 15 years and over
Males 34.5% Never married47.0% Now married0.6% Separated2.7% Widowed15.3% DivorcedFemales 26.2% Never married45.9% Now married1.0% Separated13.4% Widowed13.5% DivorcedWomen who gave birth in the past 12 months Now married:
79.1% (144)Unmarried:
20.9% (38)
Women who did not give birth in the past 12 months Now married:
45.1% (1,239)Unmarried:
54.9% (1,511)
Marital status - Black or African American population 15 years and over
Males 39.2% Never married49.1% Now married0.0% Separated0.7% Widowed11.0% DivorcedFemales 42.9% Never married38.6% Now married2.9% Separated2.6% Widowed13.1% DivorcedWomen who gave birth in the past 12 months Now married:
100.0% (75)Unmarried:
0.0% (0)
Women who did not give birth in the past 12 months Now married:
37.4% (440)Unmarried:
62.6% (736)
Marital status - American Indian / Alaska Native population 15 years and over
Males 59.1% Never married0.0% Now married0.0% Separated0.0% Widowed40.9% DivorcedFemales 62.7% Never married27.1% Now married0.0% Separated0.0% Widowed10.2% DivorcedWomen who did not give birth in the past 12 months Now married:
0.0% (0)Unmarried:
100.0% (39)
Marital status - Asian population 15 years and over
Males 52.2% Never married41.7% Now married5.7% Separated0.0% Widowed0.4% DivorcedFemales 23.8% Never married51.3% Now married2.8% Separated12.0% Widowed10.1% DivorcedWomen who did not give birth in the past 12 months Now married:
53.4% (95)Unmarried:
46.6% (83)
Marital status - Other race population 15 years and over
Males 24.2% Never married60.6% Now married0.0% Separated15.2% Widowed0.0% DivorcedFemales 51.0% Never married27.3% Now married0.0% Separated21.6% Widowed0.0% DivorcedWomen who gave birth in the past 12 months Now married:
38.5% (10)Unmarried:
61.5% (16)
Women who did not give birth in the past 12 months Now married:
23.9% (27)Unmarried:
76.1% (85)
Marital status - Two or more races population 15 years and over
Males 48.1% Never married19.7% Now married2.0% Separated0.0% Widowed30.2% DivorcedFemales 54.0% Never married29.9% Now married0.0% Separated0.0% Widowed16.2% DivorcedWomen who did not give birth in the past 12 months Now married:
18.1% (50)Unmarried:
81.9% (224)
Marital status - White alone, not Hispanic / Latino population 15 years and over
Males 32.9% Never married48.5% Now married0.7% Separated2.9% Widowed15.1% DivorcedFemales 26.0% Never married45.3% Now married1.1% Separated13.6% Widowed14.0% DivorcedWomen who gave birth in the past 12 months Now married:
76.5% (126)Unmarried:
23.5% (39)
Women who did not give birth in the past 12 months Now married:
43.9% (1,156)Unmarried:
56.1% (1,475)
Marital status - Hispanic or Latino population 15 years and over
Males 43.7% Never married38.7% Now married0.0% Separated0.0% Widowed17.6% DivorcedFemales 46.3% Never married49.9% Now married0.0% Separated3.9% Widowed0.0% DivorcedWomen who gave birth in the past 12 months Now married:
66.0% (32)Unmarried:
34.0% (17)
Women who did not give birth in the past 12 months Now married:
44.9% (137)Unmarried:
55.1% (168)
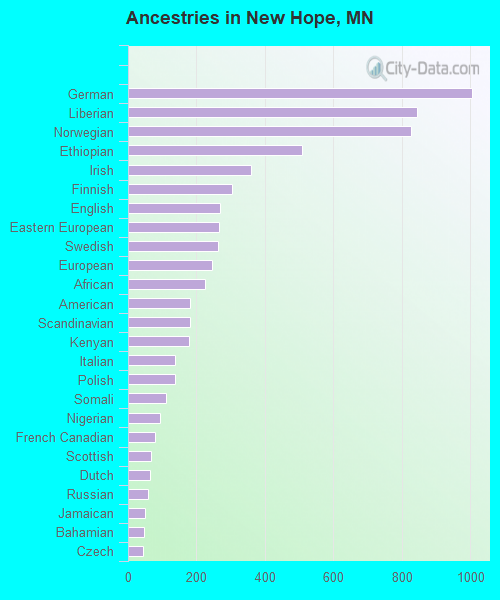
Ancestries in New Hope
1,004 9.8% German845 8.3% Liberian826 8.1% Norwegian508 5.0% Ethiopian358 3.5% Irish303 3.0% Finnish269 2.6% English265 2.6% Eastern European264 2.6% Swedish244 2.4% European226 2.2% African181 1.8% American180 1.8% Scandinavian179 1.7% Kenyan138 1.3% Italian136 1.3% Polish110 1.1% Somali93 0.9% Nigerian79 0.8% French Canadian66 0.6% Scottish63 0.6% Dutch59 0.6% Russian50 0.5% Jamaican47 0.5% Bahamian43 0.4% Czech38 0.4% Ukrainian33 0.3% Scotch-Irish29 0.3% Egyptian28 0.3% Danish26 0.3% Czechoslovakian25 0.2% Ghanaian20 0.2% French19 0.2% Latvian15 0.1% Belgian15 0.1% Slovak11 0.1% Bulgarian11 0.1% West Indian10 0.10% Swiss7 0.07% Icelander4 0.04% Welsh2 0.02% British
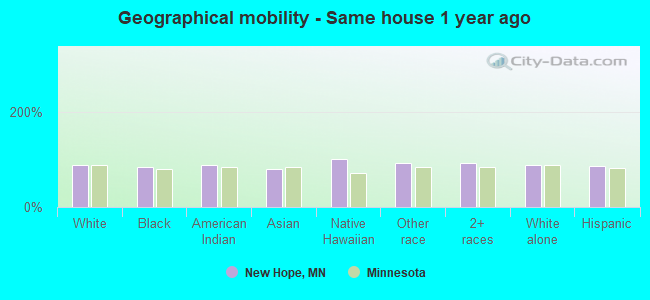
Geographical mobility in New Hope Same house 1 year ago 11,888 88.7% White (Caucasian)4,316 83.4% Black or African American71 86.9% American Indian / Alaska Native499 78.9% Asian35 100.0% Native Hawaiian / Pacific Islander359 92.1% Other race1,238 92.0% Two or more races11,392 89.1% White alone, not Hispanic / Latino1,109 85.2% Hispanic or LatinoMoved within same county 1,125 8.4% White / Caucasian492 9.5% Black or African American13 16.3% American Indian / Alaska Native23 3.6% Asian16 4.2% Other race79 5.8% Two or more races1,075 8.4% White alone, not Hispanic / Latino77 5.9% Hispanic or LatinoMoved within same state 297 2.2% White / Caucasian176 3.4% Black or African American66 10.4% Asian17 4.4% Other race231 1.8% White alone, not Hispanic / Latino82 6.3% Hispanic or LatinoMoved from different state 98 0.7% White / Caucasian51 1.0% Black or African American38 6.0% Asian23 1.7% Two or more races96 0.7% White alone, not Hispanic / LatinoMoved from abroad 4 0.0% White61 1.2% Black or African American9 0.6% Two or more races5 0.0% White alone, not Hispanic / Latino16 1.2% Hispanic or Latino
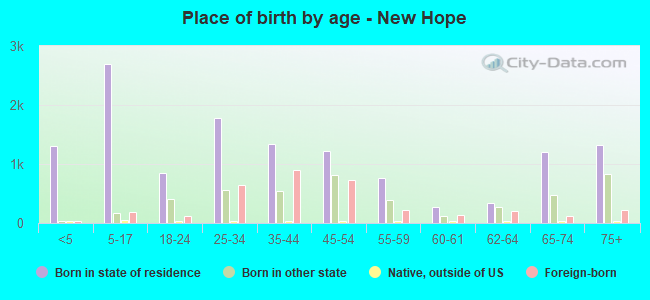
Children Nativity (place of birth) in New Hope
Children under 6 years - Living with two parents Both parents native 502 100.0% NativeBoth parents foreign-born 143 92.8% Native11 7.2% Foreign-bornOne native, one foreign-born parent 256 100.0% NativeChildren under 6 years - Living with one parent Native parent 466 100.0% NativeForeign-born parent 39 100.0% NativeChildren 6 to 17 years - Living with two parents Both parents native 1,034 99.6% Native4 0.4% Foreign-bornBoth parents foreign-born 467 89.9% Native52 10.1% Foreign-bornOne native, one foreign-born parent 130 79.7% Native33 20.3% Foreign-bornChildren 6 to 17 years - Living with one parent Native parent 793 100.0% NativeForeign-born parent 253 56.4% Native195 43.6% Foreign-born
Grandparents responsible for own grandchildren in New Hope
Grandparents (30 to 59 years) White / Caucasian 82 63.6% Responsible for grandchildren47 36.4% Not responsible for grandchildrenBlack or African American 72 75.7% Responsible for grandchildren23 24.3% Not responsible for grandchildrenOther race 34 100.0% Not responsible for grandchildrenWhite alone, not Hispanic / Latino 56 77.8% Responsible for grandchildren16 22.2% Not responsible for grandchildrenHispanic or Latino 61 100.0% Not responsible for grandchildrenGrandparents (60 years and over) White / Caucasian 3 5.4% Responsible for grandchildren58 94.6% Not responsible for grandchildrenBlack or African American 22 100.0% Not responsible for grandchildrenWhite alone, not Hispanic / Latino 3 5.2% Responsible for grandchildren61 94.8% Not responsible for grandchildren