Races in New Llano, Louisiana (LA) Detailed Stats
Ancestries, Foreign-born residents, place of birth
Settings
X


Discuss New Llano, Louisiana races on our local forum with over 2,400,000 registered users
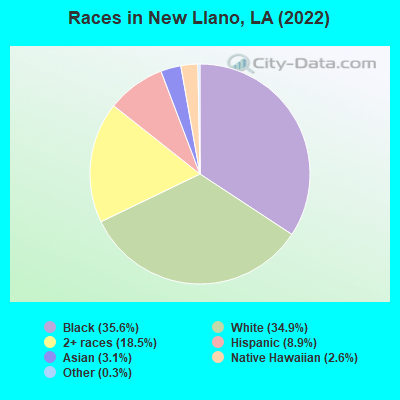
According to 2022 data, the most numerous races in New Llano, LA are White alone (791 residents), Black alone (807 residents), and Hispanic (202 residents). 89.0% of New Llano residents speak English at home. 5.5% of New Llano, LA residents are foreign-born (3.0% born in Asia, 1.2% born in Latin America, 0.9% born in Europe), which is 26.9% greater than the foreign-born rate of 4.0% across the entire state of Louisiana.
Race distribution in New Llano
2000
2022

- 1,03442.8%White alone
- 95939.7%Black alone
- 2078.6%Hispanic
- 913.8%Two or more races
- 903.7%Asian alone
- 180.7%American Indian alone
- 90.4%Other race alone
- 70.3%Native Hawaiian and Other
Pacific Islander alone

-
- 80735.6%Black alone
- 79134.9%White alone
- 41818.5%Two or more races
- 2028.9%Hispanic
- 703.1%Asian alone
- 592.6%Native Hawaiian and Other
Pacific Islander alone - 60.3%Other race alone
2000
2022
-
- 2,794,39162.5%White alone
- 1,443,39032.3%Black alone
- 107,7382.4%Hispanic
- 54,2561.2%Asian alone
- 39,2600.9%Two or more races
- 24,1290.5%American Indian alone
- 4,7360.1%Other race alone
- 1,0760.02%Native Hawaiian and Other
Pacific Islander alone

-
- 2,603,22156.7%White alone
- 1,420,05530.9%Black alone
- 262,2135.7%Hispanic
- 183,2704.0%Two or more races
- 81,1691.8%Asian alone
- 19,9910.4%American Indian alone
- 18,0430.4%Other race alone
- 2,2790.05%Native Hawaiian and Other
Pacific Islander alone

Income and house value in New Llano
- Median household income in 2022
- $41,876White non-Hispanic householders
- $50,380Black householders
- $45,235Asian householders
- $116,777Native Hawaiian and other Pacific Islander householders
- $32,706Two or more races householders
- $42,203Hispanic or Latino race householders
- Median 2022 house value
- $124,703White Non-Hispanic householders
- $166,692Black or African American householders
- $113,826American Indian or Alaska Native householders
- $94,855Asian householders
- $189,710Native Hawaiian and other Pacific Islander householders
- $121,667Some other race householders
- $129,762Two or more races householders
- $159,862Hispanic or Latino householders
Household income for White non-Hispanic householders

Household income for Black householders

Household income for Asian householders

Household income for Native Hawaiian and other Pacific Islander householders

Household income for Some other race householders

Household income for Two or more races householders

Household income for Hispanic or Latino race householders

Median age by race in New Llano
- 39.1Median age for White residents
- 39.0Males
- 39.1Females
- 40.9Median age for Black or African American residents
- 39.7Males
- 47.0Females
- -754,036,086.6Median age for American Indian / Alaska Native residents
- -739,906,102.5Males
- -781,341,107.1Females
- 62.7Median age for Asian residents
- 33.9Males
- 69.1Females
- 83.6Median age for Native Hawaiian / Pacific Islander residents
- 92.7Males
- -599,999,999.4Females
- 46.9Median age for Other race residents
- 24.2Males
- 59.5Females
- 17.7Median age for Two or more races residents
- 23.5Males
- 17.7Females
- 39.6Median age for White alone residents
- 40.7Males
- 39.0Females
- 36.1Median age for Hispanic or Latino residents
- 35.2Males
- 37.7Females
Owner/renter occupied households by race in New Llano
- House owners and renters - White residents
- 24653.0%Owner occupied
- 21847.0%Renter occupied
- House owners and renters - Black or African American residents
- 14939.0%Owner occupied
- 23361.0%Renter occupied
- House owners and renters - Asian residents
- 3687.3%Owner occupied
- 512.7%Renter occupied
- House owners and renters - Native Hawaiian / Pacific Islander residents
- 18100.0%Owner occupied
- House owners and renters - Other race residents
- 4100.0%Owner occupied
- House owners and renters - Two or more races residents
- 4733.7%Owner occupied
- 9366.3%Renter occupied
- House owners and renters - White alone residents
- 20249.6%Owner occupied
- 20550.4%Renter occupied
- House owners and renters - Hispanic or Latino residents
- 7361.6%Owner occupied
- 4638.4%Renter occupied
Language usage in New Llano
- English speakers - Total
- 89.0% of residents of New Llano speak English at home.
- 4.2% of residents speak Spanish at home
- 89100.0%Speak English very well
- 7.0% of residents speak other language at home
- 10873.0%Speak English very well
- 4027.0%Speak English less than very well
- English speakers - Born in the United States
- 92.8% of residents of New Llano speak English at home.
- 6.5% of residents speak Spanish at home
- 54100.0%Speak English very well
- 1.0% of residents speak other language at home
- 8100.0%Speak English very well
- English speakers - Native, born elsewhere
- 59.8% of residents of New Llano speak English at home.
- 1.6% of residents speak Spanish at home
- 2100.0%Speak English very well
- 48.8% of residents speak other language at home
- 62100.0%Speak English very well
- English speakers - Foreign-born
- 17.6% of residents of New Llano speak English at home.
- 23.5% of residents speak Spanish at home
- 28100.0%Speak English very well
- 58.8% of residents speak other language at home
- 2941.4%Speak English very well
- 4158.6%Speak English less than very well
White (Caucasian) - Speak only English
| Native: | 94.7% (800) |
| Foreign-born: | 71.7% (11) |
White (Caucasian) - Speak another language
| Native: | 5.0% (42) |
| Foreign-born: | 40.9% (6) |
Asian - Speak only English
| Native: | 43.4% (3) |
| Foreign-born: | 8.8% (5) |
Asian - Speak another language
| Native: | 57.1% (4) |
| Foreign-born: | 91.8% (54) |
Other race - Speak only English
| Native: | 57.5% (8) |
| Foreign-born: | 57.0% (2) |
Other race - Speak another language
| Native: | 42.2% (6) |
| Foreign-born: | 33.8% (1) |
Two or more races - Speak only English
| Native: | 85.6% (330) |
| Foreign-born: | 13.3% (3) |
Two or more races - Speak another language
| Native: | 14.5% (56) |
| Foreign-born: | 84.3% (20) |
White alone - Speak only English
| Native: | 97.6% (723) |
| Foreign-born: | 54.4% (12) |
White alone - Speak another language
| Native: | 2.4% (18) |
| Foreign-born: | 45.7% (10) |
Hispanic or Latino - Speak another language
| Native: | 22.8% (40) |
| Foreign-born: | 99.9% (28) |
Foreign-born residents in New Llano
124 residents are foreign born (3.0% Asia, 1.2% Latin America, 0.9% Europe).
| This city: | 5.5% |
| Louisiana: | 4.2% |


Marital status for residents in New Llano
Marital status - White (Caucasian) population 15 years and over
- Males
- 28.1%Never married
- 49.2%Now married
- 1.3%Separated
- 2.3%Widowed
- 19.0%Divorced
- Females
- 27.1%Never married
- 43.2%Now married
- 1.9%Separated
- 8.2%Widowed
- 19.6%Divorced
Women who gave birth in the past 12 months
| Now married: | 0.0% (0) |
| Unmarried: | 100.0% (11) |
Women who did not give birth in the past 12 months
| Now married: | 43.2% (99) |
| Unmarried: | 56.8% (130) |
Marital status - Black or African American population 15 years and over
- Males
- 41.2%Never married
- 45.1%Now married
- 6.9%Separated
- 0.7%Widowed
- 6.1%Divorced
- Females
- 31.6%Never married
- 37.0%Now married
- 0.0%Separated
- 8.5%Widowed
- 22.8%Divorced
Women who gave birth in the past 12 months
| Now married: | 100.0% (6) |
| Unmarried: | 0.0% (0) |
Women who did not give birth in the past 12 months
| Now married: | 21.5% (36) |
| Unmarried: | 78.5% (132) |
Marital status - Asian population 15 years and over
- Males
- 0.0%Never married
- 60.0%Now married
- 0.0%Separated
- 0.0%Widowed
- 40.0%Divorced
- Females
- 4.2%Never married
- 62.5%Now married
- 16.7%Separated
- 16.7%Widowed
- 0.0%Divorced
Women who did not give birth in the past 12 months
| Now married: | 80.0% (8) |
| Unmarried: | 20.0% (2) |
Marital status - Native Hawaiian / Pacific Islander population 15 years and over
- Males
- 0.0%Never married
- 100.0%Now married
- 0.0%Separated
- 0.0%Widowed
- 0.0%Divorced
- Females
- 0.0%Never married
- 100.0%Now married
- 0.0%Separated
- 0.0%Widowed
- 0.0%Divorced
Marital status - Other race population 15 years and over
- Males
- 33.3%Never married
- 66.7%Now married
- 0.0%Separated
- 0.0%Widowed
- 0.0%Divorced
- Females
- 0.0%Never married
- 85.7%Now married
- 0.0%Separated
- 14.3%Widowed
- 0.0%Divorced
Women who did not give birth in the past 12 months
| Now married: | 100.0% (6) |
| Unmarried: | 0.0% (0) |
Marital status - Two or more races population 15 years and over
- Males
- 35.6%Never married
- 42.4%Now married
- 0.0%Separated
- 0.0%Widowed
- 22.0%Divorced
- Females
- 64.9%Never married
- 31.1%Now married
- 0.0%Separated
- 4.1%Widowed
- 0.0%Divorced
Women who did not give birth in the past 12 months
| Now married: | 29.8% (59) |
| Unmarried: | 70.2% (138) |
Marital status - White alone, not Hispanic / Latino population 15 years and over
- Males
- 28.1%Never married
- 50.2%Now married
- 1.5%Separated
- 1.8%Widowed
- 18.3%Divorced
- Females
- 22.0%Never married
- 46.5%Now married
- 0.5%Separated
- 9.1%Widowed
- 21.8%Divorced
Women who gave birth in the past 12 months
| Now married: | 0.0% (0) |
| Unmarried: | 100.0% (2) |
Women who did not give birth in the past 12 months
| Now married: | 44.0% (89) |
| Unmarried: | 56.0% (113) |
Marital status - Hispanic or Latino population 15 years and over
- Males
- 21.1%Never married
- 60.0%Now married
- 0.0%Separated
- 3.3%Widowed
- 15.6%Divorced
- Females
- 40.0%Never married
- 42.7%Now married
- 8.0%Separated
- 9.3%Widowed
- 0.0%Divorced
Women who gave birth in the past 12 months
| Now married: | 0.0% (0) |
| Unmarried: | 100.0% (10) |
Women who did not give birth in the past 12 months
| Now married: | 59.6% (35) |
| Unmarried: | 40.4% (23) |
Ancestries in New Llano

- 23816.5%American
- 946.5%English
- 322.2%Italian
- 100.7%Polish
- 90.6%Ukrainian
- 80.6%German
- 80.6%Irish
- 70.5%British
- 40.3%Iraqi
- 30.2%Afghan
- 30.2%European
- 30.2%African
- 10.07%Arab
- 10.07%Eastern European
- 10.07%Russian
- 10.07%Scotch-Irish

Geographical mobility in New Llano

- Same house 1 year ago
- 71480.6%White (Caucasian)
- 70886.1%Black or African American
- 299.4%American Indian / Alaska Native
- 5780.7%Asian
- 62100.0%Native Hawaiian / Pacific Islander
- 1475.8%Other race
- 42885.6%Two or more races
- 64581.5%White alone, not Hispanic / Latino
- 13467.9%Hispanic or Latino

-
- Moved within same county
- 707.9%White / Caucasian
- 749.0%Black or African American
- 68.4%Asian
- 315.9%Other race
- 193.8%Two or more races
- 577.1%White alone, not Hispanic / Latino
- 3115.9%Hispanic or Latino

-
- Moved within same state
- 475.3%White / Caucasian
- 30.3%Black or African American
- 418.1%Two or more races
- 486.0%White alone, not Hispanic / Latino
- 125.9%Hispanic or Latino

-
- Moved from different state
- 525.9%White / Caucasian
- 344.2%Black or African American
- 1013.7%Asian
- 16.4%Other race
- 10.3%Two or more races
- 415.1%White alone, not Hispanic / Latino
- 126.0%Hispanic or Latino

-
- Moved from abroad
- 11.0%Asian
- 142.8%Two or more races

Children Nativity (place of birth) in New Llano
Place of birth for residents in New Llano
![Place of birth for the foreign-born population - Regions]()
- 69Asia
- 32Eastern Asia
- 29Americas
- 29Latin America
- 29Central America
- 24South Eastern Asia
- 22Europe
- 15Western Europe
- 9China
- 7Eastern Europe
- 6South Central Asia
- 6Western Asia
- 3Africa
- 3Middle Africa

![Place of birth for the foreign-born population - Countries]()
- 28Honduras
- 22Korea
- 15Germany
- 10Philippines
- 9Vietnam
- 7Ukraine
- 6China
- 5Thailand
- 4Iraq
- 3Taiwan
- 3Afghanistan
- 2Bangladesh
- 2Kuwait
- 1Japan
- 1Nepal
- 1Panama

Grandparents responsible for own grandchildren in New Llano
Zip codes: 71461.