Races in New Market, Minnesota (MN) Detailed Stats
Ancestries, Foreign-born residents, place of birth

Recent posts about races in New Market, Minnesota on our local forum with over 2,400,000 registered users:
 | Which suburbs to live in if working in Bloomington? (21 replies) |
| Need advice-house hunting this week (9 replies) |
| Are Minneapolis suburbs RURAL? (26 replies) |
| Supermarkets in Uptown? (18 replies) |
| Location of horse farms in Minnesota? (3 replies) |
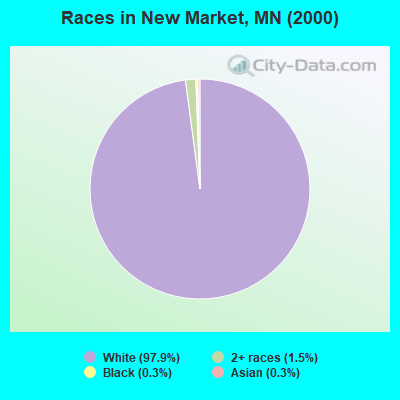
Race distribution in New Market

- 32597.9%White alone
- 51.5%Two or more races
- 10.3%Black alone
- 10.3%Asian alone
2000
2022
-
- 4,337,14388.2%White alone
- 168,8133.4%Black alone
- 143,3822.9%Hispanic
- 141,0832.9%Asian alone
- 70,3041.4%Two or more races
- 52,0091.1%American Indian alone
- 5,0310.1%Other race alone
- 1,7140.03%Native Hawaiian and Other
Pacific Islander alone

-
- 4,356,34776.2%White alone
- 395,1796.9%Black alone
- 333,8305.8%Hispanic
- 294,8005.2%Asian alone
- 259,6494.5%Two or more races
- 42,1250.7%American Indian alone
- 32,9760.6%Other race alone
- 2,2780.04%Native Hawaiian and Other
Pacific Islander alone

Income and house value in New Market
- Median household income in 2022
- $88,518White non-Hispanic householders
- Median 2022 house value
- $299,654White Non-Hispanic householders
Household income for White non-Hispanic householders

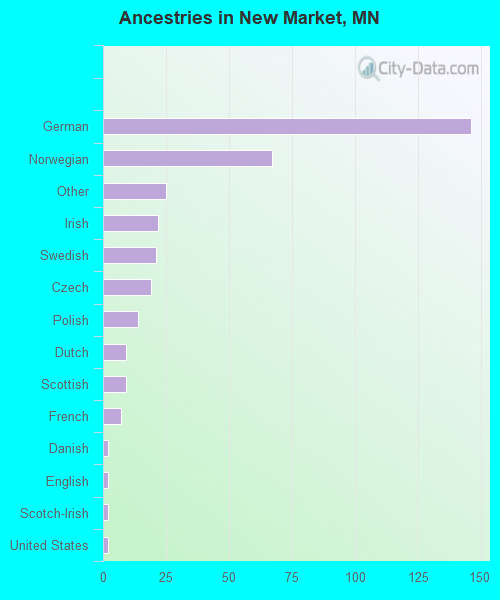
Ancestries in New Market

- 14642.1%German
- 6719.3%Norwegian
- 257.2%Other
- 226.3%Irish
- 216.1%Swedish
- 195.5%Czech
- 144.0%Polish
- 92.6%Dutch
- 92.6%Scottish
- 72.0%French
- 20.6%Danish
- 20.6%English
- 20.6%Scotch-Irish
- 20.6%United States
Zip codes: 55020.