Races in New Paltz, New York (NY) Detailed Stats
Data:
Races - White alone (%)
Races - White alone (% change since 2000)
Races - Black alone (%)
Races - Black alone (% change since 2000)
Races - American Indian alone (%)
Races - American Indian alone (% change since 2000)
Races - Asian alone (%)
Races - Asian alone (% change since 2000)
Races - Hispanic (%)
Races - Hispanic (% change since 2000)
Races - Native Hawaiian and Other Pacific Islander alone (%)
Races - Native Hawaiian and Other Pacific Islander alone (% change since 2000)
Races - Two or more races(%)
Races - Two or more races(% change since 2000)
Races - Other race alone (%)
Races - Other race alone (% change since 2000)
Racial diversity
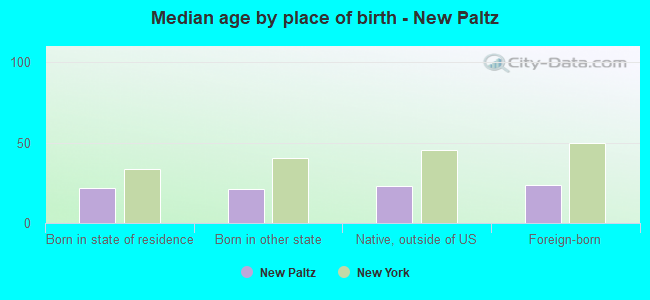
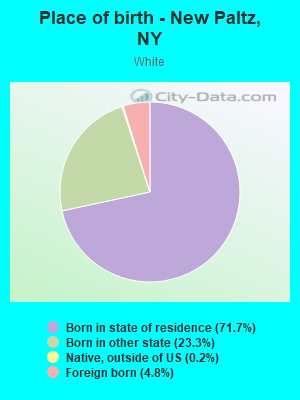
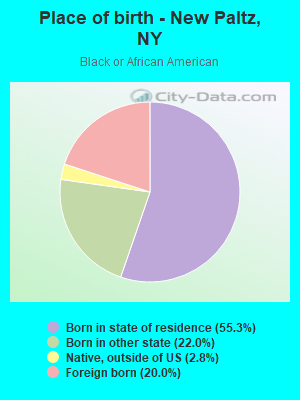
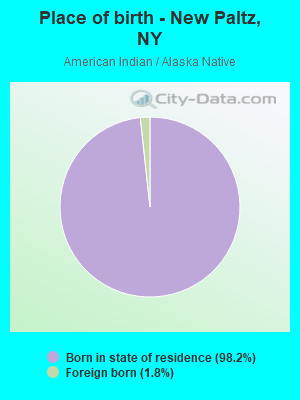
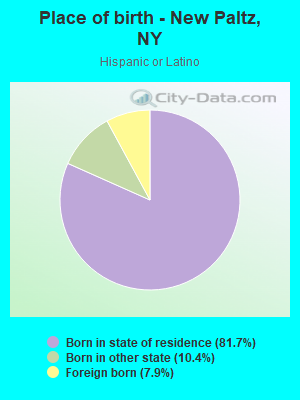
Place of birth - Born in state of residence (%)
Place of birth - Born in state of residence (%) - White
Place of birth - Born in state of residence (%) - Black or African American
Place of birth - Born in state of residence (%) - Asian
Place of birth - Born in state of residence (%) - Hispanic or Latino
Place of birth - Born in state of residence (%) - American Indian and Alaska Native
Place of birth - Born in state of residence (%) - Multirace
Place of birth - Born in state of residence (%) - Other Race
Place of birth - Born in other state (%)
Place of birth - Born in other state (%) - White
Place of birth - Born in other state (%) - Black or African American
Place of birth - Born in other state (%) - Asian
Place of birth - Born in other state (%) - Hispanic or Latino
Place of birth - Born in other state (%) - American Indian and Alaska Native
Place of birth - Born in other state (%) - Multirace
Place of birth - Born in other state (%) - Other Race
Place of birth - Native, outside of US (%)
Place of birth - Native, outside of US (%) - White
Place of birth - Native, outside of US (%) - Black or African American
Place of birth - Native, outside of US (%) - Asian
Place of birth - Native, outside of US (%) - Hispanic or Latino
Place of birth - Native, outside of US (%) - American Indian and Alaska Native
Place of birth - Native, outside of US (%) - Multirace
Place of birth - Native, outside of US (%) - Other Race
Place of birth - Foreign born (%)
Place of birth - Foreign born (%) - White
Place of birth - Foreign born (%) - Black or African American
Place of birth - Foreign born (%) - Asian
Place of birth - Foreign born (%) - Hispanic or Latino
Place of birth - Foreign born (%) - American Indian and Alaska Native
Place of birth - Foreign born (%) - Multirace
Place of birth - Foreign born (%) - Other Race
Residents speaking English at home (%)
Residents speaking English at home - Born in the United States (%)
Residents speaking English at home - Native, born elsewhere (%)
Residents speaking English at home - Foreign born (%)
Residents speaking Spanish at home (%)
Residents speaking Spanish at home - Born in the United States (%)
Residents speaking Spanish at home - Native, born elsewhere (%)
Residents speaking Spanish at home - Foreign born (%)
Residents speaking other language at home (%)
Residents speaking other language at home - Born in the United States (%)
Residents speaking other language at home - Native, born elsewhere (%)
Residents speaking other language at home - Foreign born (%)
Marital status - Never married (%)
Marital status - Now married (%)
Marital status - Separated (%)
Marital status - Widowed (%)
Marital status - Divorced (%)
Ancestries Reported - Arab (%)
Ancestries Reported - Czech (%)
Ancestries Reported - Danish (%)
Ancestries Reported - Dutch (%)
Ancestries Reported - English (%)
Ancestries Reported - French (%)
Ancestries Reported - French Canadian (%)
Ancestries Reported - German (%)
Ancestries Reported - Greek (%)
Ancestries Reported - Hungarian (%)
Ancestries Reported - Irish (%)
Ancestries Reported - Italian (%)
Ancestries Reported - Lithuanian (%)
Ancestries Reported - Norwegian (%)
Ancestries Reported - Polish (%)
Ancestries Reported - Portuguese (%)
Ancestries Reported - Russian (%)
Ancestries Reported - Scotch-Irish (%)
Ancestries Reported - Scottish (%)
Ancestries Reported - Slovak (%)
Ancestries Reported - Subsaharan African (%)
Ancestries Reported - Swedish (%)
Ancestries Reported - Swiss (%)
Ancestries Reported - Ukrainian (%)
Ancestries Reported - United States (%)
Ancestries Reported - Welsh (%)
Ancestries Reported - West Indian (%)
Ancestries Reported - Other (%)
Geographical mobility - Same house 1 year ago (%)
Geographical mobility - Same house 1 year ago (%) - White
Geographical mobility - Same house 1 year ago (%) - Black or African American
Geographical mobility - Same house 1 year ago (%) - Asian
Geographical mobility - Same house 1 year ago (%) - Hispanic or Latino
Geographical mobility - Same house 1 year ago (%) - American Indian and Alaska Native
Geographical mobility - Same house 1 year ago (%) - Multirace
Geographical mobility - Same house 1 year ago (%) - Other Race
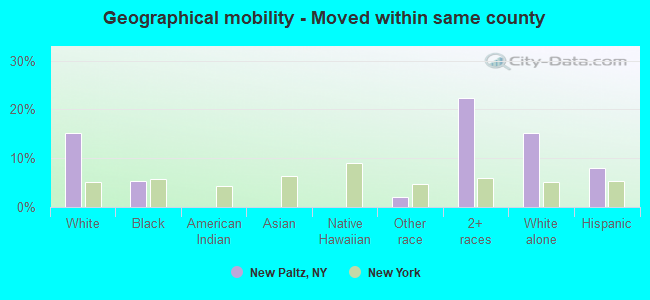
Geographical mobility - Moved within same county (%)
Geographical mobility - Moved within same county (%) - White
Geographical mobility - Moved within same county (%) - Black or African American
Geographical mobility - Moved within same county (%) - Asian
Geographical mobility - Moved within same county (%) - Hispanic or Latino
Geographical mobility - Moved within same county (%) - American Indian and Alaska Native
Geographical mobility - Moved within same county (%) - Multirace
Geographical mobility - Moved within same county (%) - Other Race
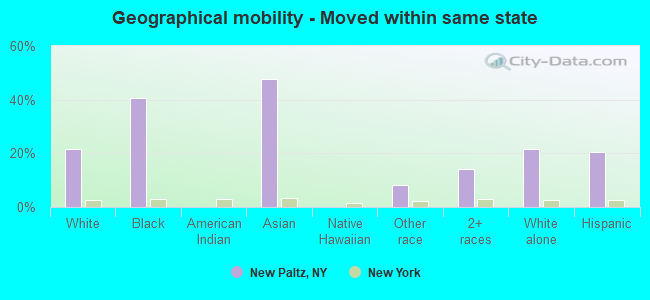
Geographical mobility - Moved from different county within same state (%)
Geographical mobility - Moved from different county within same state (%) - White
Geographical mobility - Moved from different county within same state (%) - Black or African American
Geographical mobility - Moved from different county within same state (%) - Asian
Geographical mobility - Moved from different county within same state (%) - Hispanic or Latino
Geographical mobility - Moved from different county within same state (%) - American Indian and Alaska Native
Geographical mobility - Moved from different county within same state (%) - Multirace
Geographical mobility - Moved from different county within same state (%) - Other Race
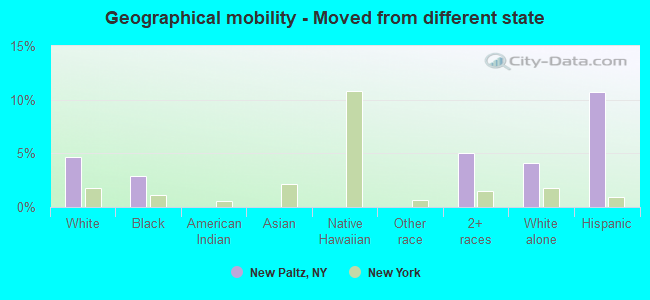
Geographical mobility - Moved from different state (%)
Geographical mobility - Moved from different state (%) - White
Geographical mobility - Moved from different state (%) - Black or African American
Geographical mobility - Moved from different state (%) - Asian
Geographical mobility - Moved from different state (%) - Hispanic or Latino
Geographical mobility - Moved from different state (%) - American Indian and Alaska Native
Geographical mobility - Moved from different state (%) - Multirace
Geographical mobility - Moved from different state (%) - Other Race
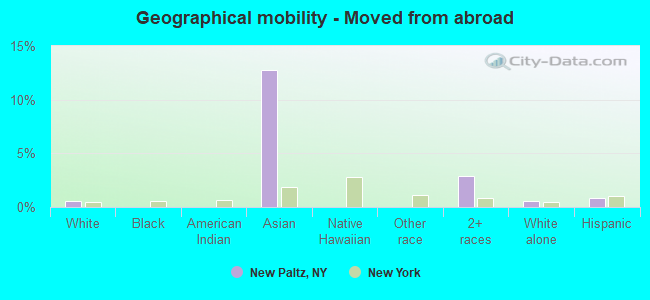
Geographical mobility - Moved from abroad (%)
Geographical mobility - Moved from abroad (%) - White
Geographical mobility - Moved from abroad (%) - Black or African American
Geographical mobility - Moved from abroad (%) - Asian
Geographical mobility - Moved from abroad (%) - Hispanic or Latino
Geographical mobility - Moved from abroad (%) - American Indian and Alaska Native
Geographical mobility - Moved from abroad (%) - Multirace
Geographical mobility - Moved from abroad (%) - Other Race
Place of birth for the foreign-born population - Ireland (%)
Place of birth for the foreign-born population - Denmark (%)
Place of birth for the foreign-born population - Norway (%)
Place of birth for the foreign-born population - Sweden (%)
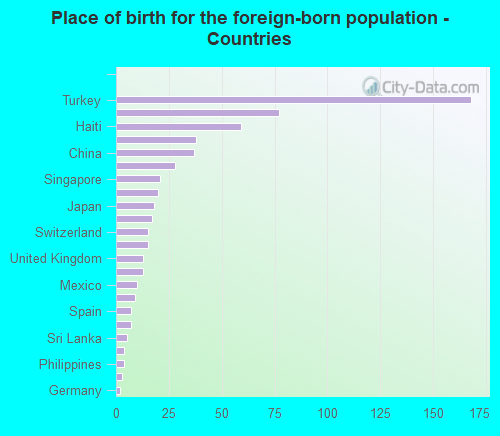
Place of birth for the foreign-born population - United Kingdom (%)
Place of birth for the foreign-born population - England (%)
Place of birth for the foreign-born population - Scotland (%)
Place of birth for the foreign-born population - Other Northern Europe (%)
Place of birth for the foreign-born population - Austria (%)
Place of birth for the foreign-born population - Belgium (%)
Place of birth for the foreign-born population - France (%)
Place of birth for the foreign-born population - Germany (%)
Place of birth for the foreign-born population - Netherlands (%)
Place of birth for the foreign-born population - Switzerland (%)
Place of birth for the foreign-born population - Other Western Europe (%)
Place of birth for the foreign-born population - Greece (%)
Place of birth for the foreign-born population - Italy (%)
Place of birth for the foreign-born population - Portugal (%)
Place of birth for the foreign-born population - Spain (%)
Place of birth for the foreign-born population - Other Southern Europe (%)
Place of birth for the foreign-born population - Albania (%)
Place of birth for the foreign-born population - Belarus (%)
Place of birth for the foreign-born population - Bosnia and Herzegovina (%)
Place of birth for the foreign-born population - Bulgaria (%)
Place of birth for the foreign-born population - Croatia (%)
Place of birth for the foreign-born population - Czechoslovakia (%)
Place of birth for the foreign-born population - Hungary (%)
Place of birth for the foreign-born population - Latvia (%)
Place of birth for the foreign-born population - Lithuania (%)
Place of birth for the foreign-born population - North Macedonia (Macedonia) (%)
Place of birth for the foreign-born population - Moldova (%)
Place of birth for the foreign-born population - Poland (%)
Place of birth for the foreign-born population - Romania (%)
Place of birth for the foreign-born population - Russia (%)
Place of birth for the foreign-born population - Serbia (%)
Place of birth for the foreign-born population - Ukraine (%)
Place of birth for the foreign-born population - Other Eastern Europe (%)
Place of birth for the foreign-born population - China (%)
Place of birth for the foreign-born population - Hong Kong (%)
Place of birth for the foreign-born population - Taiwan (%)
Place of birth for the foreign-born population - Japan (%)
Place of birth for the foreign-born population - Korea (%)
Place of birth for the foreign-born population - Other Eastern Asia (%)
Place of birth for the foreign-born population - Afghanistan (%)
Place of birth for the foreign-born population - Bangladesh (%)
Place of birth for the foreign-born population - India (%)
Place of birth for the foreign-born population - Iran (%)
Place of birth for the foreign-born population - Kazakhstan (%)
Place of birth for the foreign-born population - Nepal (%)
Place of birth for the foreign-born population - Pakistan (%)
Place of birth for the foreign-born population - Sri Lanka (%)
Place of birth for the foreign-born population - Uzbekistan (%)
Place of birth for the foreign-born population - Other South Central Asia (%)
Place of birth for the foreign-born population - Burma (%)
Place of birth for the foreign-born population - Cambodia (%)
Place of birth for the foreign-born population - Indonesia (%)
Place of birth for the foreign-born population - Laos (%)
Place of birth for the foreign-born population - Malaysia (%)
Place of birth for the foreign-born population - Philippines (%)
Place of birth for the foreign-born population - Singapore (%)
Place of birth for the foreign-born population - Thailand (%)
Place of birth for the foreign-born population - Vietnam (%)
Place of birth for the foreign-born population - Other South Eastern Asia (%)
Place of birth for the foreign-born population - Armenia (%)
Place of birth for the foreign-born population - Iraq (%)
Place of birth for the foreign-born population - Israel (%)
Place of birth for the foreign-born population - Jordan (%)
Place of birth for the foreign-born population - Kuwait (%)
Place of birth for the foreign-born population - Lebanon (%)
Place of birth for the foreign-born population - Saudi Arabia (%)
Place of birth for the foreign-born population - Syria (%)
Place of birth for the foreign-born population - Turkey (%)
Place of birth for the foreign-born population - Yemen (%)
Place of birth for the foreign-born population - Other Western Asia (%)
Place of birth for the foreign-born population - Eritrea (%)
Place of birth for the foreign-born population - Ethiopia (%)
Place of birth for the foreign-born population - Kenya (%)
Place of birth for the foreign-born population - Somalia (%)
Place of birth for the foreign-born population - Uganda (%)
Place of birth for the foreign-born population - Zimbabwe (%)
Place of birth for the foreign-born population - Other Eastern Africa (%)
Place of birth for the foreign-born population - Cameroon (%)
Place of birth for the foreign-born population - Congo (%)
Place of birth for the foreign-born population - Democratic Republic of Congo (Zaire) (%)
Place of birth for the foreign-born population - Other Middle Africa (%)
Place of birth for the foreign-born population - Egypt (%)
Place of birth for the foreign-born population - Morocco (%)
Place of birth for the foreign-born population - Sudan (%)
Place of birth for the foreign-born population - Other Northern Africa (%)
Place of birth for the foreign-born population - South Africa (%)
Place of birth for the foreign-born population - Other Southern Africa (%)
Place of birth for the foreign-born population - Cabo Verde (%)
Place of birth for the foreign-born population - Ghana (%)
Place of birth for the foreign-born population - Liberia (%)
Place of birth for the foreign-born population - Nigeria (%)
Place of birth for the foreign-born population - Senegal (%)
Place of birth for the foreign-born population - Sierra Leone (%)
Place of birth for the foreign-born population - Other Western Africa (%)
Place of birth for the foreign-born population - Australia (%)
Place of birth for the foreign-born population - New Zealand (%)
Place of birth for the foreign-born population - Fiji (%)
Place of birth for the foreign-born population - Micronesia (%)
Place of birth for the foreign-born population - Bahamas (%)
Place of birth for the foreign-born population - Barbados (%)
Place of birth for the foreign-born population - Cuba (%)
Place of birth for the foreign-born population - Dominica (%)
Place of birth for the foreign-born population - Dominican Republic (%)
Place of birth for the foreign-born population - Grenada (%)
Place of birth for the foreign-born population - Haiti (%)
Place of birth for the foreign-born population - Jamaica (%)
Place of birth for the foreign-born population - St. Vincent and the Grenadines (%)
Place of birth for the foreign-born population - Trinidad and Tobago (%)
Place of birth for the foreign-born population - West Indies (%)
Place of birth for the foreign-born population - Other Caribbean (%)
Place of birth for the foreign-born population - Belize (%)
Place of birth for the foreign-born population - Costa Rica (%)
Place of birth for the foreign-born population - El Salvador (%)
Place of birth for the foreign-born population - Guatemala (%)
Place of birth for the foreign-born population - Honduras (%)
Place of birth for the foreign-born population - Mexico (%)
Place of birth for the foreign-born population - Nicaragua (%)
Place of birth for the foreign-born population - Panama (%)
Place of birth for the foreign-born population - Other Central America (%)
Place of birth for the foreign-born population - Argentina (%)
Place of birth for the foreign-born population - Bolivia (%)
Place of birth for the foreign-born population - Brazil (%)
Place of birth for the foreign-born population - Chile (%)
Place of birth for the foreign-born population - Colombia (%)
Place of birth for the foreign-born population - Ecuador (%)
Place of birth for the foreign-born population - Guyana (%)
Place of birth for the foreign-born population - Peru (%)
Place of birth for the foreign-born population - Uruguay (%)
Place of birth for the foreign-born population - Venezuela (%)
Place of birth for the foreign-born population - Other South America (%)
Place of birth for the foreign-born population - Canada (%)
Place of birth for the foreign-born population - Other Northern America (%)
Place of birth for the foreign-born population - Other (%)
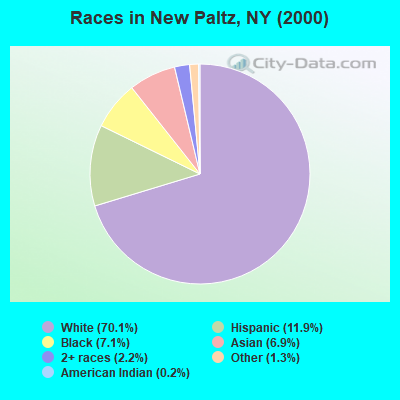
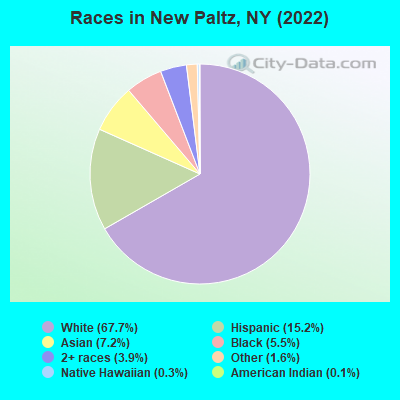
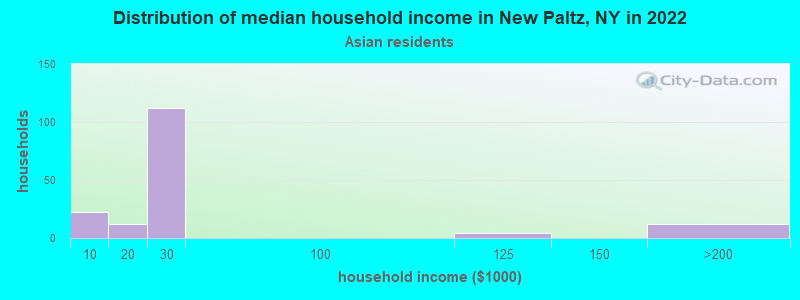
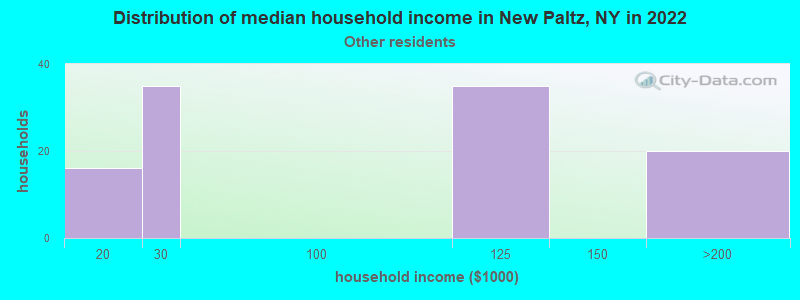
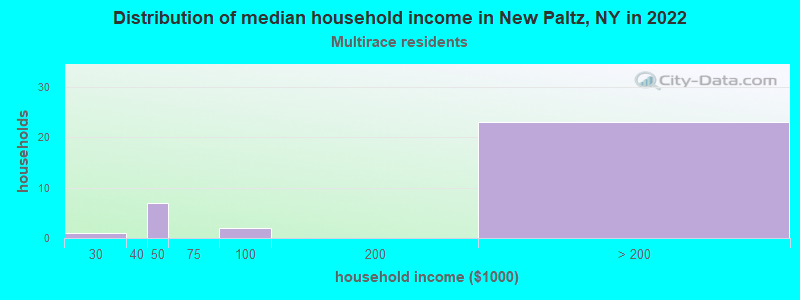
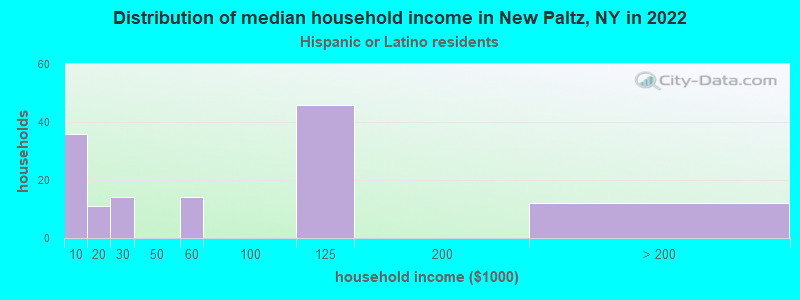
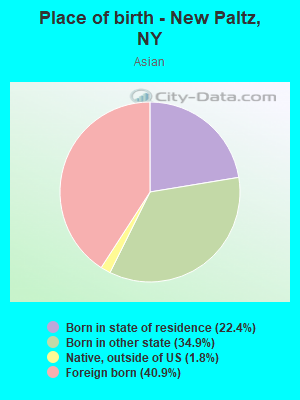
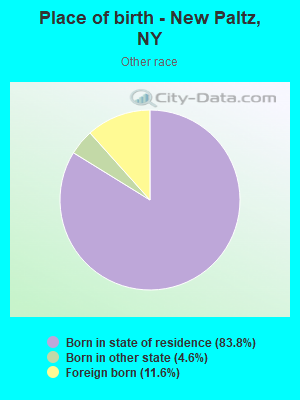
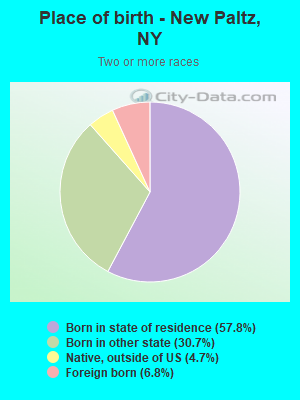
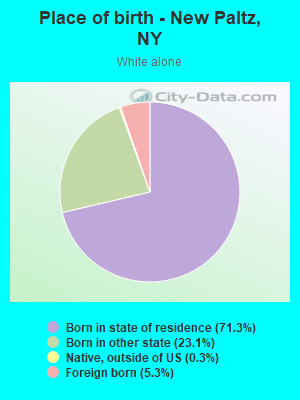
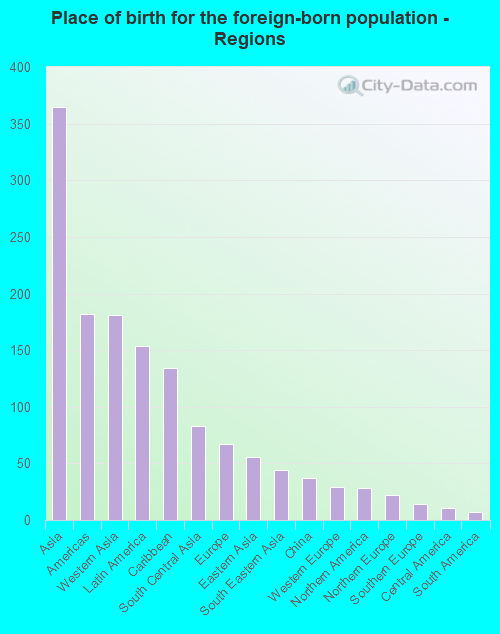
According to 2022 data, the most numerous races in New Paltz, NY are White alone (5,242 residents), Hispanic (1,180 residents), and Black alone (423 residents). 82.0% of New Paltz residents speak English at home. 8.0% of New Paltz, NY residents are foreign-born (4.8% born in Asia, 2.0% born in Latin America, 0.9% born in Europe), which is 176.4% less than the foreign-born rate of 22.0% across the entire state of New York.
Race distribution in New Paltz
2000 2022
11,760,981 62.0% White alone 2,867,583 15.1% Hispanic 2,812,623 14.8% Black alone 1,035,926 5.5% Asian alone 366,116 1.9% Two or more races 75,499 0.4% Other race alone 52,499 0.3% American Indian alone 5,230 0.03% Native Hawaiian and Other
10,408,933 52.9% White alone 3,867,299 19.7% Hispanic 2,633,840 13.4% Black alone 1,776,286 9.0% Asian alone 732,670 3.7% Two or more races 216,110 1.1% Other race alone 35,082 0.2% American Indian alone 6,931 0.04% Native Hawaiian and Other
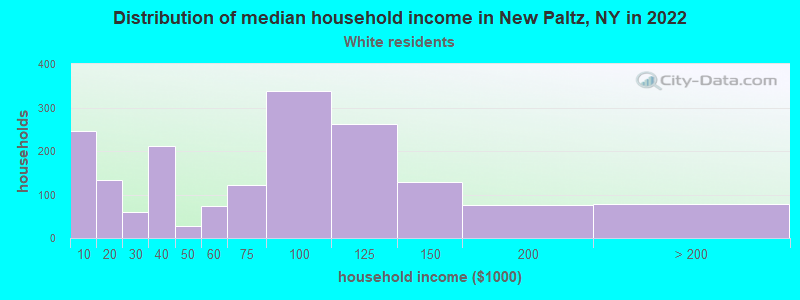
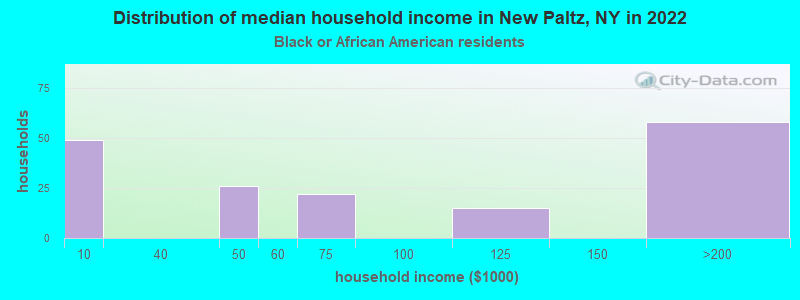
Income and house value in New Paltz Median household income in 2022 $76,128 White non-Hispanic householders$22,791 Asian householders$176,315 Two or more races householdersMedian 2022 house value $390,953 White Non-Hispanic householders $430,048 Asian householders$508,238 Some other race householders
Median age by race in New Paltz
22.2 Median age for White residents24.6 22.0 20.8 Median age for Black or African American residents23.0 22.3 19.2 Median age for American Indian / Alaska Native residents-666,666,666.0 22.3 21.4 Median age for Asian residents20.9 19.8 -666,666,666.0 Median age for Native Hawaiian / Pacific Islander residents-666,666,666.0 -666,666,666.0 17.9 Median age for Other race residents14.0 21.8 20.7 Median age for Two or more races residents20.7 19.3 22.2 Median age for White alone residents24.4 21.7 20.9 Median age for Hispanic or Latino residents20.5 22.9
Owner/renter occupied households by race in New Paltz
House owners and renters - White residents 563 31.3% Owner occupied1,236 68.7% Renter occupiedHouse owners and renters - Black or African American residents 34 27.2% Owner occupied90 72.8% Renter occupiedHouse owners and renters - Asian residents 22 12.8% Owner occupied151 87.2% Renter occupiedHouse owners and renters - Native Hawaiian / Pacific Islander residents 15 100.0% Owner occupiedHouse owners and renters - Other race residents 192 100.0% Renter occupiedHouse owners and renters - Two or more races residents 20 71.4% Owner occupied8 28.6% Renter occupiedHouse owners and renters - White alone residents 532 30.3% Owner occupied1,221 69.7% Renter occupiedHouse owners and renters - Hispanic or Latino residents 56 35.8% Owner occupied100 64.2% Renter occupied
Language usage in New Paltz
English speakers - Total 82.0% of residents of New Paltz speak English at home.
10.6% of residents speak Spanish at home 661 81.5% Speak English very well150 18.5% Speak English less than very well8.2% of residents speak other language at home 454 73.1% Speak English very well167 26.9% Speak English less than very well
English speakers - Born in the United States 89.8% of residents of New Paltz speak English at home.
8.4% of residents speak Spanish at home 71 49.3% Speak English very well73 50.7% Speak English less than very well3.5% of residents speak other language at home 60 100.0% Speak English very well
English speakers - Native, born elsewhere 28.6% of residents of New Paltz speak English at home.
68.3% of residents speak other language at home 27 62.8% Speak English very well16 37.2% Speak English less than very well
English speakers - Foreign-born 31.1% of residents of New Paltz speak English at home.
7.8% of residents speak Spanish at home 56 100.0% Speak English very well60.9% of residents speak other language at home 295 67.2% Speak English very well144 32.8% Speak English less than very well
White (Caucasian) - Speak only English Native:
95.7% (4,921)Foreign-born:
44.5% (118)
White (Caucasian) - Speak another language Native:
4.2% (214)Foreign-born:
54.5% (144)
Black or African American - Speak only English Native:
69.3% (361)Foreign-born:
50.9% (61)
Black or African American - Speak another language Native:
27.8% (145)Foreign-born:
30.9% (37)
American Indian / Alaska Native - Speak only English Native:
81.6% (70)Foreign-born:
64.1% (1)
Asian - Speak only English Native:
67.6% (228)Foreign-born:
8.4% (20)
Asian - Speak another language Native:
30.2% (102)Foreign-born:
90.1% (218)
Other race - Speak another language Native:
65.7% (246)Foreign-born:
100.0% (53)
Two or more races - Speak only English Native:
68.2% (334)Foreign-born:
45.9% (17)
Two or more races - Speak another language Native:
34.2% (167)Foreign-born:
27.1% (10)
White alone - Speak only English Native:
98.8% (4,810)Foreign-born:
44.4% (123)
White alone - Speak another language Native:
1.4% (69)Foreign-born:
54.5% (151)
Hispanic or Latino - Speak only English Native:
37.6% (390)Foreign-born:
28.2% (24)
Hispanic or Latino - Speak another language Native:
64.9% (674)Foreign-born:
55.5% (46)
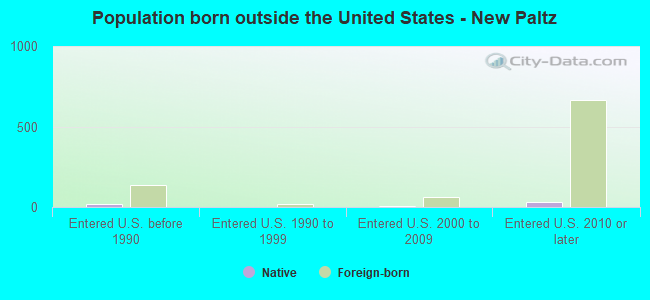
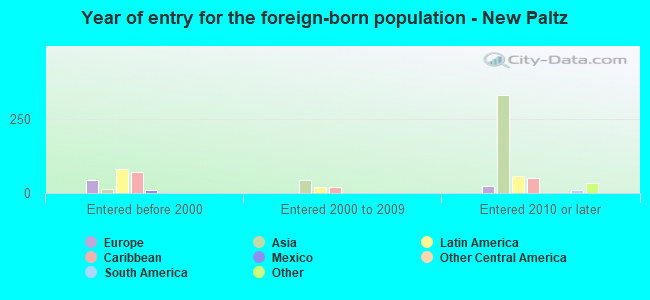
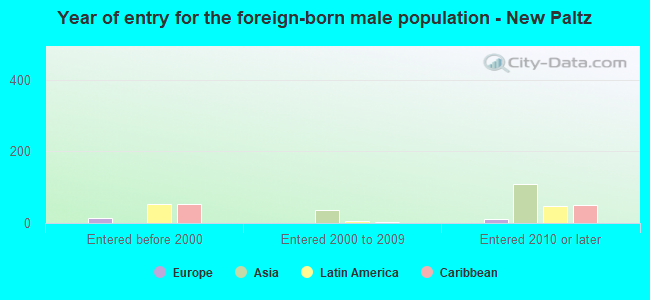
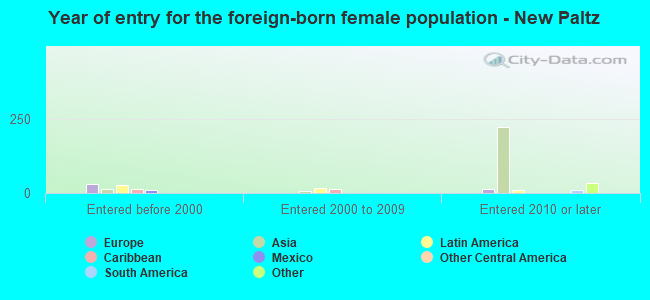
Foreign-born residents in New Paltz 616 residents are foreign born (4.8% Asia , 2.0% Latin America , 0.9% Europe ).
This city:
8.0%New York:
22.6%
Marital status for residents in New Paltz Marital status - White (Caucasian) population 15 years and over
Males 69.7% Never married22.5% Now married1.6% Separated1.8% Widowed4.5% DivorcedFemales 75.3% Never married11.7% Now married2.1% Separated5.7% Widowed5.1% DivorcedWomen who gave birth in the past 12 months Now married:
100.0% (26)Unmarried:
0.0% (0)
Women who did not give birth in the past 12 months Now married:
9.6% (257)Unmarried:
90.4% (2,403)
Marital status - Black or African American population 15 years and over
Males 61.1% Never married15.6% Now married0.0% Separated0.0% Widowed23.3% DivorcedFemales 83.5% Never married9.1% Now married0.0% Separated0.0% Widowed7.4% DivorcedWomen who did not give birth in the past 12 months Now married:
9.8% (35)Unmarried:
90.2% (317)
Marital status - American Indian / Alaska Native population 15 years and over
Males 100.0% Never married0.0% Now married0.0% Separated0.0% Widowed0.0% DivorcedFemales 89.2% Never married10.8% Now married0.0% Separated0.0% Widowed0.0% DivorcedWomen who did not give birth in the past 12 months Now married:
10.8% (10)Unmarried:
89.2% (83)
Marital status - Asian population 15 years and over
Males 100.0% Never married0.0% Now married0.0% Separated0.0% Widowed0.0% DivorcedFemales 84.0% Never married8.6% Now married0.0% Separated0.0% Widowed7.4% DivorcedWomen who did not give birth in the past 12 months Now married:
9.3% (14)Unmarried:
90.7% (135)
Marital status - Other race population 15 years and over
Males 83.0% Never married8.8% Now married0.0% Separated0.0% Widowed8.2% DivorcedFemales 91.5% Never married8.5% Now married0.0% Separated0.0% Widowed0.0% DivorcedWomen who did not give birth in the past 12 months Now married:
8.5% (28)Unmarried:
91.5% (302)
Marital status - Two or more races population 15 years and over
Males 98.5% Never married0.0% Now married0.0% Separated0.0% Widowed1.5% DivorcedFemales 95.9% Never married4.1% Now married0.0% Separated0.0% Widowed0.0% DivorcedWomen who did not give birth in the past 12 months Now married:
0.0% (0)Unmarried:
100.0% (488)
Marital status - White alone, not Hispanic / Latino population 15 years and over
Males 69.4% Never married22.1% Now married1.7% Separated2.0% Widowed4.8% DivorcedFemales 74.9% Never married12.1% Now married2.2% Separated5.4% Widowed5.4% DivorcedWomen who gave birth in the past 12 months Now married:
100.0% (27)Unmarried:
0.0% (0)
Women who did not give birth in the past 12 months Now married:
9.8% (254)Unmarried:
90.2% (2,334)
Marital status - Hispanic or Latino population 15 years and over
Males 88.8% Never married11.2% Now married0.0% Separated0.0% Widowed0.0% DivorcedFemales 88.1% Never married8.9% Now married0.0% Separated3.0% Widowed0.0% DivorcedWomen who did not give birth in the past 12 months Now married:
7.1% (47)Unmarried:
92.9% (621)
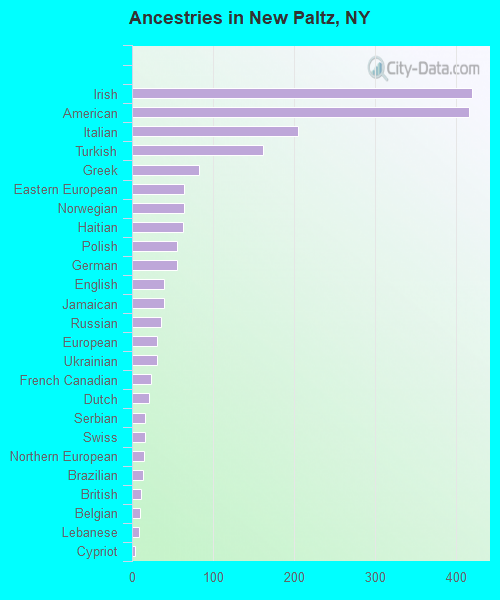
Ancestries in New Paltz
420 13.8% Irish416 13.7% American205 6.8% Italian162 5.3% Turkish83 2.7% Greek64 2.1% Eastern European64 2.1% Norwegian63 2.1% Haitian56 1.8% Polish55 1.8% German40 1.3% English39 1.3% Jamaican36 1.2% Russian31 1.0% European31 1.0% Ukrainian23 0.8% French Canadian21 0.7% Dutch16 0.5% Serbian16 0.5% Swiss15 0.5% Northern European14 0.5% Brazilian11 0.4% British10 0.3% Belgian9 0.3% Lebanese4 0.1% Cypriot4 0.1% Scottish
Children Nativity (place of birth) in New Paltz
Children under 6 years - Living with two parents Both parents native 35 100.0% NativeOne native, one foreign-born parent 6 100.0% NativeChildren under 6 years - Living with one parent Native parent 41 100.0% NativeForeign-born parent 34 100.0% Native
Children 6 to 17 years - Living with two parents Both parents native 97 100.0% NativeOne native, one foreign-born parent 39 100.0% NativeChildren 6 to 17 years - Living with one parent Native parent 266 100.0% Native