Races in New Windsor, New York (NY) Detailed Stats
Data:
Races - White alone (%)
Races - White alone (% change since 2000)
Races - Black alone (%)
Races - Black alone (% change since 2000)
Races - American Indian alone (%)
Races - American Indian alone (% change since 2000)
Races - Asian alone (%)
Races - Asian alone (% change since 2000)
Races - Hispanic (%)
Races - Hispanic (% change since 2000)
Races - Native Hawaiian and Other Pacific Islander alone (%)
Races - Native Hawaiian and Other Pacific Islander alone (% change since 2000)
Races - Two or more races(%)
Races - Two or more races(% change since 2000)
Races - Other race alone (%)
Races - Other race alone (% change since 2000)
Racial diversity
Place of birth - Born in state of residence (%)
Place of birth - Born in state of residence (%) - White
Place of birth - Born in state of residence (%) - Black or African American
Place of birth - Born in state of residence (%) - Asian
Place of birth - Born in state of residence (%) - Hispanic or Latino
Place of birth - Born in state of residence (%) - American Indian and Alaska Native
Place of birth - Born in state of residence (%) - Multirace
Place of birth - Born in state of residence (%) - Other Race
Place of birth - Born in other state (%)
Place of birth - Born in other state (%) - White
Place of birth - Born in other state (%) - Black or African American
Place of birth - Born in other state (%) - Asian
Place of birth - Born in other state (%) - Hispanic or Latino
Place of birth - Born in other state (%) - American Indian and Alaska Native
Place of birth - Born in other state (%) - Multirace
Place of birth - Born in other state (%) - Other Race
Place of birth - Native, outside of US (%)
Place of birth - Native, outside of US (%) - White
Place of birth - Native, outside of US (%) - Black or African American
Place of birth - Native, outside of US (%) - Asian
Place of birth - Native, outside of US (%) - Hispanic or Latino
Place of birth - Native, outside of US (%) - American Indian and Alaska Native
Place of birth - Native, outside of US (%) - Multirace
Place of birth - Native, outside of US (%) - Other Race
Place of birth - Foreign born (%)
Place of birth - Foreign born (%) - White
Place of birth - Foreign born (%) - Black or African American
Place of birth - Foreign born (%) - Asian
Place of birth - Foreign born (%) - Hispanic or Latino
Place of birth - Foreign born (%) - American Indian and Alaska Native
Place of birth - Foreign born (%) - Multirace
Place of birth - Foreign born (%) - Other Race
Residents speaking English at home (%)
Residents speaking English at home - Born in the United States (%)
Residents speaking English at home - Native, born elsewhere (%)
Residents speaking English at home - Foreign born (%)
Residents speaking Spanish at home (%)
Residents speaking Spanish at home - Born in the United States (%)
Residents speaking Spanish at home - Native, born elsewhere (%)
Residents speaking Spanish at home - Foreign born (%)
Residents speaking other language at home (%)
Residents speaking other language at home - Born in the United States (%)
Residents speaking other language at home - Native, born elsewhere (%)
Residents speaking other language at home - Foreign born (%)
Marital status - Never married (%)
Marital status - Now married (%)
Marital status - Separated (%)
Marital status - Widowed (%)
Marital status - Divorced (%)
Ancestries Reported - Arab (%)
Ancestries Reported - Czech (%)
Ancestries Reported - Danish (%)
Ancestries Reported - Dutch (%)
Ancestries Reported - English (%)
Ancestries Reported - French (%)
Ancestries Reported - French Canadian (%)
Ancestries Reported - German (%)
Ancestries Reported - Greek (%)
Ancestries Reported - Hungarian (%)
Ancestries Reported - Irish (%)
Ancestries Reported - Italian (%)
Ancestries Reported - Lithuanian (%)
Ancestries Reported - Norwegian (%)
Ancestries Reported - Polish (%)
Ancestries Reported - Portuguese (%)
Ancestries Reported - Russian (%)
Ancestries Reported - Scotch-Irish (%)
Ancestries Reported - Scottish (%)
Ancestries Reported - Slovak (%)
Ancestries Reported - Subsaharan African (%)
Ancestries Reported - Swedish (%)
Ancestries Reported - Swiss (%)
Ancestries Reported - Ukrainian (%)
Ancestries Reported - United States (%)
Ancestries Reported - Welsh (%)
Ancestries Reported - West Indian (%)
Ancestries Reported - Other (%)
Geographical mobility - Same house 1 year ago (%)
Geographical mobility - Same house 1 year ago (%) - White
Geographical mobility - Same house 1 year ago (%) - Black or African American
Geographical mobility - Same house 1 year ago (%) - Asian
Geographical mobility - Same house 1 year ago (%) - Hispanic or Latino
Geographical mobility - Same house 1 year ago (%) - American Indian and Alaska Native
Geographical mobility - Same house 1 year ago (%) - Multirace
Geographical mobility - Same house 1 year ago (%) - Other Race
Geographical mobility - Moved within same county (%)
Geographical mobility - Moved within same county (%) - White
Geographical mobility - Moved within same county (%) - Black or African American
Geographical mobility - Moved within same county (%) - Asian
Geographical mobility - Moved within same county (%) - Hispanic or Latino
Geographical mobility - Moved within same county (%) - American Indian and Alaska Native
Geographical mobility - Moved within same county (%) - Multirace
Geographical mobility - Moved within same county (%) - Other Race
Geographical mobility - Moved from different county within same state (%)
Geographical mobility - Moved from different county within same state (%) - White
Geographical mobility - Moved from different county within same state (%) - Black or African American
Geographical mobility - Moved from different county within same state (%) - Asian
Geographical mobility - Moved from different county within same state (%) - Hispanic or Latino
Geographical mobility - Moved from different county within same state (%) - American Indian and Alaska Native
Geographical mobility - Moved from different county within same state (%) - Multirace
Geographical mobility - Moved from different county within same state (%) - Other Race
Geographical mobility - Moved from different state (%)
Geographical mobility - Moved from different state (%) - White
Geographical mobility - Moved from different state (%) - Black or African American
Geographical mobility - Moved from different state (%) - Asian
Geographical mobility - Moved from different state (%) - Hispanic or Latino
Geographical mobility - Moved from different state (%) - American Indian and Alaska Native
Geographical mobility - Moved from different state (%) - Multirace
Geographical mobility - Moved from different state (%) - Other Race
Geographical mobility - Moved from abroad (%)
Geographical mobility - Moved from abroad (%) - White
Geographical mobility - Moved from abroad (%) - Black or African American
Geographical mobility - Moved from abroad (%) - Asian
Geographical mobility - Moved from abroad (%) - Hispanic or Latino
Geographical mobility - Moved from abroad (%) - American Indian and Alaska Native
Geographical mobility - Moved from abroad (%) - Multirace
Geographical mobility - Moved from abroad (%) - Other Race
Place of birth for the foreign-born population - Ireland (%)
Place of birth for the foreign-born population - Denmark (%)
Place of birth for the foreign-born population - Norway (%)
Place of birth for the foreign-born population - Sweden (%)
Place of birth for the foreign-born population - United Kingdom (%)
Place of birth for the foreign-born population - England (%)
Place of birth for the foreign-born population - Scotland (%)
Place of birth for the foreign-born population - Other Northern Europe (%)
Place of birth for the foreign-born population - Austria (%)
Place of birth for the foreign-born population - Belgium (%)
Place of birth for the foreign-born population - France (%)
Place of birth for the foreign-born population - Germany (%)
Place of birth for the foreign-born population - Netherlands (%)
Place of birth for the foreign-born population - Switzerland (%)
Place of birth for the foreign-born population - Other Western Europe (%)
Place of birth for the foreign-born population - Greece (%)
Place of birth for the foreign-born population - Italy (%)
Place of birth for the foreign-born population - Portugal (%)
Place of birth for the foreign-born population - Spain (%)
Place of birth for the foreign-born population - Other Southern Europe (%)
Place of birth for the foreign-born population - Albania (%)
Place of birth for the foreign-born population - Belarus (%)
Place of birth for the foreign-born population - Bosnia and Herzegovina (%)
Place of birth for the foreign-born population - Bulgaria (%)
Place of birth for the foreign-born population - Croatia (%)
Place of birth for the foreign-born population - Czechoslovakia (%)
Place of birth for the foreign-born population - Hungary (%)
Place of birth for the foreign-born population - Latvia (%)
Place of birth for the foreign-born population - Lithuania (%)
Place of birth for the foreign-born population - North Macedonia (Macedonia) (%)
Place of birth for the foreign-born population - Moldova (%)
Place of birth for the foreign-born population - Poland (%)
Place of birth for the foreign-born population - Romania (%)
Place of birth for the foreign-born population - Russia (%)
Place of birth for the foreign-born population - Serbia (%)
Place of birth for the foreign-born population - Ukraine (%)
Place of birth for the foreign-born population - Other Eastern Europe (%)
Place of birth for the foreign-born population - China (%)
Place of birth for the foreign-born population - Hong Kong (%)
Place of birth for the foreign-born population - Taiwan (%)
Place of birth for the foreign-born population - Japan (%)
Place of birth for the foreign-born population - Korea (%)
Place of birth for the foreign-born population - Other Eastern Asia (%)
Place of birth for the foreign-born population - Afghanistan (%)
Place of birth for the foreign-born population - Bangladesh (%)
Place of birth for the foreign-born population - India (%)
Place of birth for the foreign-born population - Iran (%)
Place of birth for the foreign-born population - Kazakhstan (%)
Place of birth for the foreign-born population - Nepal (%)
Place of birth for the foreign-born population - Pakistan (%)
Place of birth for the foreign-born population - Sri Lanka (%)
Place of birth for the foreign-born population - Uzbekistan (%)
Place of birth for the foreign-born population - Other South Central Asia (%)
Place of birth for the foreign-born population - Burma (%)
Place of birth for the foreign-born population - Cambodia (%)
Place of birth for the foreign-born population - Indonesia (%)
Place of birth for the foreign-born population - Laos (%)
Place of birth for the foreign-born population - Malaysia (%)
Place of birth for the foreign-born population - Philippines (%)
Place of birth for the foreign-born population - Singapore (%)
Place of birth for the foreign-born population - Thailand (%)
Place of birth for the foreign-born population - Vietnam (%)
Place of birth for the foreign-born population - Other South Eastern Asia (%)
Place of birth for the foreign-born population - Armenia (%)
Place of birth for the foreign-born population - Iraq (%)
Place of birth for the foreign-born population - Israel (%)
Place of birth for the foreign-born population - Jordan (%)
Place of birth for the foreign-born population - Kuwait (%)
Place of birth for the foreign-born population - Lebanon (%)
Place of birth for the foreign-born population - Saudi Arabia (%)
Place of birth for the foreign-born population - Syria (%)
Place of birth for the foreign-born population - Turkey (%)
Place of birth for the foreign-born population - Yemen (%)
Place of birth for the foreign-born population - Other Western Asia (%)
Place of birth for the foreign-born population - Eritrea (%)
Place of birth for the foreign-born population - Ethiopia (%)
Place of birth for the foreign-born population - Kenya (%)
Place of birth for the foreign-born population - Somalia (%)
Place of birth for the foreign-born population - Uganda (%)
Place of birth for the foreign-born population - Zimbabwe (%)
Place of birth for the foreign-born population - Other Eastern Africa (%)
Place of birth for the foreign-born population - Cameroon (%)
Place of birth for the foreign-born population - Congo (%)
Place of birth for the foreign-born population - Democratic Republic of Congo (Zaire) (%)
Place of birth for the foreign-born population - Other Middle Africa (%)
Place of birth for the foreign-born population - Egypt (%)
Place of birth for the foreign-born population - Morocco (%)
Place of birth for the foreign-born population - Sudan (%)
Place of birth for the foreign-born population - Other Northern Africa (%)
Place of birth for the foreign-born population - South Africa (%)
Place of birth for the foreign-born population - Other Southern Africa (%)
Place of birth for the foreign-born population - Cabo Verde (%)
Place of birth for the foreign-born population - Ghana (%)
Place of birth for the foreign-born population - Liberia (%)
Place of birth for the foreign-born population - Nigeria (%)
Place of birth for the foreign-born population - Senegal (%)
Place of birth for the foreign-born population - Sierra Leone (%)
Place of birth for the foreign-born population - Other Western Africa (%)
Place of birth for the foreign-born population - Australia (%)
Place of birth for the foreign-born population - New Zealand (%)
Place of birth for the foreign-born population - Fiji (%)
Place of birth for the foreign-born population - Micronesia (%)
Place of birth for the foreign-born population - Bahamas (%)
Place of birth for the foreign-born population - Barbados (%)
Place of birth for the foreign-born population - Cuba (%)
Place of birth for the foreign-born population - Dominica (%)
Place of birth for the foreign-born population - Dominican Republic (%)
Place of birth for the foreign-born population - Grenada (%)
Place of birth for the foreign-born population - Haiti (%)
Place of birth for the foreign-born population - Jamaica (%)
Place of birth for the foreign-born population - St. Vincent and the Grenadines (%)
Place of birth for the foreign-born population - Trinidad and Tobago (%)
Place of birth for the foreign-born population - West Indies (%)
Place of birth for the foreign-born population - Other Caribbean (%)
Place of birth for the foreign-born population - Belize (%)
Place of birth for the foreign-born population - Costa Rica (%)
Place of birth for the foreign-born population - El Salvador (%)
Place of birth for the foreign-born population - Guatemala (%)
Place of birth for the foreign-born population - Honduras (%)
Place of birth for the foreign-born population - Mexico (%)
Place of birth for the foreign-born population - Nicaragua (%)
Place of birth for the foreign-born population - Panama (%)
Place of birth for the foreign-born population - Other Central America (%)
Place of birth for the foreign-born population - Argentina (%)
Place of birth for the foreign-born population - Bolivia (%)
Place of birth for the foreign-born population - Brazil (%)
Place of birth for the foreign-born population - Chile (%)
Place of birth for the foreign-born population - Colombia (%)
Place of birth for the foreign-born population - Ecuador (%)
Place of birth for the foreign-born population - Guyana (%)
Place of birth for the foreign-born population - Peru (%)
Place of birth for the foreign-born population - Uruguay (%)
Place of birth for the foreign-born population - Venezuela (%)
Place of birth for the foreign-born population - Other South America (%)
Place of birth for the foreign-born population - Canada (%)
Place of birth for the foreign-born population - Other Northern America (%)
Place of birth for the foreign-born population - Other (%)
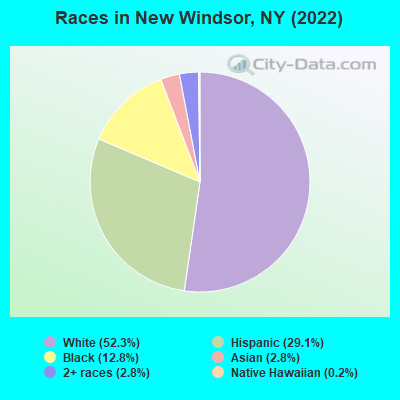
According to 2022 data, the most numerous races in New Windsor, NY are White alone (4,647 residents), Hispanic (2,590 residents), and Black alone (1,140 residents). 68.7% of New Windsor residents speak English at home. 12.0% of New Windsor, NY residents are foreign-born (8.2% born in Latin America, 1.9% born in Asia, 1.5% born in Europe), which is 83.7% less than the foreign-born rate of 22.0% across the entire state of New York.
Race distribution in New Windsor
2000 2022
11,760,981 62.0% White alone 2,867,583 15.1% Hispanic 2,812,623 14.8% Black alone 1,035,926 5.5% Asian alone 366,116 1.9% Two or more races 75,499 0.4% Other race alone 52,499 0.3% American Indian alone 5,230 0.03% Native Hawaiian and Other
10,408,933 52.9% White alone 3,867,299 19.7% Hispanic 2,633,840 13.4% Black alone 1,776,286 9.0% Asian alone 732,670 3.7% Two or more races 216,110 1.1% Other race alone 35,082 0.2% American Indian alone 6,931 0.04% Native Hawaiian and Other
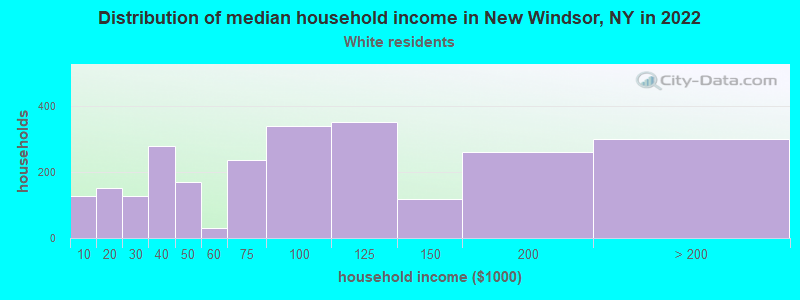
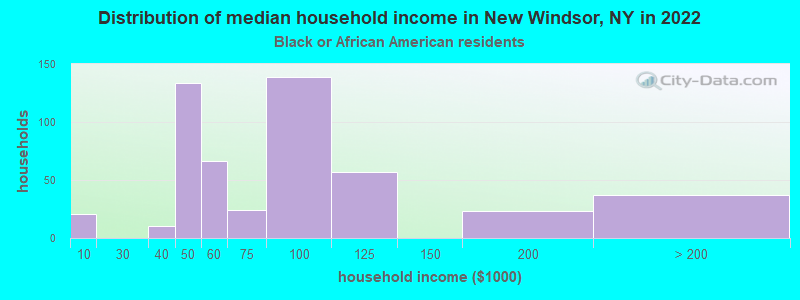
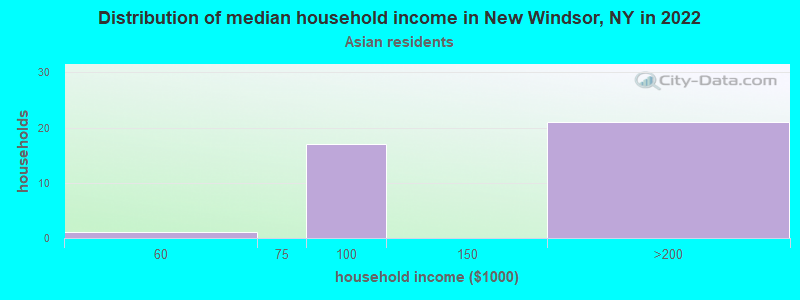
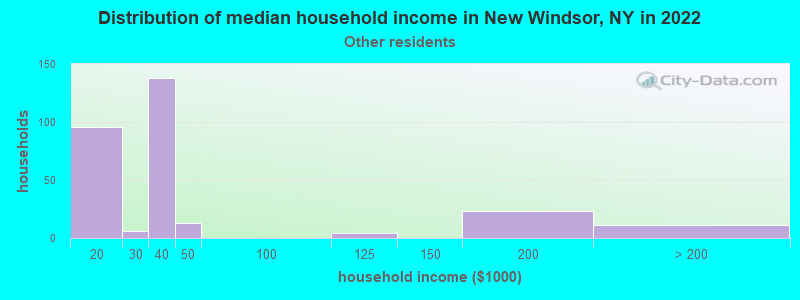
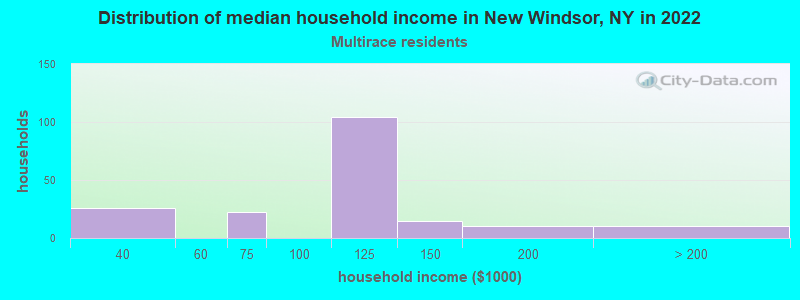
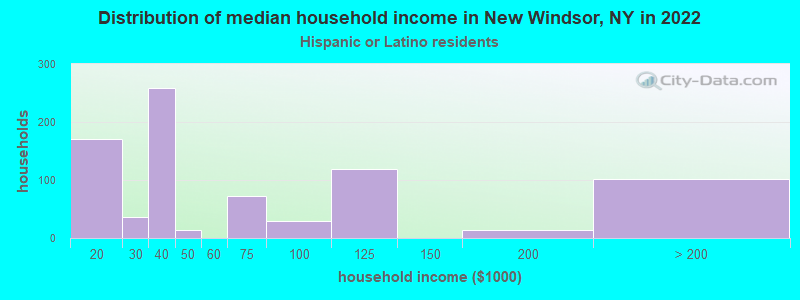
Income and house value in New Windsor Median household income in 2022 $86,550 White non-Hispanic householders$73,667 Black householders$34,671 Some other race householders$109,928 Two or more races householders$66,748 Hispanic or Latino race householdersMedian 2022 house value $343,615 White Non-Hispanic householders$409,546 Black or African American householders $308,711 Asian householders$401,531 Some other race householders$426,094 Two or more races householders$417,044 Hispanic or Latino householders
Median age by race in New Windsor
44.1 Median age for White residents41.2 48.4 35.4 Median age for Black or African American residents27.7 43.4 -671,929,823.9 Median age for American Indian / Alaska Native residents-677,083,332.7 -603,603,603.0 42.7 Median age for Asian residents20.8 57.7 -487,992,314.6 Median age for Native Hawaiian / Pacific Islander residents-477,502,295.2 -497,387,669.3 22.2 Median age for Other race residents31.4 20.1 32.6 Median age for Two or more races residents31.9 33.6 47.5 Median age for White alone residents45.0 51.6 26.9 Median age for Hispanic or Latino residents27.5 23.9
Owner/renter occupied households by race in New Windsor
House owners and renters - White residents 1,745 72.0% Owner occupied680 28.0% Renter occupiedHouse owners and renters - Black or African American residents 268 58.5% Owner occupied190 41.5% Renter occupiedHouse owners and renters - American Indian / Alaska Native residents 17 100.0% Owner occupiedHouse owners and renters - Asian residents 43 100.0% Owner occupiedHouse owners and renters - Other race residents 257 81.5% Owner occupied58 18.5% Renter occupiedHouse owners and renters - Two or more races residents 145 74.4% Owner occupied50 25.6% Renter occupiedHouse owners and renters - White alone residents 1,594 73.0% Owner occupied588 27.0% Renter occupiedHouse owners and renters - Hispanic or Latino residents 525 73.7% Owner occupied187 26.3% Renter occupied
Language usage in New Windsor
English speakers - Total 68.7% of residents of New Windsor speak English at home.
20.7% of residents speak Spanish at home 1,482 82.2% Speak English very well320 17.8% Speak English less than very well9.5% of residents speak other language at home 738 88.9% Speak English very well92 11.1% Speak English less than very well
English speakers - Born in the United States 92.0% of residents of New Windsor speak English at home.
3.6% of residents speak Spanish at home 10 31.2% Speak English very well22 68.8% Speak English less than very well7.2% of residents speak other language at home 63 100.0% Speak English very well
English speakers - Native, born elsewhere 40.9% of residents of New Windsor speak English at home.
50.8% of residents speak Spanish at home 138 61.1% Speak English very well88 38.9% Speak English less than very well4.7% of residents speak other language at home 21 100.0% Speak English very well
English speakers - Foreign-born 17.6% of residents of New Windsor speak English at home.
46.9% of residents speak Spanish at home 349 63.5% Speak English very well201 36.5% Speak English less than very well33.8% of residents speak other language at home 317 80.1% Speak English very well79 19.9% Speak English less than very well
White (Caucasian) - Speak only English Native:
82.1% (4,207)Foreign-born:
40.6% (80)
White (Caucasian) - Speak another language Native:
17.3% (889)Foreign-born:
59.3% (116)
Black or African American - Speak only English Native:
93.0% (862)Foreign-born:
30.2% (86)
Black or African American - Speak another language Native:
5.4% (50)Foreign-born:
85.3% (243)
Asian - Speak only English Native:
27.4% (32)Foreign-born:
3.0% (4)
Asian - Speak another language Native:
48.6% (56)Foreign-born:
96.4% (138)
Other race - Speak another language Native:
55.0% (344)Foreign-born:
97.2% (412)
Two or more races - Speak only English Native:
48.0% (307)Foreign-born:
12.4% (21)
Two or more races - Speak another language Native:
56.6% (362)Foreign-born:
82.6% (140)
White alone - Speak only English Native:
91.2% (4,012)Foreign-born:
47.4% (79)
White alone - Speak another language Native:
4.4% (195)Foreign-born:
53.1% (88)
Hispanic or Latino - Speak only English Native:
33.6% (645)Foreign-born:
4.4% (26)
Hispanic or Latino - Speak another language Native:
66.9% (1,285)Foreign-born:
95.9% (581)
Foreign-born residents in New Windsor 1,065 residents are foreign born (8.2% Latin America , 1.9% Asia , 1.5% Europe ).
This city:
12.0%New York:
22.6%
Marital status for residents in New Windsor Marital status - White (Caucasian) population 15 years and over
Males 41.1% Never married46.3% Now married1.8% Separated2.4% Widowed8.4% DivorcedFemales 31.9% Never married39.6% Now married2.9% Separated12.2% Widowed13.4% DivorcedWomen who did not give birth in the past 12 months Now married:
40.3% (477)Unmarried:
59.7% (708)
Marital status - Black or African American population 15 years and over
Males 58.1% Never married40.2% Now married1.7% Separated0.0% Widowed0.0% DivorcedFemales 48.6% Never married34.8% Now married0.0% Separated0.0% Widowed16.6% DivorcedWomen who gave birth in the past 12 months Now married:
0.0% (0)Unmarried:
100.0% (16)
Women who did not give birth in the past 12 months Now married:
30.8% (105)Unmarried:
69.2% (237)
Marital status - American Indian / Alaska Native population 15 years and over
Males 0.0% Never married0.0% Now married100.0% Separated0.0% Widowed0.0% DivorcedFemales 100.0% Never married0.0% Now married0.0% Separated0.0% Widowed0.0% DivorcedMarital status - Asian population 15 years and over
Males 73.0% Never married27.0% Now married0.0% Separated0.0% Widowed0.0% DivorcedFemales 27.5% Never married28.2% Now married0.0% Separated29.8% Widowed14.5% DivorcedWomen who did not give birth in the past 12 months Now married:
66.0% (39)Unmarried:
34.0% (20)
Marital status - Other race population 15 years and over
Males 37.9% Never married54.0% Now married8.1% Separated0.0% Widowed0.0% DivorcedFemales 57.0% Never married13.2% Now married24.7% Separated0.0% Widowed5.1% DivorcedWomen who did not give birth in the past 12 months Now married:
35.9% (254)Unmarried:
64.1% (453)
Marital status - Two or more races population 15 years and over
Males 33.6% Never married62.0% Now married4.4% Separated0.0% Widowed0.0% DivorcedFemales 26.5% Never married73.5% Now married0.0% Separated0.0% Widowed0.0% DivorcedWomen who did not give birth in the past 12 months Now married:
57.5% (107)Unmarried:
42.5% (79)
Marital status - White alone, not Hispanic / Latino population 15 years and over
Males 39.5% Never married47.9% Now married0.5% Separated2.9% Widowed9.2% DivorcedFemales 27.3% Never married42.4% Now married3.5% Separated14.4% Widowed12.5% DivorcedWomen who did not give birth in the past 12 months Now married:
46.4% (442)Unmarried:
53.6% (510)
Marital status - Hispanic or Latino population 15 years and over
Males 44.9% Never married43.4% Now married9.2% Separated0.0% Widowed2.5% DivorcedFemales 50.3% Never married26.4% Now married12.0% Separated0.5% Widowed10.8% DivorcedWomen who gave birth in the past 12 months Now married:
0.0% (0)Unmarried:
100.0% (16)
Women who did not give birth in the past 12 months Now married:
35.6% (353)Unmarried:
64.4% (638)
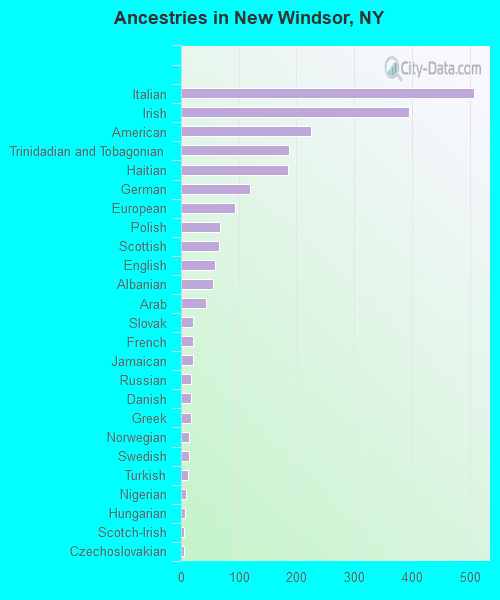
Ancestries in New Windsor
508 11.6% Italian395 9.0% Irish225 5.1% American187 4.3% Trinidadian and Tobagonian185 4.2% Haitian119 2.7% German94 2.1% European68 1.6% Polish65 1.5% Scottish59 1.3% English55 1.3% Albanian44 1.0% Arab21 0.5% Slovak20 0.5% French20 0.5% Jamaican18 0.4% Russian17 0.4% Danish17 0.4% Greek13 0.3% Norwegian13 0.3% Swedish12 0.3% Turkish9 0.2% Nigerian7 0.2% Hungarian6 0.1% Scotch-Irish5 0.1% Czechoslovakian4 0.09% French Canadian
Children Nativity (place of birth) in New Windsor
Children under 6 years - Living with two parents Both parents native 120 100.0% NativeBoth parents foreign-born 54 100.0% NativeOne native, one foreign-born parent 13 100.0% NativeChildren under 6 years - Living with one parent Native parent 86 100.0% NativeForeign-born parent 1 98.2% NativeChildren 6 to 17 years - Living with two parents Both parents native 509 100.0% NativeBoth parents foreign-born 191 100.0% NativeOne native, one foreign-born parent 23 100.0% NativeChildren 6 to 17 years - Living with one parent Native parent 324 100.0% NativeForeign-born parent 136 51.7% Native127 48.3% Foreign-born
Grandparents responsible for own grandchildren in New Windsor
Grandparents (30 to 59 years) Black or African American 53 100.0% Responsible for grandchildrenAsian 1 95.3% Not responsible for grandchildrenTwo or more races 80 100.0% Not responsible for grandchildrenHispanic or Latino 81 100.0% Not responsible for grandchildren
Grandparents (60 years and over) Asian 17 100.0% Responsible for grandchildren