Races in Newark, New York (NY) Detailed Stats
Data:
Races - White alone (%)
Races - White alone (% change since 2000)
Races - Black alone (%)
Races - Black alone (% change since 2000)
Races - American Indian alone (%)
Races - American Indian alone (% change since 2000)
Races - Asian alone (%)
Races - Asian alone (% change since 2000)
Races - Hispanic (%)
Races - Hispanic (% change since 2000)
Races - Native Hawaiian and Other Pacific Islander alone (%)
Races - Native Hawaiian and Other Pacific Islander alone (% change since 2000)
Races - Two or more races(%)
Races - Two or more races(% change since 2000)
Races - Other race alone (%)
Races - Other race alone (% change since 2000)
Racial diversity
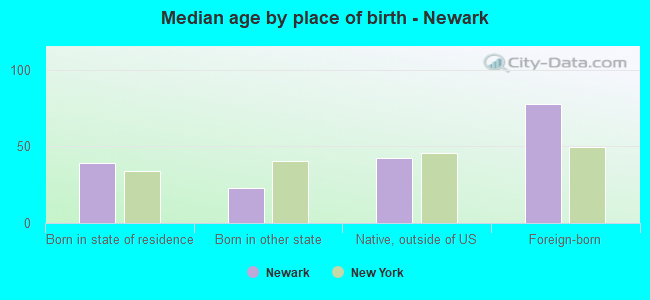
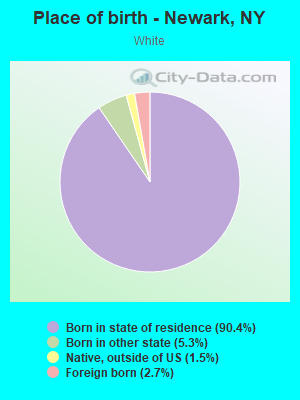
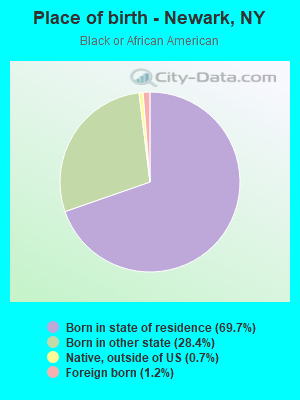
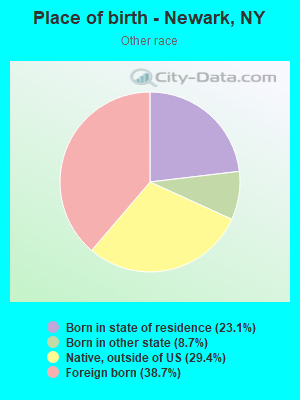
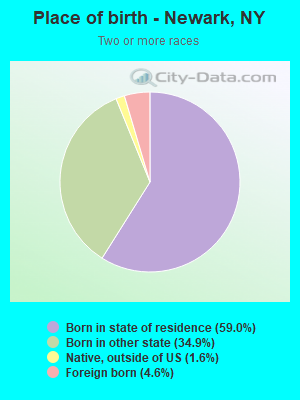
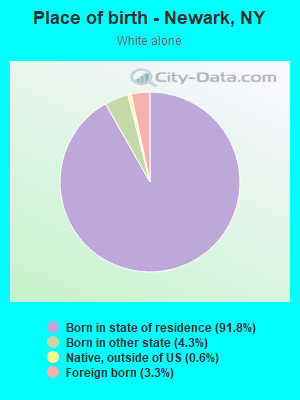
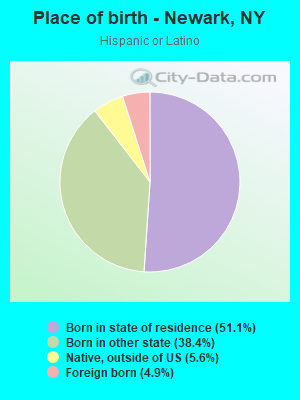
Place of birth - Born in state of residence (%)
Place of birth - Born in state of residence (%) - White
Place of birth - Born in state of residence (%) - Black or African American
Place of birth - Born in state of residence (%) - Asian
Place of birth - Born in state of residence (%) - Hispanic or Latino
Place of birth - Born in state of residence (%) - American Indian and Alaska Native
Place of birth - Born in state of residence (%) - Multirace
Place of birth - Born in state of residence (%) - Other Race
Place of birth - Born in other state (%)
Place of birth - Born in other state (%) - White
Place of birth - Born in other state (%) - Black or African American
Place of birth - Born in other state (%) - Asian
Place of birth - Born in other state (%) - Hispanic or Latino
Place of birth - Born in other state (%) - American Indian and Alaska Native
Place of birth - Born in other state (%) - Multirace
Place of birth - Born in other state (%) - Other Race
Place of birth - Native, outside of US (%)
Place of birth - Native, outside of US (%) - White
Place of birth - Native, outside of US (%) - Black or African American
Place of birth - Native, outside of US (%) - Asian
Place of birth - Native, outside of US (%) - Hispanic or Latino
Place of birth - Native, outside of US (%) - American Indian and Alaska Native
Place of birth - Native, outside of US (%) - Multirace
Place of birth - Native, outside of US (%) - Other Race
Place of birth - Foreign born (%)
Place of birth - Foreign born (%) - White
Place of birth - Foreign born (%) - Black or African American
Place of birth - Foreign born (%) - Asian
Place of birth - Foreign born (%) - Hispanic or Latino
Place of birth - Foreign born (%) - American Indian and Alaska Native
Place of birth - Foreign born (%) - Multirace
Place of birth - Foreign born (%) - Other Race
Residents speaking English at home (%)
Residents speaking English at home - Born in the United States (%)
Residents speaking English at home - Native, born elsewhere (%)
Residents speaking English at home - Foreign born (%)
Residents speaking Spanish at home (%)
Residents speaking Spanish at home - Born in the United States (%)
Residents speaking Spanish at home - Native, born elsewhere (%)
Residents speaking Spanish at home - Foreign born (%)
Residents speaking other language at home (%)
Residents speaking other language at home - Born in the United States (%)
Residents speaking other language at home - Native, born elsewhere (%)
Residents speaking other language at home - Foreign born (%)
Marital status - Never married (%)
Marital status - Now married (%)
Marital status - Separated (%)
Marital status - Widowed (%)
Marital status - Divorced (%)
Ancestries Reported - Arab (%)
Ancestries Reported - Czech (%)
Ancestries Reported - Danish (%)
Ancestries Reported - Dutch (%)
Ancestries Reported - English (%)
Ancestries Reported - French (%)
Ancestries Reported - French Canadian (%)
Ancestries Reported - German (%)
Ancestries Reported - Greek (%)
Ancestries Reported - Hungarian (%)
Ancestries Reported - Irish (%)
Ancestries Reported - Italian (%)
Ancestries Reported - Lithuanian (%)
Ancestries Reported - Norwegian (%)
Ancestries Reported - Polish (%)
Ancestries Reported - Portuguese (%)
Ancestries Reported - Russian (%)
Ancestries Reported - Scotch-Irish (%)
Ancestries Reported - Scottish (%)
Ancestries Reported - Slovak (%)
Ancestries Reported - Subsaharan African (%)
Ancestries Reported - Swedish (%)
Ancestries Reported - Swiss (%)
Ancestries Reported - Ukrainian (%)
Ancestries Reported - United States (%)
Ancestries Reported - Welsh (%)
Ancestries Reported - West Indian (%)
Ancestries Reported - Other (%)
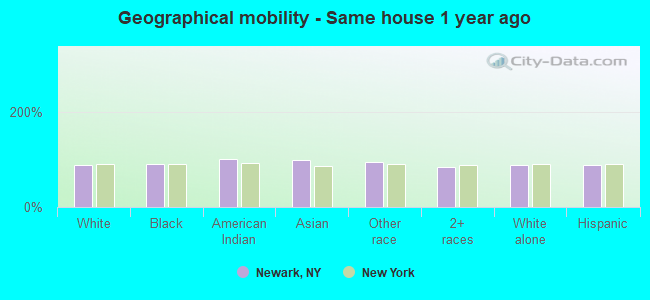
Geographical mobility - Same house 1 year ago (%)
Geographical mobility - Same house 1 year ago (%) - White
Geographical mobility - Same house 1 year ago (%) - Black or African American
Geographical mobility - Same house 1 year ago (%) - Asian
Geographical mobility - Same house 1 year ago (%) - Hispanic or Latino
Geographical mobility - Same house 1 year ago (%) - American Indian and Alaska Native
Geographical mobility - Same house 1 year ago (%) - Multirace
Geographical mobility - Same house 1 year ago (%) - Other Race
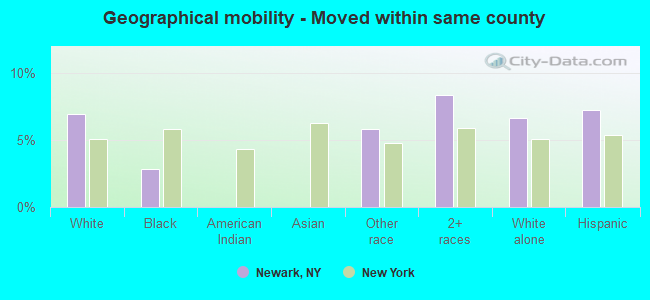
Geographical mobility - Moved within same county (%)
Geographical mobility - Moved within same county (%) - White
Geographical mobility - Moved within same county (%) - Black or African American
Geographical mobility - Moved within same county (%) - Asian
Geographical mobility - Moved within same county (%) - Hispanic or Latino
Geographical mobility - Moved within same county (%) - American Indian and Alaska Native
Geographical mobility - Moved within same county (%) - Multirace
Geographical mobility - Moved within same county (%) - Other Race
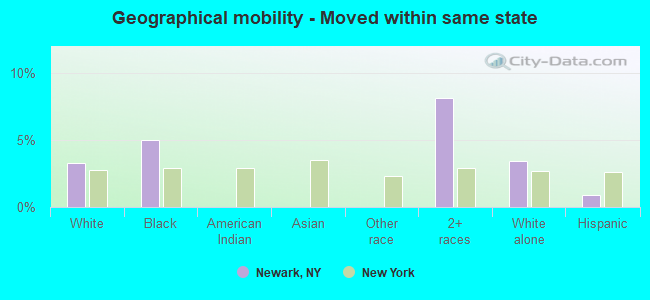
Geographical mobility - Moved from different county within same state (%)
Geographical mobility - Moved from different county within same state (%) - White
Geographical mobility - Moved from different county within same state (%) - Black or African American
Geographical mobility - Moved from different county within same state (%) - Asian
Geographical mobility - Moved from different county within same state (%) - Hispanic or Latino
Geographical mobility - Moved from different county within same state (%) - American Indian and Alaska Native
Geographical mobility - Moved from different county within same state (%) - Multirace
Geographical mobility - Moved from different county within same state (%) - Other Race
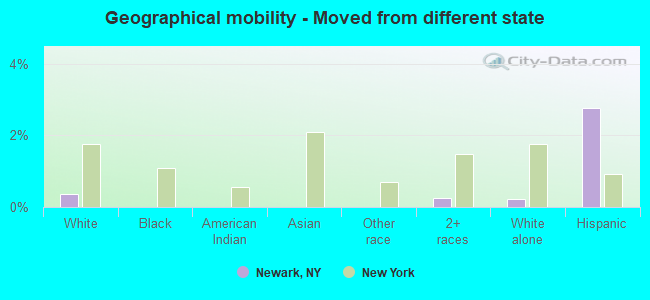
Geographical mobility - Moved from different state (%)
Geographical mobility - Moved from different state (%) - White
Geographical mobility - Moved from different state (%) - Black or African American
Geographical mobility - Moved from different state (%) - Asian
Geographical mobility - Moved from different state (%) - Hispanic or Latino
Geographical mobility - Moved from different state (%) - American Indian and Alaska Native
Geographical mobility - Moved from different state (%) - Multirace
Geographical mobility - Moved from different state (%) - Other Race
Geographical mobility - Moved from abroad (%)
Geographical mobility - Moved from abroad (%) - White
Geographical mobility - Moved from abroad (%) - Black or African American
Geographical mobility - Moved from abroad (%) - Asian
Geographical mobility - Moved from abroad (%) - Hispanic or Latino
Geographical mobility - Moved from abroad (%) - American Indian and Alaska Native
Geographical mobility - Moved from abroad (%) - Multirace
Geographical mobility - Moved from abroad (%) - Other Race
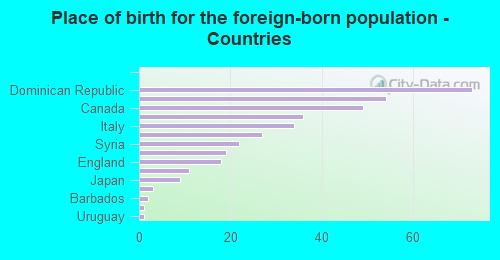
Place of birth for the foreign-born population - Ireland (%)
Place of birth for the foreign-born population - Denmark (%)
Place of birth for the foreign-born population - Norway (%)
Place of birth for the foreign-born population - Sweden (%)
Place of birth for the foreign-born population - United Kingdom (%)
Place of birth for the foreign-born population - England (%)
Place of birth for the foreign-born population - Scotland (%)
Place of birth for the foreign-born population - Other Northern Europe (%)
Place of birth for the foreign-born population - Austria (%)
Place of birth for the foreign-born population - Belgium (%)
Place of birth for the foreign-born population - France (%)
Place of birth for the foreign-born population - Germany (%)
Place of birth for the foreign-born population - Netherlands (%)
Place of birth for the foreign-born population - Switzerland (%)
Place of birth for the foreign-born population - Other Western Europe (%)
Place of birth for the foreign-born population - Greece (%)
Place of birth for the foreign-born population - Italy (%)
Place of birth for the foreign-born population - Portugal (%)
Place of birth for the foreign-born population - Spain (%)
Place of birth for the foreign-born population - Other Southern Europe (%)
Place of birth for the foreign-born population - Albania (%)
Place of birth for the foreign-born population - Belarus (%)
Place of birth for the foreign-born population - Bosnia and Herzegovina (%)
Place of birth for the foreign-born population - Bulgaria (%)
Place of birth for the foreign-born population - Croatia (%)
Place of birth for the foreign-born population - Czechoslovakia (%)
Place of birth for the foreign-born population - Hungary (%)
Place of birth for the foreign-born population - Latvia (%)
Place of birth for the foreign-born population - Lithuania (%)
Place of birth for the foreign-born population - North Macedonia (Macedonia) (%)
Place of birth for the foreign-born population - Moldova (%)
Place of birth for the foreign-born population - Poland (%)
Place of birth for the foreign-born population - Romania (%)
Place of birth for the foreign-born population - Russia (%)
Place of birth for the foreign-born population - Serbia (%)
Place of birth for the foreign-born population - Ukraine (%)
Place of birth for the foreign-born population - Other Eastern Europe (%)
Place of birth for the foreign-born population - China (%)
Place of birth for the foreign-born population - Hong Kong (%)
Place of birth for the foreign-born population - Taiwan (%)
Place of birth for the foreign-born population - Japan (%)
Place of birth for the foreign-born population - Korea (%)
Place of birth for the foreign-born population - Other Eastern Asia (%)
Place of birth for the foreign-born population - Afghanistan (%)
Place of birth for the foreign-born population - Bangladesh (%)
Place of birth for the foreign-born population - India (%)
Place of birth for the foreign-born population - Iran (%)
Place of birth for the foreign-born population - Kazakhstan (%)
Place of birth for the foreign-born population - Nepal (%)
Place of birth for the foreign-born population - Pakistan (%)
Place of birth for the foreign-born population - Sri Lanka (%)
Place of birth for the foreign-born population - Uzbekistan (%)
Place of birth for the foreign-born population - Other South Central Asia (%)
Place of birth for the foreign-born population - Burma (%)
Place of birth for the foreign-born population - Cambodia (%)
Place of birth for the foreign-born population - Indonesia (%)
Place of birth for the foreign-born population - Laos (%)
Place of birth for the foreign-born population - Malaysia (%)
Place of birth for the foreign-born population - Philippines (%)
Place of birth for the foreign-born population - Singapore (%)
Place of birth for the foreign-born population - Thailand (%)
Place of birth for the foreign-born population - Vietnam (%)
Place of birth for the foreign-born population - Other South Eastern Asia (%)
Place of birth for the foreign-born population - Armenia (%)
Place of birth for the foreign-born population - Iraq (%)
Place of birth for the foreign-born population - Israel (%)
Place of birth for the foreign-born population - Jordan (%)
Place of birth for the foreign-born population - Kuwait (%)
Place of birth for the foreign-born population - Lebanon (%)
Place of birth for the foreign-born population - Saudi Arabia (%)
Place of birth for the foreign-born population - Syria (%)
Place of birth for the foreign-born population - Turkey (%)
Place of birth for the foreign-born population - Yemen (%)
Place of birth for the foreign-born population - Other Western Asia (%)
Place of birth for the foreign-born population - Eritrea (%)
Place of birth for the foreign-born population - Ethiopia (%)
Place of birth for the foreign-born population - Kenya (%)
Place of birth for the foreign-born population - Somalia (%)
Place of birth for the foreign-born population - Uganda (%)
Place of birth for the foreign-born population - Zimbabwe (%)
Place of birth for the foreign-born population - Other Eastern Africa (%)
Place of birth for the foreign-born population - Cameroon (%)
Place of birth for the foreign-born population - Congo (%)
Place of birth for the foreign-born population - Democratic Republic of Congo (Zaire) (%)
Place of birth for the foreign-born population - Other Middle Africa (%)
Place of birth for the foreign-born population - Egypt (%)
Place of birth for the foreign-born population - Morocco (%)
Place of birth for the foreign-born population - Sudan (%)
Place of birth for the foreign-born population - Other Northern Africa (%)
Place of birth for the foreign-born population - South Africa (%)
Place of birth for the foreign-born population - Other Southern Africa (%)
Place of birth for the foreign-born population - Cabo Verde (%)
Place of birth for the foreign-born population - Ghana (%)
Place of birth for the foreign-born population - Liberia (%)
Place of birth for the foreign-born population - Nigeria (%)
Place of birth for the foreign-born population - Senegal (%)
Place of birth for the foreign-born population - Sierra Leone (%)
Place of birth for the foreign-born population - Other Western Africa (%)
Place of birth for the foreign-born population - Australia (%)
Place of birth for the foreign-born population - New Zealand (%)
Place of birth for the foreign-born population - Fiji (%)
Place of birth for the foreign-born population - Micronesia (%)
Place of birth for the foreign-born population - Bahamas (%)
Place of birth for the foreign-born population - Barbados (%)
Place of birth for the foreign-born population - Cuba (%)
Place of birth for the foreign-born population - Dominica (%)
Place of birth for the foreign-born population - Dominican Republic (%)
Place of birth for the foreign-born population - Grenada (%)
Place of birth for the foreign-born population - Haiti (%)
Place of birth for the foreign-born population - Jamaica (%)
Place of birth for the foreign-born population - St. Vincent and the Grenadines (%)
Place of birth for the foreign-born population - Trinidad and Tobago (%)
Place of birth for the foreign-born population - West Indies (%)
Place of birth for the foreign-born population - Other Caribbean (%)
Place of birth for the foreign-born population - Belize (%)
Place of birth for the foreign-born population - Costa Rica (%)
Place of birth for the foreign-born population - El Salvador (%)
Place of birth for the foreign-born population - Guatemala (%)
Place of birth for the foreign-born population - Honduras (%)
Place of birth for the foreign-born population - Mexico (%)
Place of birth for the foreign-born population - Nicaragua (%)
Place of birth for the foreign-born population - Panama (%)
Place of birth for the foreign-born population - Other Central America (%)
Place of birth for the foreign-born population - Argentina (%)
Place of birth for the foreign-born population - Bolivia (%)
Place of birth for the foreign-born population - Brazil (%)
Place of birth for the foreign-born population - Chile (%)
Place of birth for the foreign-born population - Colombia (%)
Place of birth for the foreign-born population - Ecuador (%)
Place of birth for the foreign-born population - Guyana (%)
Place of birth for the foreign-born population - Peru (%)
Place of birth for the foreign-born population - Uruguay (%)
Place of birth for the foreign-born population - Venezuela (%)
Place of birth for the foreign-born population - Other South America (%)
Place of birth for the foreign-born population - Canada (%)
Place of birth for the foreign-born population - Other Northern America (%)
Place of birth for the foreign-born population - Other (%)
Latest news about races in Newark, NY collected exclusively by city-data.com from local newspapers, TV, and radio stations
According to 2022 data, the most numerous races in Newark, NY are White alone (6,900 residents), Hispanic (1,252 residents), and Black alone (488 residents). 93.7% of Newark residents speak English at home. 4.1% of Newark, NY residents are foreign-born (1.5% born in Latin America, 1.1% born in Asia, 0.9% born in Europe, 0.5% born in North America), which is 439.9% less than the foreign-born rate of 22.0% across the entire state of New York.
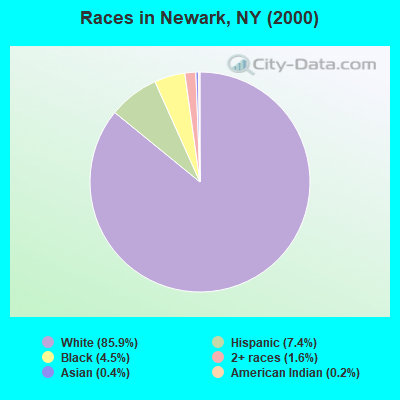
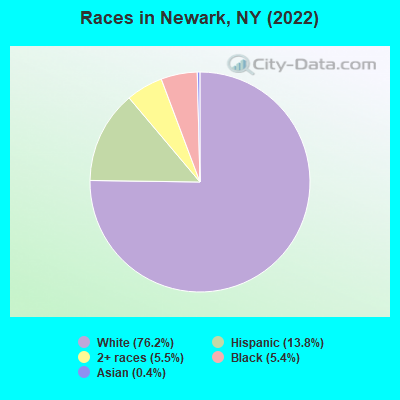
Race distribution in Newark
2000 2022
11,760,981 62.0% White alone 2,867,583 15.1% Hispanic 2,812,623 14.8% Black alone 1,035,926 5.5% Asian alone 366,116 1.9% Two or more races 75,499 0.4% Other race alone 52,499 0.3% American Indian alone 5,230 0.03% Native Hawaiian and Other
10,408,933 52.9% White alone 3,867,299 19.7% Hispanic 2,633,840 13.4% Black alone 1,776,286 9.0% Asian alone 732,670 3.7% Two or more races 216,110 1.1% Other race alone 35,082 0.2% American Indian alone 6,931 0.04% Native Hawaiian and Other
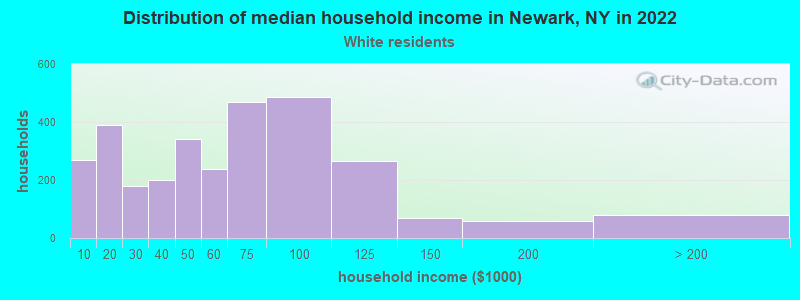
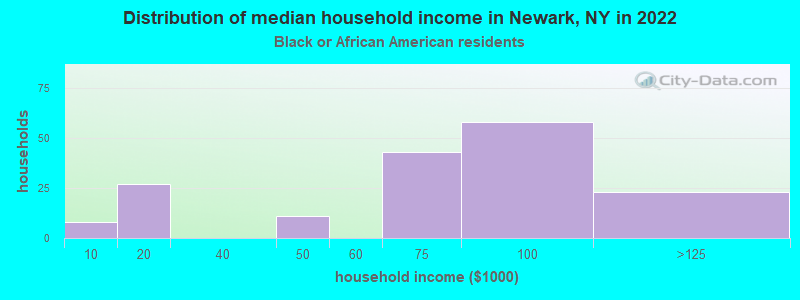
Income and house value in Newark Median household income in 2022 $60,108 White non-Hispanic householders$66,160 Black householders$57,771 Some other race householders$56,239 Two or more races householders$33,222 Hispanic or Latino race householdersMedian 2022 house value $129,464 White Non-Hispanic householders$98,486 Black or African American householders $189,093 Asian householders$70,731 Some other race householders$116,392 Two or more races householders$79,326 Hispanic or Latino householders
Median age by race in Newark
44.1 Median age for White residents41.4 44.6 24.7 Median age for Black or African American residents25.6 37.2 -676,300,577.4 Median age for American Indian / Alaska Native residents-666,666,666.0 -642,115,202.4 40.8 Median age for Asian residents43.9 33.1 -666,666,666.0 Median age for Native Hawaiian / Pacific Islander residents-666,666,666.0 -666,666,666.0 59.9 Median age for Other race residents68.1 64.9 15.5 Median age for Two or more races residents14.5 41.7 45.7 Median age for White alone residents45.1 46.2 24.4 Median age for Hispanic or Latino residents28.3 16.8
Owner/renter occupied households by race in Newark
House owners and renters - White residents 1,869 64.1% Owner occupied1,047 35.9% Renter occupiedHouse owners and renters - Black or African American residents 40 20.4% Owner occupied155 79.6% Renter occupiedHouse owners and renters - American Indian / Alaska Native residents 113 100.0% Owner occupiedHouse owners and renters - Asian residents 25 100.0% Renter occupiedHouse owners and renters - Other race residents 4 2.7% Owner occupied142 97.3% Renter occupiedHouse owners and renters - Two or more races residents 186 72.7% Owner occupied70 27.3% Renter occupiedHouse owners and renters - White alone residents 1,838 63.8% Owner occupied1,045 36.2% Renter occupiedHouse owners and renters - Hispanic or Latino residents 401 73.4% Owner occupied145 26.6% Renter occupied
Language usage in Newark
English speakers - Total 93.7% of residents of Newark speak English at home.
4.8% of residents speak Spanish at home 356 87.5% Speak English very well51 12.5% Speak English less than very well1.6% of residents speak other language at home 89 67.4% Speak English very well43 32.6% Speak English less than very well
English speakers - Born in the United States 84.0% of residents of Newark speak English at home.
10.0% of residents speak Spanish at home 80 100.0% Speak English very well
All residents speak only English at home
English speakers - Foreign-born 42.4% of residents of Newark speak English at home.
22.7% of residents speak Spanish at home 74 78.7% Speak English very well20 21.3% Speak English less than very well38.6% of residents speak other language at home 116 72.5% Speak English very well44 27.5% Speak English less than very well
White (Caucasian) - Speak only English Native:
98.7% (6,644)Foreign-born:
31.8% (63)
White (Caucasian) - Speak another language Native:
1.3% (90)Foreign-born:
37.3% (74)
Black or African American - Speak only English Native:
99.6% (380)Foreign-born:
41.8% (3)
Black or African American - Speak another language Native:
0.9% (4)Foreign-born:
59.3% (4)
Other race - Speak another language Native:
44.2% (72)Foreign-born:
99.8% (103)
Two or more races - Speak only English Native:
96.7% (847)Foreign-born:
94.3% (52)
White alone - Speak only English Native:
99.7% (6,447)Foreign-born:
29.4% (67)
White alone - Speak another language Native:
0.0% (2)Foreign-born:
14.2% (33)
Hispanic or Latino - Speak only English Native:
73.9% (617)Foreign-born:
29.2% (39)
Hispanic or Latino - Speak another language Native:
28.6% (239)Foreign-born:
71.9% (97)
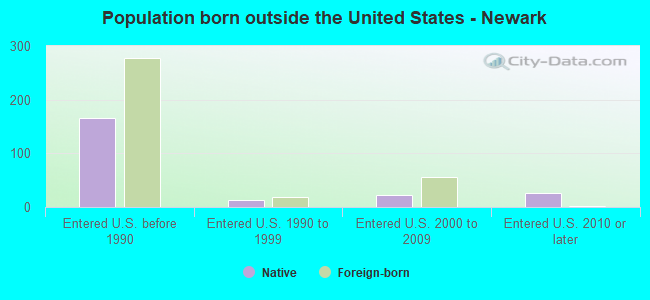
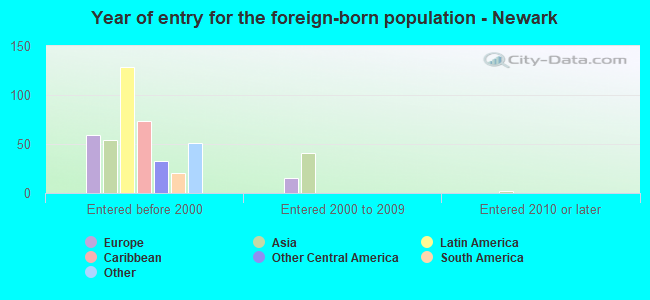
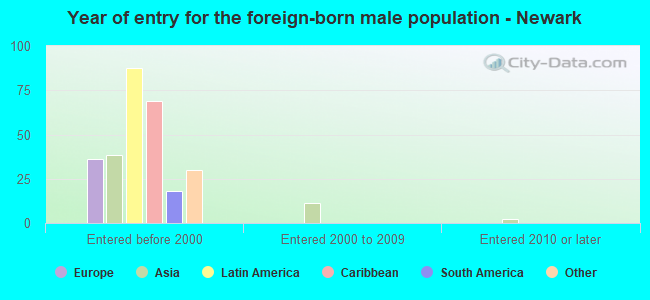
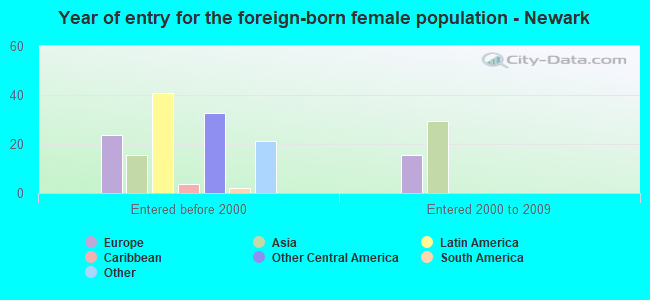
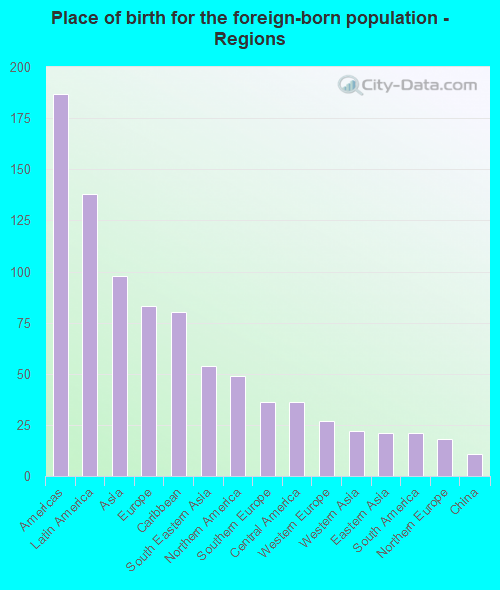
Foreign-born residents in Newark 369 residents are foreign born (1.5% Latin America , 1.1% Asia , 0.9% Europe , 0.5% North America ).
This city:
4.1%New York:
22.6%
Marital status for residents in Newark Marital status - White (Caucasian) population 15 years and over
Males 38.0% Never married42.3% Now married1.1% Separated4.8% Widowed13.8% DivorcedFemales 30.9% Never married41.4% Now married6.3% Separated8.2% Widowed13.3% DivorcedWomen who gave birth in the past 12 months Now married:
81.7% (87)Unmarried:
18.3% (20)
Women who did not give birth in the past 12 months Now married:
44.8% (635)Unmarried:
55.2% (783)
Marital status - Black or African American population 15 years and over
Males 58.7% Never married10.2% Now married11.9% Separated1.3% Widowed17.9% DivorcedFemales 52.8% Never married9.3% Now married0.0% Separated20.4% Widowed17.6% DivorcedWomen who did not give birth in the past 12 months Now married:
0.0% (0)Unmarried:
100.0% (59)
Marital status - Asian population 15 years and over
Males 50.0% Never married35.0% Now married0.0% Separated0.0% Widowed15.0% DivorcedFemales 35.1% Never married64.9% Now married0.0% Separated0.0% Widowed0.0% DivorcedWomen who did not give birth in the past 12 months Now married:
43.5% (10)Unmarried:
56.5% (13)
Marital status - Other race population 15 years and over
Males 13.9% Never married18.1% Now married0.0% Separated0.0% Widowed68.1% DivorcedFemales 51.8% Never married0.0% Now married0.0% Separated5.4% Widowed42.9% DivorcedWomen who did not give birth in the past 12 months Now married:
0.0% (0)Unmarried:
100.0% (30)
Marital status - Two or more races population 15 years and over
Males 56.6% Never married43.4% Now married0.0% Separated0.0% Widowed0.0% DivorcedFemales 25.4% Never married51.3% Now married0.0% Separated0.0% Widowed23.3% DivorcedWomen who did not give birth in the past 12 months Now married:
66.9% (157)Unmarried:
33.1% (78)
Marital status - White alone, not Hispanic / Latino population 15 years and over
Males 37.6% Never married41.8% Now married1.2% Separated5.1% Widowed14.4% DivorcedFemales 31.1% Never married41.7% Now married5.6% Separated8.2% Widowed13.4% DivorcedWomen who gave birth in the past 12 months Now married:
81.7% (87)Unmarried:
18.3% (20)
Women who did not give birth in the past 12 months Now married:
44.0% (614)Unmarried:
56.0% (783)
Marital status - Hispanic or Latino population 15 years and over
Males 34.2% Never married43.3% Now married0.0% Separated0.0% Widowed22.5% DivorcedFemales 12.8% Never married43.6% Now married8.6% Separated3.7% Widowed31.3% DivorcedWomen who did not give birth in the past 12 months Now married:
81.4% (124)Unmarried:
18.6% (28)
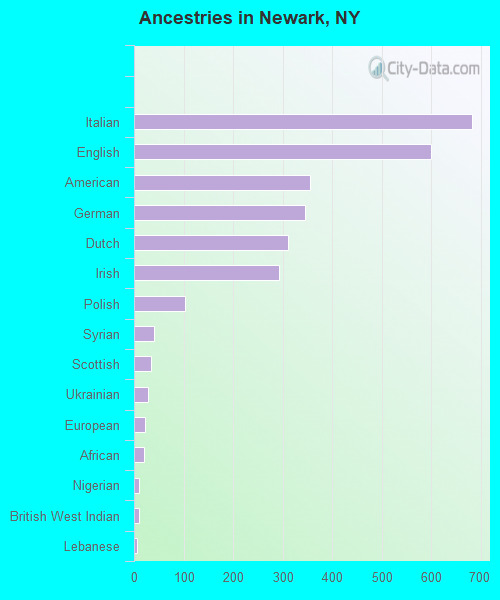
Ancestries in Newark
682 19.0% Italian600 16.7% English355 9.9% American344 9.6% German310 8.6% Dutch292 8.1% Irish102 2.8% Polish41 1.1% Syrian34 0.9% Scottish28 0.8% Ukrainian22 0.6% European20 0.6% African11 0.3% Nigerian10 0.3% British West Indian7 0.2% Lebanese4 0.1% Welsh3 0.08% Haitian2 0.06% Barbadian1 0.03% Greek
Children Nativity (place of birth) in Newark
Children under 6 years - Living with two parents Both parents native 283 100.0% NativeChildren under 6 years - Living with one parent Native parent 272 100.0% Native
Children 6 to 17 years - Living with two parents Both parents native 708 100.0% NativeBoth parents foreign-born 18 100.0% NativeChildren 6 to 17 years - Living with one parent Native parent 608 100.0% Native
Grandparents responsible for own grandchildren in Newark
Grandparents (30 to 59 years) White / Caucasian 28 100.0% Responsible for grandchildrenOther race 26 100.0% Responsible for grandchildrenWhite alone, not Hispanic / Latino 30 100.0% Responsible for grandchildrenHispanic or Latino 22 100.0% Responsible for grandchildren
Grandparents (60 years and over)