Races in Newberg, Oregon (OR) Detailed Stats
Data:
Races - White alone (%)
Races - White alone (% change since 2000)
Races - Black alone (%)
Races - Black alone (% change since 2000)
Races - American Indian alone (%)
Races - American Indian alone (% change since 2000)
Races - Asian alone (%)
Races - Asian alone (% change since 2000)
Races - Hispanic (%)
Races - Hispanic (% change since 2000)
Races - Native Hawaiian and Other Pacific Islander alone (%)
Races - Native Hawaiian and Other Pacific Islander alone (% change since 2000)
Races - Two or more races(%)
Races - Two or more races(% change since 2000)
Races - Other race alone (%)
Races - Other race alone (% change since 2000)
Racial diversity
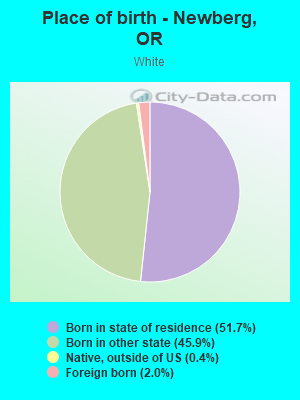
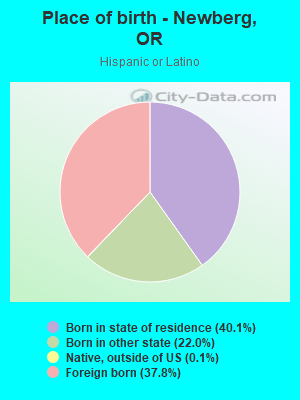
Place of birth - Born in state of residence (%)
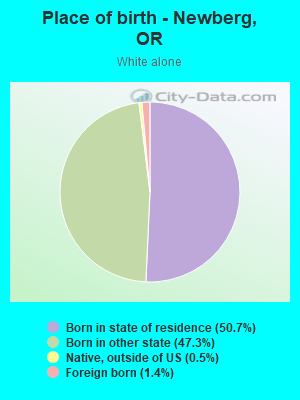
Place of birth - Born in state of residence (%) - White
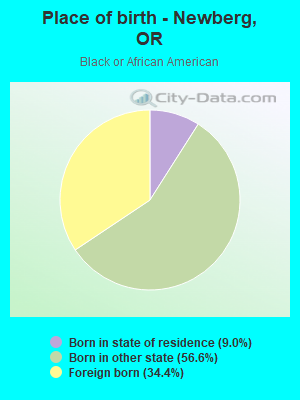
Place of birth - Born in state of residence (%) - Black or African American
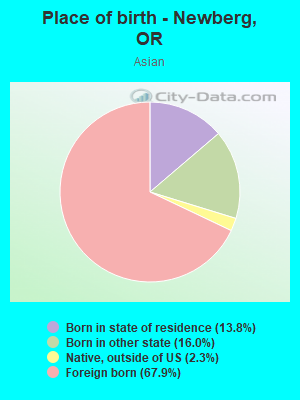
Place of birth - Born in state of residence (%) - Asian
Place of birth - Born in state of residence (%) - Hispanic or Latino
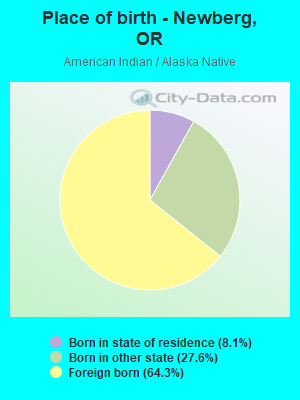
Place of birth - Born in state of residence (%) - American Indian and Alaska Native
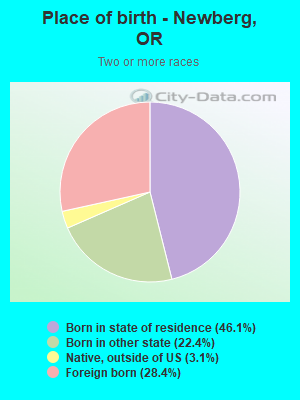
Place of birth - Born in state of residence (%) - Multirace
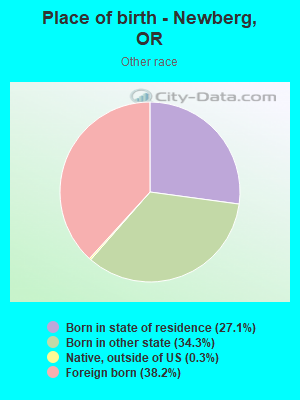
Place of birth - Born in state of residence (%) - Other Race
Place of birth - Born in other state (%)
Place of birth - Born in other state (%) - White
Place of birth - Born in other state (%) - Black or African American
Place of birth - Born in other state (%) - Asian
Place of birth - Born in other state (%) - Hispanic or Latino
Place of birth - Born in other state (%) - American Indian and Alaska Native
Place of birth - Born in other state (%) - Multirace
Place of birth - Born in other state (%) - Other Race
Place of birth - Native, outside of US (%)
Place of birth - Native, outside of US (%) - White
Place of birth - Native, outside of US (%) - Black or African American
Place of birth - Native, outside of US (%) - Asian
Place of birth - Native, outside of US (%) - Hispanic or Latino
Place of birth - Native, outside of US (%) - American Indian and Alaska Native
Place of birth - Native, outside of US (%) - Multirace
Place of birth - Native, outside of US (%) - Other Race
Place of birth - Foreign born (%)
Place of birth - Foreign born (%) - White
Place of birth - Foreign born (%) - Black or African American
Place of birth - Foreign born (%) - Asian
Place of birth - Foreign born (%) - Hispanic or Latino
Place of birth - Foreign born (%) - American Indian and Alaska Native
Place of birth - Foreign born (%) - Multirace
Place of birth - Foreign born (%) - Other Race
Residents speaking English at home (%)
Residents speaking English at home - Born in the United States (%)
Residents speaking English at home - Native, born elsewhere (%)
Residents speaking English at home - Foreign born (%)
Residents speaking Spanish at home (%)
Residents speaking Spanish at home - Born in the United States (%)
Residents speaking Spanish at home - Native, born elsewhere (%)
Residents speaking Spanish at home - Foreign born (%)
Residents speaking other language at home (%)
Residents speaking other language at home - Born in the United States (%)
Residents speaking other language at home - Native, born elsewhere (%)
Residents speaking other language at home - Foreign born (%)
Marital status - Never married (%)
Marital status - Now married (%)
Marital status - Separated (%)
Marital status - Widowed (%)
Marital status - Divorced (%)
Ancestries Reported - Arab (%)
Ancestries Reported - Czech (%)
Ancestries Reported - Danish (%)
Ancestries Reported - Dutch (%)
Ancestries Reported - English (%)
Ancestries Reported - French (%)
Ancestries Reported - French Canadian (%)
Ancestries Reported - German (%)
Ancestries Reported - Greek (%)
Ancestries Reported - Hungarian (%)
Ancestries Reported - Irish (%)
Ancestries Reported - Italian (%)
Ancestries Reported - Lithuanian (%)
Ancestries Reported - Norwegian (%)
Ancestries Reported - Polish (%)
Ancestries Reported - Portuguese (%)
Ancestries Reported - Russian (%)
Ancestries Reported - Scotch-Irish (%)
Ancestries Reported - Scottish (%)
Ancestries Reported - Slovak (%)
Ancestries Reported - Subsaharan African (%)
Ancestries Reported - Swedish (%)
Ancestries Reported - Swiss (%)
Ancestries Reported - Ukrainian (%)
Ancestries Reported - United States (%)
Ancestries Reported - Welsh (%)
Ancestries Reported - West Indian (%)
Ancestries Reported - Other (%)
Geographical mobility - Same house 1 year ago (%)
Geographical mobility - Same house 1 year ago (%) - White
Geographical mobility - Same house 1 year ago (%) - Black or African American
Geographical mobility - Same house 1 year ago (%) - Asian
Geographical mobility - Same house 1 year ago (%) - Hispanic or Latino
Geographical mobility - Same house 1 year ago (%) - American Indian and Alaska Native
Geographical mobility - Same house 1 year ago (%) - Multirace
Geographical mobility - Same house 1 year ago (%) - Other Race
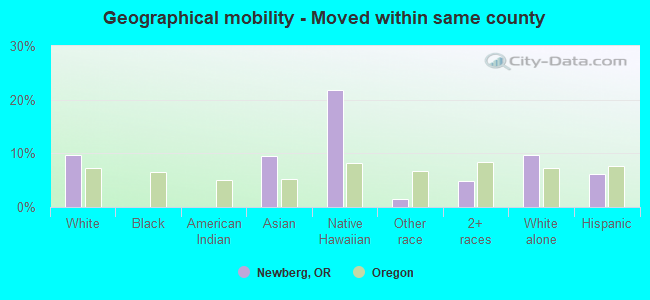
Geographical mobility - Moved within same county (%)
Geographical mobility - Moved within same county (%) - White
Geographical mobility - Moved within same county (%) - Black or African American
Geographical mobility - Moved within same county (%) - Asian
Geographical mobility - Moved within same county (%) - Hispanic or Latino
Geographical mobility - Moved within same county (%) - American Indian and Alaska Native
Geographical mobility - Moved within same county (%) - Multirace
Geographical mobility - Moved within same county (%) - Other Race
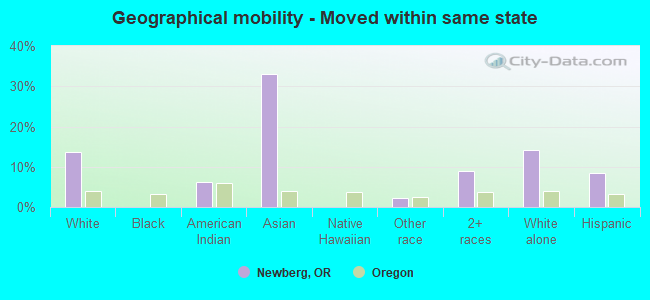
Geographical mobility - Moved from different county within same state (%)
Geographical mobility - Moved from different county within same state (%) - White
Geographical mobility - Moved from different county within same state (%) - Black or African American
Geographical mobility - Moved from different county within same state (%) - Asian
Geographical mobility - Moved from different county within same state (%) - Hispanic or Latino
Geographical mobility - Moved from different county within same state (%) - American Indian and Alaska Native
Geographical mobility - Moved from different county within same state (%) - Multirace
Geographical mobility - Moved from different county within same state (%) - Other Race
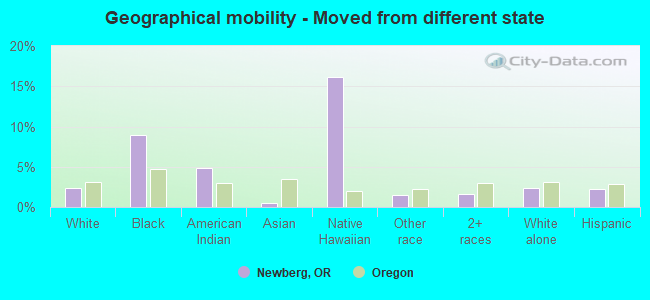
Geographical mobility - Moved from different state (%)
Geographical mobility - Moved from different state (%) - White
Geographical mobility - Moved from different state (%) - Black or African American
Geographical mobility - Moved from different state (%) - Asian
Geographical mobility - Moved from different state (%) - Hispanic or Latino
Geographical mobility - Moved from different state (%) - American Indian and Alaska Native
Geographical mobility - Moved from different state (%) - Multirace
Geographical mobility - Moved from different state (%) - Other Race
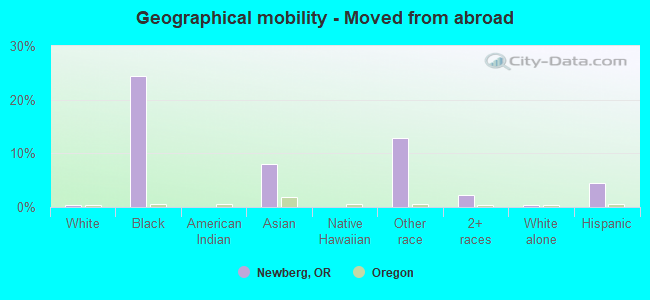
Geographical mobility - Moved from abroad (%)
Geographical mobility - Moved from abroad (%) - White
Geographical mobility - Moved from abroad (%) - Black or African American
Geographical mobility - Moved from abroad (%) - Asian
Geographical mobility - Moved from abroad (%) - Hispanic or Latino
Geographical mobility - Moved from abroad (%) - American Indian and Alaska Native
Geographical mobility - Moved from abroad (%) - Multirace
Geographical mobility - Moved from abroad (%) - Other Race
Place of birth for the foreign-born population - Ireland (%)
Place of birth for the foreign-born population - Denmark (%)
Place of birth for the foreign-born population - Norway (%)
Place of birth for the foreign-born population - Sweden (%)
Place of birth for the foreign-born population - United Kingdom (%)
Place of birth for the foreign-born population - England (%)
Place of birth for the foreign-born population - Scotland (%)
Place of birth for the foreign-born population - Other Northern Europe (%)
Place of birth for the foreign-born population - Austria (%)
Place of birth for the foreign-born population - Belgium (%)
Place of birth for the foreign-born population - France (%)
Place of birth for the foreign-born population - Germany (%)
Place of birth for the foreign-born population - Netherlands (%)
Place of birth for the foreign-born population - Switzerland (%)
Place of birth for the foreign-born population - Other Western Europe (%)
Place of birth for the foreign-born population - Greece (%)
Place of birth for the foreign-born population - Italy (%)
Place of birth for the foreign-born population - Portugal (%)
Place of birth for the foreign-born population - Spain (%)
Place of birth for the foreign-born population - Other Southern Europe (%)
Place of birth for the foreign-born population - Albania (%)
Place of birth for the foreign-born population - Belarus (%)
Place of birth for the foreign-born population - Bosnia and Herzegovina (%)
Place of birth for the foreign-born population - Bulgaria (%)
Place of birth for the foreign-born population - Croatia (%)
Place of birth for the foreign-born population - Czechoslovakia (%)
Place of birth for the foreign-born population - Hungary (%)
Place of birth for the foreign-born population - Latvia (%)
Place of birth for the foreign-born population - Lithuania (%)
Place of birth for the foreign-born population - North Macedonia (Macedonia) (%)
Place of birth for the foreign-born population - Moldova (%)
Place of birth for the foreign-born population - Poland (%)
Place of birth for the foreign-born population - Romania (%)
Place of birth for the foreign-born population - Russia (%)
Place of birth for the foreign-born population - Serbia (%)
Place of birth for the foreign-born population - Ukraine (%)
Place of birth for the foreign-born population - Other Eastern Europe (%)
Place of birth for the foreign-born population - China (%)
Place of birth for the foreign-born population - Hong Kong (%)
Place of birth for the foreign-born population - Taiwan (%)
Place of birth for the foreign-born population - Japan (%)
Place of birth for the foreign-born population - Korea (%)
Place of birth for the foreign-born population - Other Eastern Asia (%)
Place of birth for the foreign-born population - Afghanistan (%)
Place of birth for the foreign-born population - Bangladesh (%)
Place of birth for the foreign-born population - India (%)
Place of birth for the foreign-born population - Iran (%)
Place of birth for the foreign-born population - Kazakhstan (%)
Place of birth for the foreign-born population - Nepal (%)
Place of birth for the foreign-born population - Pakistan (%)
Place of birth for the foreign-born population - Sri Lanka (%)
Place of birth for the foreign-born population - Uzbekistan (%)
Place of birth for the foreign-born population - Other South Central Asia (%)
Place of birth for the foreign-born population - Burma (%)
Place of birth for the foreign-born population - Cambodia (%)
Place of birth for the foreign-born population - Indonesia (%)
Place of birth for the foreign-born population - Laos (%)
Place of birth for the foreign-born population - Malaysia (%)
Place of birth for the foreign-born population - Philippines (%)
Place of birth for the foreign-born population - Singapore (%)
Place of birth for the foreign-born population - Thailand (%)
Place of birth for the foreign-born population - Vietnam (%)
Place of birth for the foreign-born population - Other South Eastern Asia (%)
Place of birth for the foreign-born population - Armenia (%)
Place of birth for the foreign-born population - Iraq (%)
Place of birth for the foreign-born population - Israel (%)
Place of birth for the foreign-born population - Jordan (%)
Place of birth for the foreign-born population - Kuwait (%)
Place of birth for the foreign-born population - Lebanon (%)
Place of birth for the foreign-born population - Saudi Arabia (%)
Place of birth for the foreign-born population - Syria (%)
Place of birth for the foreign-born population - Turkey (%)
Place of birth for the foreign-born population - Yemen (%)
Place of birth for the foreign-born population - Other Western Asia (%)
Place of birth for the foreign-born population - Eritrea (%)
Place of birth for the foreign-born population - Ethiopia (%)
Place of birth for the foreign-born population - Kenya (%)
Place of birth for the foreign-born population - Somalia (%)
Place of birth for the foreign-born population - Uganda (%)
Place of birth for the foreign-born population - Zimbabwe (%)
Place of birth for the foreign-born population - Other Eastern Africa (%)
Place of birth for the foreign-born population - Cameroon (%)
Place of birth for the foreign-born population - Congo (%)
Place of birth for the foreign-born population - Democratic Republic of Congo (Zaire) (%)
Place of birth for the foreign-born population - Other Middle Africa (%)
Place of birth for the foreign-born population - Egypt (%)
Place of birth for the foreign-born population - Morocco (%)
Place of birth for the foreign-born population - Sudan (%)
Place of birth for the foreign-born population - Other Northern Africa (%)
Place of birth for the foreign-born population - South Africa (%)
Place of birth for the foreign-born population - Other Southern Africa (%)
Place of birth for the foreign-born population - Cabo Verde (%)
Place of birth for the foreign-born population - Ghana (%)
Place of birth for the foreign-born population - Liberia (%)
Place of birth for the foreign-born population - Nigeria (%)
Place of birth for the foreign-born population - Senegal (%)
Place of birth for the foreign-born population - Sierra Leone (%)
Place of birth for the foreign-born population - Other Western Africa (%)
Place of birth for the foreign-born population - Australia (%)
Place of birth for the foreign-born population - New Zealand (%)
Place of birth for the foreign-born population - Fiji (%)
Place of birth for the foreign-born population - Micronesia (%)
Place of birth for the foreign-born population - Bahamas (%)
Place of birth for the foreign-born population - Barbados (%)
Place of birth for the foreign-born population - Cuba (%)
Place of birth for the foreign-born population - Dominica (%)
Place of birth for the foreign-born population - Dominican Republic (%)
Place of birth for the foreign-born population - Grenada (%)
Place of birth for the foreign-born population - Haiti (%)
Place of birth for the foreign-born population - Jamaica (%)
Place of birth for the foreign-born population - St. Vincent and the Grenadines (%)
Place of birth for the foreign-born population - Trinidad and Tobago (%)
Place of birth for the foreign-born population - West Indies (%)
Place of birth for the foreign-born population - Other Caribbean (%)
Place of birth for the foreign-born population - Belize (%)
Place of birth for the foreign-born population - Costa Rica (%)
Place of birth for the foreign-born population - El Salvador (%)
Place of birth for the foreign-born population - Guatemala (%)
Place of birth for the foreign-born population - Honduras (%)
Place of birth for the foreign-born population - Mexico (%)
Place of birth for the foreign-born population - Nicaragua (%)
Place of birth for the foreign-born population - Panama (%)
Place of birth for the foreign-born population - Other Central America (%)
Place of birth for the foreign-born population - Argentina (%)
Place of birth for the foreign-born population - Bolivia (%)
Place of birth for the foreign-born population - Brazil (%)
Place of birth for the foreign-born population - Chile (%)
Place of birth for the foreign-born population - Colombia (%)
Place of birth for the foreign-born population - Ecuador (%)
Place of birth for the foreign-born population - Guyana (%)
Place of birth for the foreign-born population - Peru (%)
Place of birth for the foreign-born population - Uruguay (%)
Place of birth for the foreign-born population - Venezuela (%)
Place of birth for the foreign-born population - Other South America (%)
Place of birth for the foreign-born population - Canada (%)
Place of birth for the foreign-born population - Other Northern America (%)
Place of birth for the foreign-born population - Other (%)
Latest news about races in Newberg, OR collected exclusively by city-data.com from local newspapers, TV, and radio stations
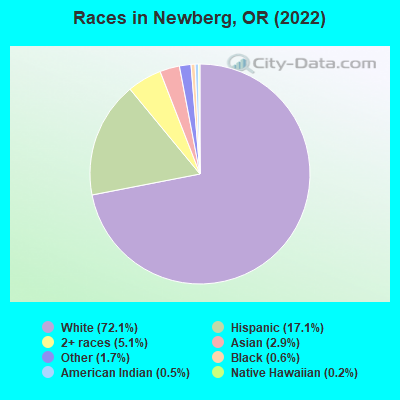
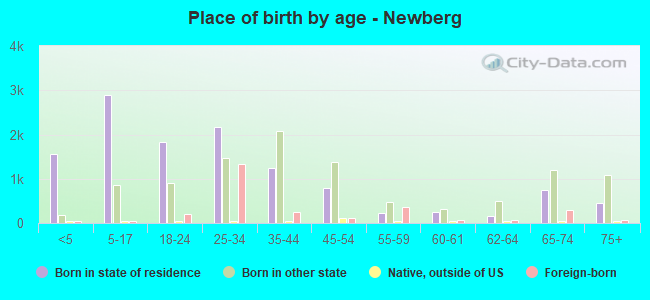
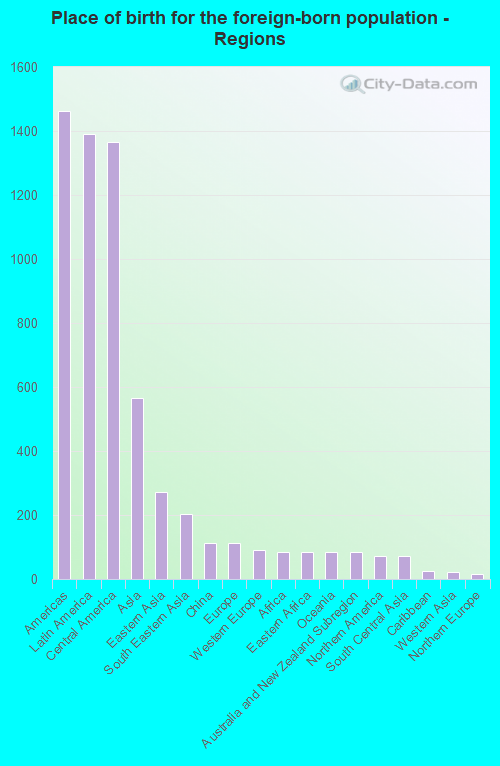
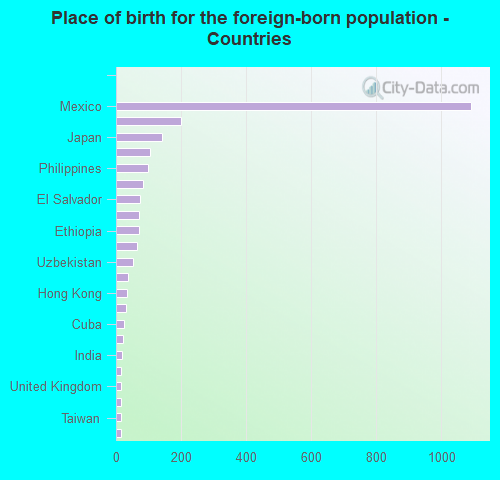
According to 2022 data, the most numerous races in Newberg, OR are White alone (18,385 residents), Hispanic (4,366 residents), and Two or more races (1,302 residents). 86.4% of Newberg residents speak English at home. 9.1% of Newberg, OR residents are foreign-born (5.4% born in Latin America, 2.2% born in Asia), which is about the same as the foreign-born rate of 9.0% across the entire state of Oregon.
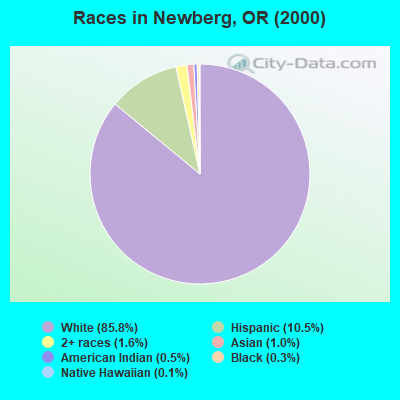
Race distribution in Newberg
2000 2022
2,857,616 83.5% White alone 275,314 8.0% Hispanic 100,333 2.9% Asian alone 82,733 2.4% Two or more races 53,325 1.6% Black alone 40,130 1.2% American Indian alone 7,398 0.2% Native Hawaiian and Other 4,550 0.1% Other race alone
3,037,571 71.6% White alone 609,538 14.4% Hispanic 252,744 6.0% Two or more races 191,283 4.5% Asian alone 78,228 1.8% Black alone 29,399 0.7% American Indian alone 25,731 0.6% Other race alone 15,643 0.4% Native Hawaiian and Other
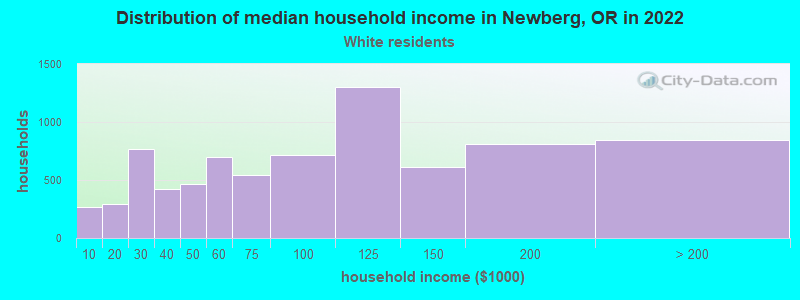
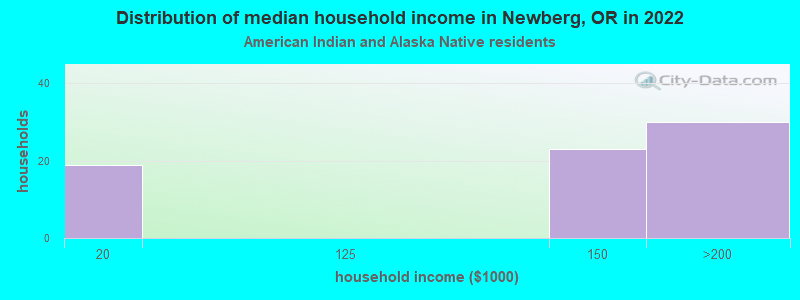
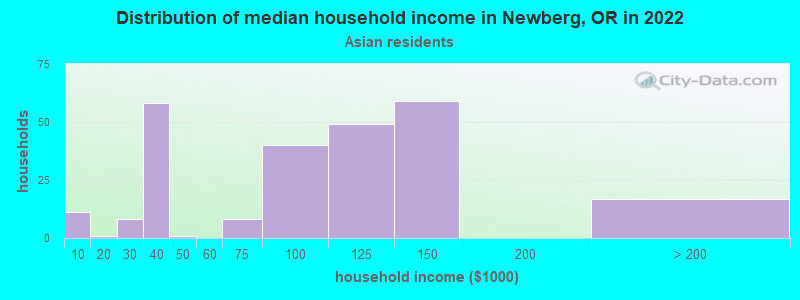
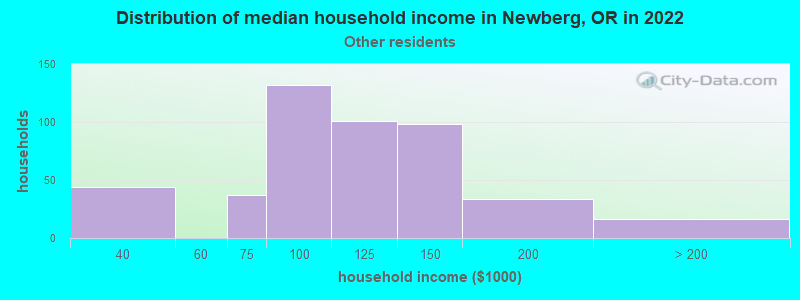
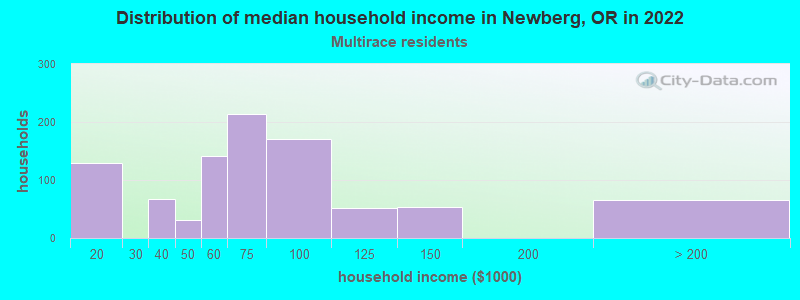
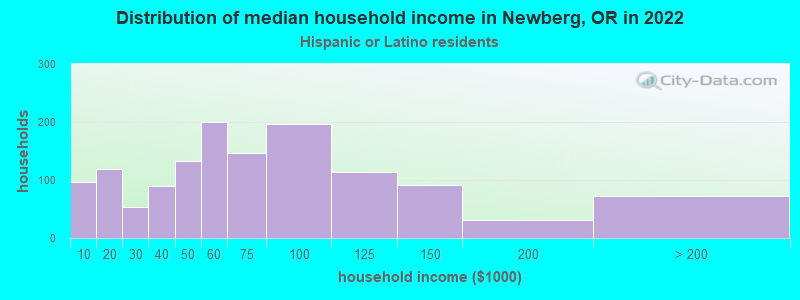
Income and house value in Newberg Median household income in 2022 $87,378 White non-Hispanic householders$94,071 American Indian and Alaska Native householders$94,938 Asian householders$93,875 Some other race householders$65,598 Two or more races householders$48,400 Hispanic or Latino race householdersMedian 2022 house value $525,090 White Non-Hispanic householders$511,693 American Indian or Alaska Native householders $511,693 Asian householdersover $1,000,000 Some other race householders$604,729 Two or more races householders$607,706 Hispanic or Latino householders
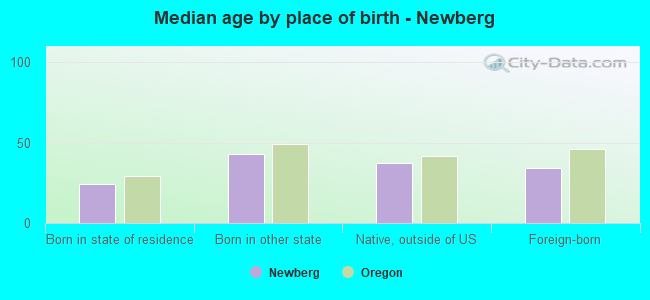
Median age by race in Newberg
36.1 Median age for White residents35.6 38.1 28.7 Median age for Black or African American residents59.0 27.6 34.3 Median age for American Indian / Alaska Native residents27.7 46.4 28.5 Median age for Asian residents30.4 42.6 21.4 Median age for Native Hawaiian / Pacific Islander residents21.4 -774,891,774.1 59.6 Median age for Other race residents53.3 68.0 21.6 Median age for Two or more races residents22.8 19.4 37.2 Median age for White alone residents36.0 37.3 28.4 Median age for Hispanic or Latino residents28.0 29.2
Owner/renter occupied households by race in Newberg
House owners and renters - White residents 4,842 62.1% Owner occupied2,953 37.9% Renter occupiedHouse owners and renters - Black or African American residents 14 100.0% Owner occupiedHouse owners and renters - American Indian / Alaska Native residents 37 44.3% Owner occupied46 55.7% Renter occupiedHouse owners and renters - Asian residents 118 49.0% Owner occupied123 51.0% Renter occupiedHouse owners and renters - Other race residents 139 52.8% Owner occupied124 47.2% Renter occupiedHouse owners and renters - Two or more races residents 372 44.8% Owner occupied459 55.2% Renter occupiedHouse owners and renters - White alone residents 4,745 63.9% Owner occupied2,683 36.1% Renter occupiedHouse owners and renters - Hispanic or Latino residents 349 29.8% Owner occupied823 70.2% Renter occupied
Language usage in Newberg
English speakers - Total 86.4% of residents of Newberg speak English at home.
10.1% of residents speak Spanish at home 1,285 53.9% Speak English very well1,100 46.1% Speak English less than very well3.9% of residents speak other language at home 658 70.3% Speak English very well278 29.7% Speak English less than very well
English speakers - Born in the United States 94.2% of residents of Newberg speak English at home.
3.3% of residents speak Spanish at home 322 93.3% Speak English very well23 6.7% Speak English less than very well2.7% of residents speak other language at home 239 84.5% Speak English very well44 15.5% Speak English less than very well
All residents speak only English at home
English speakers - Foreign-born 20.2% of residents of Newberg speak English at home.
62.9% of residents speak Spanish at home 373 23.9% Speak English very well1,189 76.1% Speak English less than very well13.2% of residents speak other language at home 231 70.6% Speak English very well96 29.4% Speak English less than very well
White (Caucasian) - Speak only English Native:
96.9% (17,077)Foreign-born:
44.1% (171)
White (Caucasian) - Speak another language Native:
3.1% (549)Foreign-born:
54.0% (210)
Asian - Speak only English Native:
68.9% (111)Foreign-born:
35.4% (154)
Asian - Speak another language Native:
31.4% (51)Foreign-born:
65.7% (286)
Other race - Speak only English Native:
100.0% (569)Foreign-born:
18.1% (68)
Other race - Speak another language Native:
20.0% (114)Foreign-born:
81.3% (308)
Two or more races - Speak only English Native:
73.0% (1,836)Foreign-born:
3.1% (35)
Two or more races - Speak another language Native:
27.5% (691)Foreign-born:
94.9% (1,062)
White alone - Speak only English Native:
97.3% (16,692)Foreign-born:
70.3% (185)
White alone - Speak another language Native:
2.7% (469)Foreign-born:
29.0% (76)
Hispanic or Latino - Speak only English Native:
64.1% (1,329)Foreign-born:
5.1% (85)
Hispanic or Latino - Speak another language Native:
36.2% (752)Foreign-born:
95.1% (1,576)
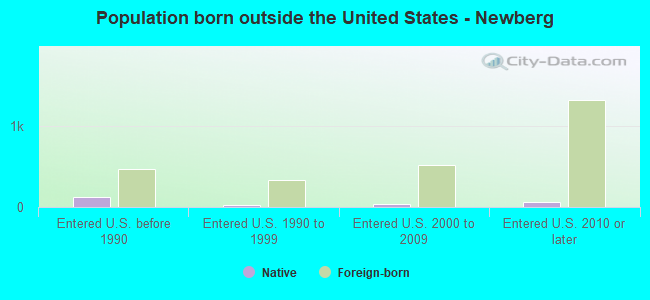
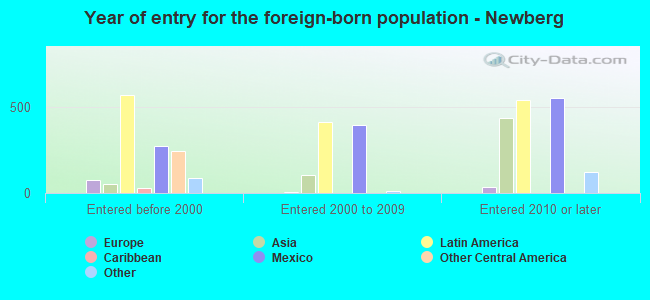
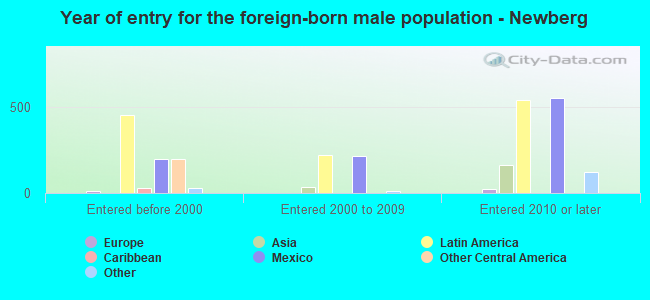
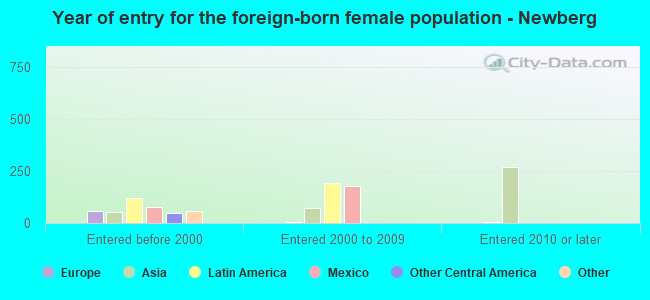
Foreign-born residents in Newberg 2,312 residents are foreign born (5.4% Latin America , 2.2% Asia ).
This city:
9.1%Oregon:
9.8%
Marital status for residents in Newberg Marital status - White (Caucasian) population 15 years and over
Males 32.1% Never married56.9% Now married0.6% Separated2.0% Widowed8.4% DivorcedFemales 32.3% Never married49.1% Now married2.7% Separated5.6% Widowed10.3% DivorcedWomen who gave birth in the past 12 months Now married:
77.9% (204)Unmarried:
22.1% (58)
Women who did not give birth in the past 12 months Now married:
48.6% (2,488)Unmarried:
51.4% (2,635)
Marital status - Black or African American population 15 years and over
Males 39.5% Never married60.5% Now married0.0% Separated0.0% Widowed0.0% DivorcedFemales 100.0% Never married0.0% Now married0.0% Separated0.0% Widowed0.0% DivorcedWomen who did not give birth in the past 12 months Now married:
0.0% (0)Unmarried:
100.0% (115)
Marital status - American Indian / Alaska Native population 15 years and over
Males 70.6% Never married12.9% Now married0.0% Separated0.0% Widowed16.6% DivorcedFemales 39.4% Never married43.9% Now married0.0% Separated0.0% Widowed16.7% DivorcedWomen who did not give birth in the past 12 months Now married:
40.3% (27)Unmarried:
59.7% (40)
Marital status - Asian population 15 years and over
Males 75.6% Never married16.3% Now married0.0% Separated0.0% Widowed8.1% DivorcedFemales 46.8% Never married45.4% Now married0.0% Separated5.8% Widowed1.9% DivorcedWomen who gave birth in the past 12 months Now married:
0.0% (0)Unmarried:
100.0% (20)
Women who did not give birth in the past 12 months Now married:
32.4% (73)Unmarried:
67.6% (152)
Marital status - Other race population 15 years and over
Males 17.0% Never married83.0% Now married0.0% Separated0.0% Widowed0.0% DivorcedFemales 18.9% Never married67.6% Now married0.0% Separated7.5% Widowed6.1% DivorcedWomen who did not give birth in the past 12 months Now married:
40.9% (77)Unmarried:
59.1% (111)
Marital status - Two or more races population 15 years and over
Males 52.7% Never married24.3% Now married8.2% Separated0.0% Widowed14.8% DivorcedFemales 53.3% Never married28.1% Now married0.0% Separated0.1% Widowed18.4% DivorcedWomen who did not give birth in the past 12 months Now married:
24.9% (199)Unmarried:
75.1% (601)
Marital status - White alone, not Hispanic / Latino population 15 years and over
Males 31.7% Never married57.1% Now married0.3% Separated1.8% Widowed9.0% DivorcedFemales 32.4% Never married48.1% Now married2.8% Separated5.8% Widowed10.9% DivorcedWomen who gave birth in the past 12 months Now married:
80.7% (186)Unmarried:
19.3% (45)
Women who did not give birth in the past 12 months Now married:
47.2% (2,374)Unmarried:
52.8% (2,652)
Marital status - Hispanic or Latino population 15 years and over
Males 44.0% Never married38.1% Now married7.3% Separated1.1% Widowed9.6% DivorcedFemales 36.9% Never married52.1% Now married0.0% Separated4.4% Widowed6.6% DivorcedWomen who gave birth in the past 12 months Now married:
63.8% (31)Unmarried:
36.2% (18)
Women who did not give birth in the past 12 months Now married:
45.8% (391)Unmarried:
54.2% (463)
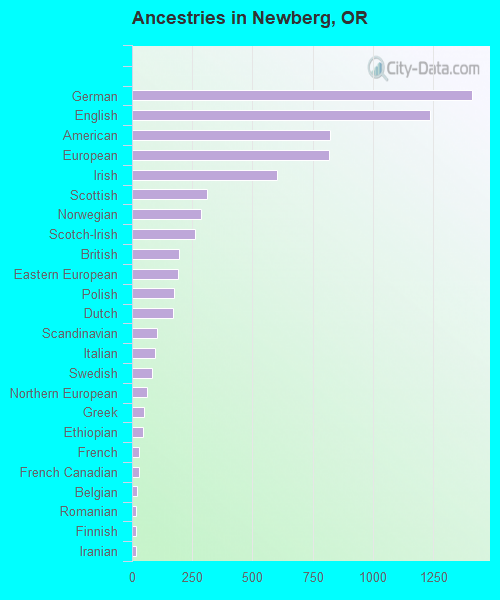
Ancestries in Newberg
1,411 12.3% German1,235 10.8% English823 7.2% American818 7.1% European602 5.3% Irish312 2.7% Scottish287 2.5% Norwegian263 2.3% Scotch-Irish194 1.7% British190 1.7% Eastern European175 1.5% Polish169 1.5% Dutch104 0.9% Scandinavian95 0.8% Italian83 0.7% Swedish62 0.5% Northern European50 0.4% Greek46 0.4% Ethiopian30 0.3% French28 0.2% French Canadian20 0.2% Belgian18 0.2% Romanian17 0.1% Finnish17 0.1% Iranian12 0.1% Arab12 0.1% Russian9 0.08% Danish9 0.08% Slavic9 0.08% Ukrainian5 0.04% Czech4 0.03% Lithuanian2 0.02% Swiss
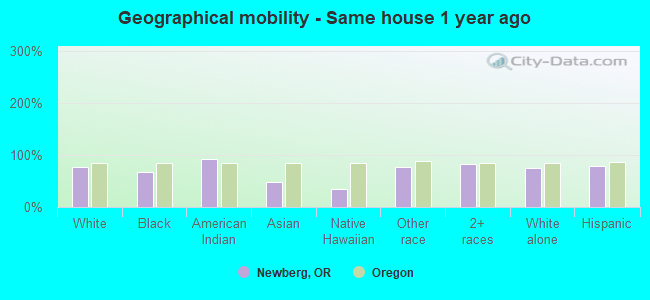
Geographical mobility in Newberg Same house 1 year ago 14,618 76.3% White (Caucasian)138 67.9% Black or African American235 92.9% American Indian / Alaska Native314 49.0% Asian11 35.0% Native Hawaiian / Pacific Islander1,017 77.4% Other race3,052 82.0% Two or more races13,753 75.8% White alone, not Hispanic / Latino3,360 78.2% Hispanic or LatinoMoved within same county 1,856 9.7% White / Caucasian62 9.6% Asian7 21.9% Native Hawaiian / Pacific Islander20 1.5% Other race183 4.9% Two or more races1,757 9.7% White alone, not Hispanic / Latino264 6.1% Hispanic or LatinoMoved within same state 2,613 13.6% White / Caucasian16 6.3% American Indian / Alaska Native211 32.9% Asian28 2.2% Other race331 8.9% Two or more races2,574 14.2% White alone, not Hispanic / Latino367 8.6% Hispanic or LatinoMoved from different state 444 2.3% White / Caucasian18 8.9% Black or African American12 4.8% American Indian / Alaska Native3 0.5% Asian5 16.2% Native Hawaiian / Pacific Islander20 1.5% Other race62 1.7% Two or more races438 2.4% White alone, not Hispanic / Latino98 2.3% Hispanic or LatinoMoved from abroad 60 0.3% White50 24.4% Black or African American52 8.0% Asian168 12.8% Other race81 2.2% Two or more races64 0.4% White alone, not Hispanic / Latino191 4.4% Hispanic or Latino
Children Nativity (place of birth) in Newberg
Children under 6 years - Living with two parents Both parents native 1,270 100.0% NativeBoth parents foreign-born 247 100.0% NativeOne native, one foreign-born parent 39 100.0% NativeChildren under 6 years - Living with one parent Native parent 382 100.0% NativeForeign-born parent 26 100.0% NativeChildren 6 to 17 years - Living with two parents Both parents native 1,969 99.6% Native7 0.4% Foreign-bornOne native, one foreign-born parent 209 100.0% NativeChildren 6 to 17 years - Living with one parent Native parent 1,133 100.0% NativeForeign-born parent 64 50.1% Native64 49.9% Foreign-born
Grandparents responsible for own grandchildren in Newberg
Grandparents (30 to 59 years) White / Caucasian 51 50.4% Responsible for grandchildren50 49.6% Not responsible for grandchildrenWhite alone, not Hispanic / Latino 53 47.9% Responsible for grandchildren58 52.1% Not responsible for grandchildrenGrandparents (60 years and over) White / Caucasian 28 22.4% Responsible for grandchildren97 77.6% Not responsible for grandchildrenWhite alone, not Hispanic / Latino 18 15.1% Responsible for grandchildren102 84.9% Not responsible for grandchildren