Races in Newberry, South Carolina (SC) Detailed Stats
Data:
Races - White alone (%)
Races - White alone (% change since 2000)
Races - Black alone (%)
Races - Black alone (% change since 2000)
Races - American Indian alone (%)
Races - American Indian alone (% change since 2000)
Races - Asian alone (%)
Races - Asian alone (% change since 2000)
Races - Hispanic (%)
Races - Hispanic (% change since 2000)
Races - Native Hawaiian and Other Pacific Islander alone (%)
Races - Native Hawaiian and Other Pacific Islander alone (% change since 2000)
Races - Two or more races(%)
Races - Two or more races(% change since 2000)
Races - Other race alone (%)
Races - Other race alone (% change since 2000)
Racial diversity
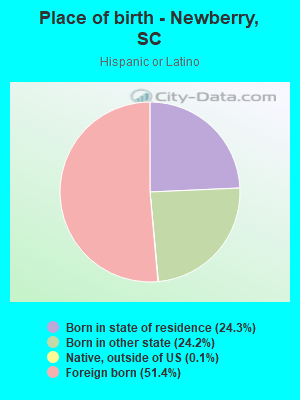
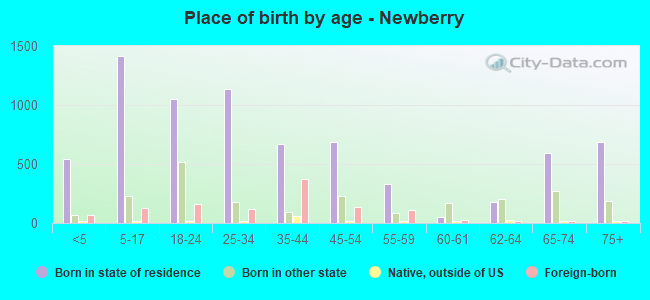
Place of birth - Born in state of residence (%)
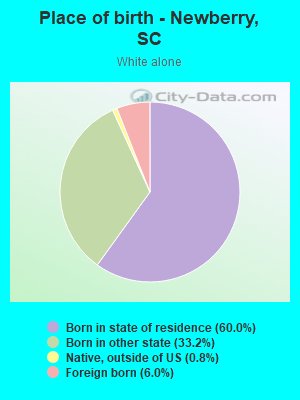
Place of birth - Born in state of residence (%) - White
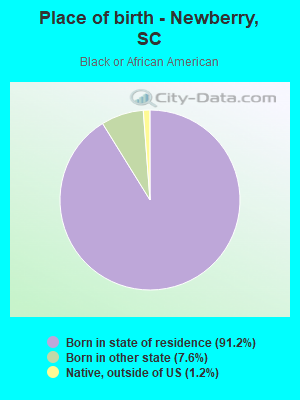
Place of birth - Born in state of residence (%) - Black or African American
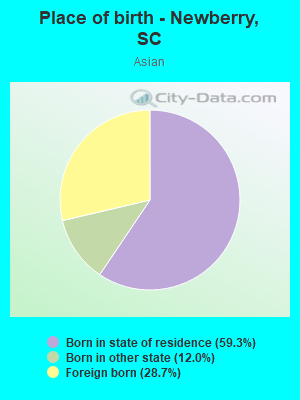
Place of birth - Born in state of residence (%) - Asian
Place of birth - Born in state of residence (%) - Hispanic or Latino
Place of birth - Born in state of residence (%) - American Indian and Alaska Native
Place of birth - Born in state of residence (%) - Multirace
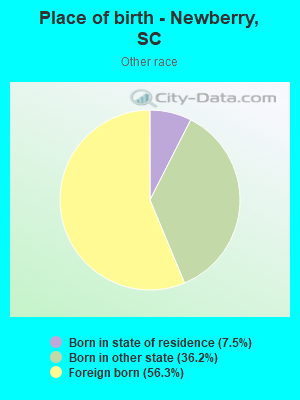
Place of birth - Born in state of residence (%) - Other Race
Place of birth - Born in other state (%)
Place of birth - Born in other state (%) - White
Place of birth - Born in other state (%) - Black or African American
Place of birth - Born in other state (%) - Asian
Place of birth - Born in other state (%) - Hispanic or Latino
Place of birth - Born in other state (%) - American Indian and Alaska Native
Place of birth - Born in other state (%) - Multirace
Place of birth - Born in other state (%) - Other Race
Place of birth - Native, outside of US (%)
Place of birth - Native, outside of US (%) - White
Place of birth - Native, outside of US (%) - Black or African American
Place of birth - Native, outside of US (%) - Asian
Place of birth - Native, outside of US (%) - Hispanic or Latino
Place of birth - Native, outside of US (%) - American Indian and Alaska Native
Place of birth - Native, outside of US (%) - Multirace
Place of birth - Native, outside of US (%) - Other Race
Place of birth - Foreign born (%)
Place of birth - Foreign born (%) - White
Place of birth - Foreign born (%) - Black or African American
Place of birth - Foreign born (%) - Asian
Place of birth - Foreign born (%) - Hispanic or Latino
Place of birth - Foreign born (%) - American Indian and Alaska Native
Place of birth - Foreign born (%) - Multirace
Place of birth - Foreign born (%) - Other Race
Residents speaking English at home (%)
Residents speaking English at home - Born in the United States (%)
Residents speaking English at home - Native, born elsewhere (%)
Residents speaking English at home - Foreign born (%)
Residents speaking Spanish at home (%)
Residents speaking Spanish at home - Born in the United States (%)
Residents speaking Spanish at home - Native, born elsewhere (%)
Residents speaking Spanish at home - Foreign born (%)
Residents speaking other language at home (%)
Residents speaking other language at home - Born in the United States (%)
Residents speaking other language at home - Native, born elsewhere (%)
Residents speaking other language at home - Foreign born (%)
Marital status - Never married (%)
Marital status - Now married (%)
Marital status - Separated (%)
Marital status - Widowed (%)
Marital status - Divorced (%)
Ancestries Reported - Arab (%)
Ancestries Reported - Czech (%)
Ancestries Reported - Danish (%)
Ancestries Reported - Dutch (%)
Ancestries Reported - English (%)
Ancestries Reported - French (%)
Ancestries Reported - French Canadian (%)
Ancestries Reported - German (%)
Ancestries Reported - Greek (%)
Ancestries Reported - Hungarian (%)
Ancestries Reported - Irish (%)
Ancestries Reported - Italian (%)
Ancestries Reported - Lithuanian (%)
Ancestries Reported - Norwegian (%)
Ancestries Reported - Polish (%)
Ancestries Reported - Portuguese (%)
Ancestries Reported - Russian (%)
Ancestries Reported - Scotch-Irish (%)
Ancestries Reported - Scottish (%)
Ancestries Reported - Slovak (%)
Ancestries Reported - Subsaharan African (%)
Ancestries Reported - Swedish (%)
Ancestries Reported - Swiss (%)
Ancestries Reported - Ukrainian (%)
Ancestries Reported - United States (%)
Ancestries Reported - Welsh (%)
Ancestries Reported - West Indian (%)
Ancestries Reported - Other (%)
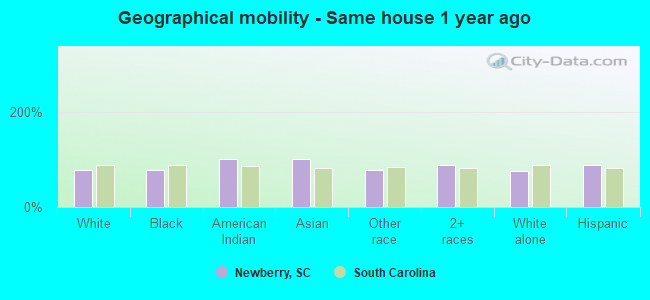
Geographical mobility - Same house 1 year ago (%)
Geographical mobility - Same house 1 year ago (%) - White
Geographical mobility - Same house 1 year ago (%) - Black or African American
Geographical mobility - Same house 1 year ago (%) - Asian
Geographical mobility - Same house 1 year ago (%) - Hispanic or Latino
Geographical mobility - Same house 1 year ago (%) - American Indian and Alaska Native
Geographical mobility - Same house 1 year ago (%) - Multirace
Geographical mobility - Same house 1 year ago (%) - Other Race
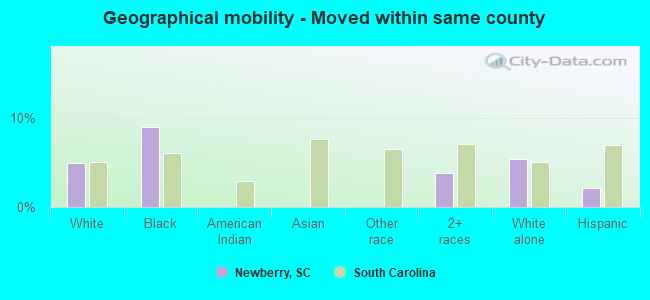
Geographical mobility - Moved within same county (%)
Geographical mobility - Moved within same county (%) - White
Geographical mobility - Moved within same county (%) - Black or African American
Geographical mobility - Moved within same county (%) - Asian
Geographical mobility - Moved within same county (%) - Hispanic or Latino
Geographical mobility - Moved within same county (%) - American Indian and Alaska Native
Geographical mobility - Moved within same county (%) - Multirace
Geographical mobility - Moved within same county (%) - Other Race
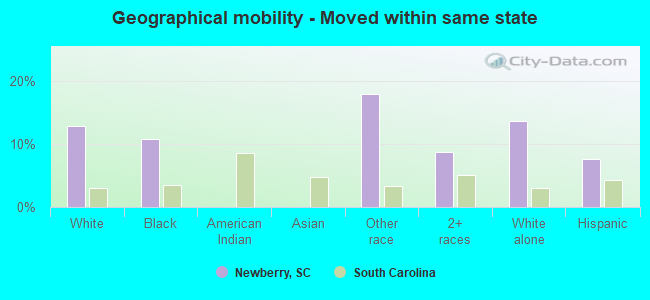
Geographical mobility - Moved from different county within same state (%)
Geographical mobility - Moved from different county within same state (%) - White
Geographical mobility - Moved from different county within same state (%) - Black or African American
Geographical mobility - Moved from different county within same state (%) - Asian
Geographical mobility - Moved from different county within same state (%) - Hispanic or Latino
Geographical mobility - Moved from different county within same state (%) - American Indian and Alaska Native
Geographical mobility - Moved from different county within same state (%) - Multirace
Geographical mobility - Moved from different county within same state (%) - Other Race
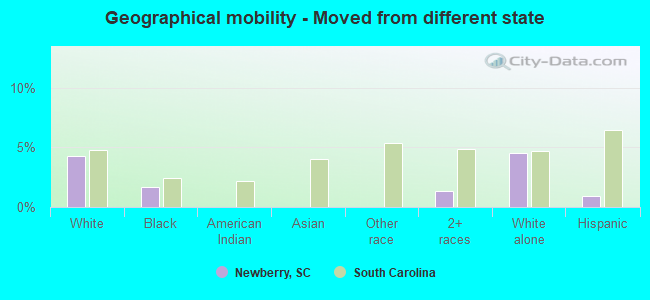
Geographical mobility - Moved from different state (%)
Geographical mobility - Moved from different state (%) - White
Geographical mobility - Moved from different state (%) - Black or African American
Geographical mobility - Moved from different state (%) - Asian
Geographical mobility - Moved from different state (%) - Hispanic or Latino
Geographical mobility - Moved from different state (%) - American Indian and Alaska Native
Geographical mobility - Moved from different state (%) - Multirace
Geographical mobility - Moved from different state (%) - Other Race
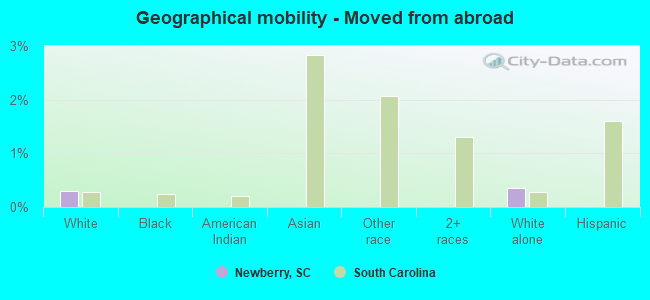
Geographical mobility - Moved from abroad (%)
Geographical mobility - Moved from abroad (%) - White
Geographical mobility - Moved from abroad (%) - Black or African American
Geographical mobility - Moved from abroad (%) - Asian
Geographical mobility - Moved from abroad (%) - Hispanic or Latino
Geographical mobility - Moved from abroad (%) - American Indian and Alaska Native
Geographical mobility - Moved from abroad (%) - Multirace
Geographical mobility - Moved from abroad (%) - Other Race
Place of birth for the foreign-born population - Ireland (%)
Place of birth for the foreign-born population - Denmark (%)
Place of birth for the foreign-born population - Norway (%)
Place of birth for the foreign-born population - Sweden (%)
Place of birth for the foreign-born population - United Kingdom (%)
Place of birth for the foreign-born population - England (%)
Place of birth for the foreign-born population - Scotland (%)
Place of birth for the foreign-born population - Other Northern Europe (%)
Place of birth for the foreign-born population - Austria (%)
Place of birth for the foreign-born population - Belgium (%)
Place of birth for the foreign-born population - France (%)
Place of birth for the foreign-born population - Germany (%)
Place of birth for the foreign-born population - Netherlands (%)
Place of birth for the foreign-born population - Switzerland (%)
Place of birth for the foreign-born population - Other Western Europe (%)
Place of birth for the foreign-born population - Greece (%)
Place of birth for the foreign-born population - Italy (%)
Place of birth for the foreign-born population - Portugal (%)
Place of birth for the foreign-born population - Spain (%)
Place of birth for the foreign-born population - Other Southern Europe (%)
Place of birth for the foreign-born population - Albania (%)
Place of birth for the foreign-born population - Belarus (%)
Place of birth for the foreign-born population - Bosnia and Herzegovina (%)
Place of birth for the foreign-born population - Bulgaria (%)
Place of birth for the foreign-born population - Croatia (%)
Place of birth for the foreign-born population - Czechoslovakia (%)
Place of birth for the foreign-born population - Hungary (%)
Place of birth for the foreign-born population - Latvia (%)
Place of birth for the foreign-born population - Lithuania (%)
Place of birth for the foreign-born population - North Macedonia (Macedonia) (%)
Place of birth for the foreign-born population - Moldova (%)
Place of birth for the foreign-born population - Poland (%)
Place of birth for the foreign-born population - Romania (%)
Place of birth for the foreign-born population - Russia (%)
Place of birth for the foreign-born population - Serbia (%)
Place of birth for the foreign-born population - Ukraine (%)
Place of birth for the foreign-born population - Other Eastern Europe (%)
Place of birth for the foreign-born population - China (%)
Place of birth for the foreign-born population - Hong Kong (%)
Place of birth for the foreign-born population - Taiwan (%)
Place of birth for the foreign-born population - Japan (%)
Place of birth for the foreign-born population - Korea (%)
Place of birth for the foreign-born population - Other Eastern Asia (%)
Place of birth for the foreign-born population - Afghanistan (%)
Place of birth for the foreign-born population - Bangladesh (%)
Place of birth for the foreign-born population - India (%)
Place of birth for the foreign-born population - Iran (%)
Place of birth for the foreign-born population - Kazakhstan (%)
Place of birth for the foreign-born population - Nepal (%)
Place of birth for the foreign-born population - Pakistan (%)
Place of birth for the foreign-born population - Sri Lanka (%)
Place of birth for the foreign-born population - Uzbekistan (%)
Place of birth for the foreign-born population - Other South Central Asia (%)
Place of birth for the foreign-born population - Burma (%)
Place of birth for the foreign-born population - Cambodia (%)
Place of birth for the foreign-born population - Indonesia (%)
Place of birth for the foreign-born population - Laos (%)
Place of birth for the foreign-born population - Malaysia (%)
Place of birth for the foreign-born population - Philippines (%)
Place of birth for the foreign-born population - Singapore (%)
Place of birth for the foreign-born population - Thailand (%)
Place of birth for the foreign-born population - Vietnam (%)
Place of birth for the foreign-born population - Other South Eastern Asia (%)
Place of birth for the foreign-born population - Armenia (%)
Place of birth for the foreign-born population - Iraq (%)
Place of birth for the foreign-born population - Israel (%)
Place of birth for the foreign-born population - Jordan (%)
Place of birth for the foreign-born population - Kuwait (%)
Place of birth for the foreign-born population - Lebanon (%)
Place of birth for the foreign-born population - Saudi Arabia (%)
Place of birth for the foreign-born population - Syria (%)
Place of birth for the foreign-born population - Turkey (%)
Place of birth for the foreign-born population - Yemen (%)
Place of birth for the foreign-born population - Other Western Asia (%)
Place of birth for the foreign-born population - Eritrea (%)
Place of birth for the foreign-born population - Ethiopia (%)
Place of birth for the foreign-born population - Kenya (%)
Place of birth for the foreign-born population - Somalia (%)
Place of birth for the foreign-born population - Uganda (%)
Place of birth for the foreign-born population - Zimbabwe (%)
Place of birth for the foreign-born population - Other Eastern Africa (%)
Place of birth for the foreign-born population - Cameroon (%)
Place of birth for the foreign-born population - Congo (%)
Place of birth for the foreign-born population - Democratic Republic of Congo (Zaire) (%)
Place of birth for the foreign-born population - Other Middle Africa (%)
Place of birth for the foreign-born population - Egypt (%)
Place of birth for the foreign-born population - Morocco (%)
Place of birth for the foreign-born population - Sudan (%)
Place of birth for the foreign-born population - Other Northern Africa (%)
Place of birth for the foreign-born population - South Africa (%)
Place of birth for the foreign-born population - Other Southern Africa (%)
Place of birth for the foreign-born population - Cabo Verde (%)
Place of birth for the foreign-born population - Ghana (%)
Place of birth for the foreign-born population - Liberia (%)
Place of birth for the foreign-born population - Nigeria (%)
Place of birth for the foreign-born population - Senegal (%)
Place of birth for the foreign-born population - Sierra Leone (%)
Place of birth for the foreign-born population - Other Western Africa (%)
Place of birth for the foreign-born population - Australia (%)
Place of birth for the foreign-born population - New Zealand (%)
Place of birth for the foreign-born population - Fiji (%)
Place of birth for the foreign-born population - Micronesia (%)
Place of birth for the foreign-born population - Bahamas (%)
Place of birth for the foreign-born population - Barbados (%)
Place of birth for the foreign-born population - Cuba (%)
Place of birth for the foreign-born population - Dominica (%)
Place of birth for the foreign-born population - Dominican Republic (%)
Place of birth for the foreign-born population - Grenada (%)
Place of birth for the foreign-born population - Haiti (%)
Place of birth for the foreign-born population - Jamaica (%)
Place of birth for the foreign-born population - St. Vincent and the Grenadines (%)
Place of birth for the foreign-born population - Trinidad and Tobago (%)
Place of birth for the foreign-born population - West Indies (%)
Place of birth for the foreign-born population - Other Caribbean (%)
Place of birth for the foreign-born population - Belize (%)
Place of birth for the foreign-born population - Costa Rica (%)
Place of birth for the foreign-born population - El Salvador (%)
Place of birth for the foreign-born population - Guatemala (%)
Place of birth for the foreign-born population - Honduras (%)
Place of birth for the foreign-born population - Mexico (%)
Place of birth for the foreign-born population - Nicaragua (%)
Place of birth for the foreign-born population - Panama (%)
Place of birth for the foreign-born population - Other Central America (%)
Place of birth for the foreign-born population - Argentina (%)
Place of birth for the foreign-born population - Bolivia (%)
Place of birth for the foreign-born population - Brazil (%)
Place of birth for the foreign-born population - Chile (%)
Place of birth for the foreign-born population - Colombia (%)
Place of birth for the foreign-born population - Ecuador (%)
Place of birth for the foreign-born population - Guyana (%)
Place of birth for the foreign-born population - Peru (%)
Place of birth for the foreign-born population - Uruguay (%)
Place of birth for the foreign-born population - Venezuela (%)
Place of birth for the foreign-born population - Other South America (%)
Place of birth for the foreign-born population - Canada (%)
Place of birth for the foreign-born population - Other Northern America (%)
Place of birth for the foreign-born population - Other (%)
Latest news about races in Newberry, SC collected exclusively by city-data.com from local newspapers, TV, and radio stations
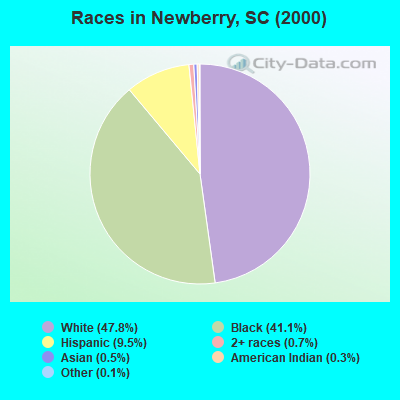
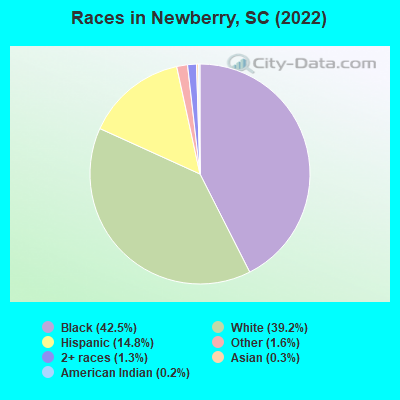
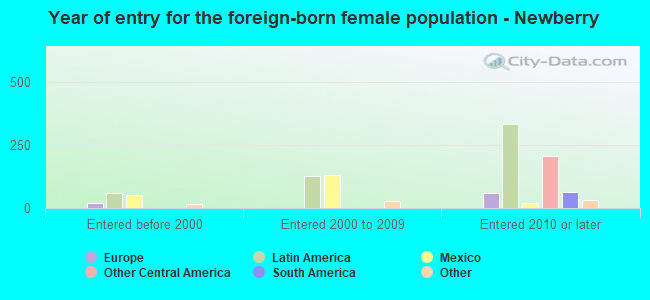
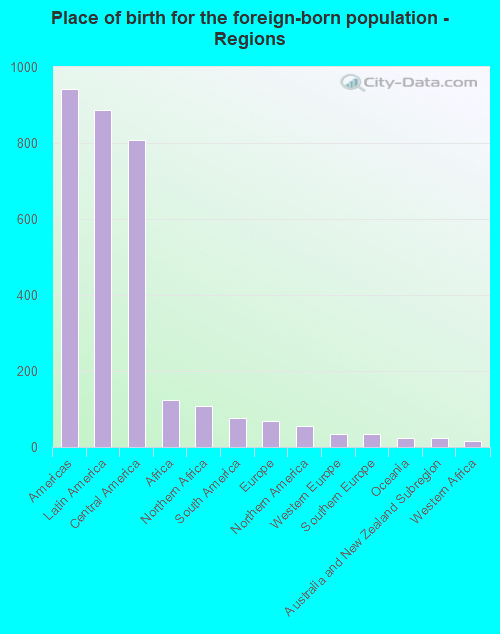
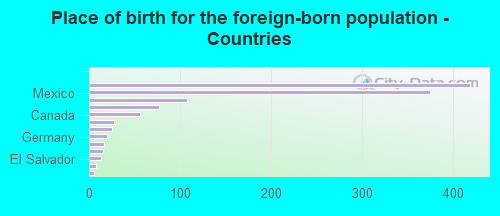
According to 2022 data, the most numerous races in Newberry, SC are White alone (4,302 residents), Black alone (4,665 residents), and Hispanic (1,625 residents). 86.1% of Newberry residents speak English at home. 10.7% of Newberry, SC residents are foreign-born (8.2% born in Latin America, 1.2% born in Africa), which is 53.1% greater than the foreign-born rate of 5.0% across the entire state of South Carolina.
Race distribution in Newberry
2000 2022
2,652,291 66.1% White alone 1,178,486 29.4% Black alone 95,076 2.4% Hispanic 35,568 0.9% Asian alone 33,290 0.8% Two or more races 12,765 0.3% American Indian alone 3,266 0.08% Other race alone 1,270 0.03% Native Hawaiian and Other
3,301,739 62.5% White alone 1,313,290 24.9% Black alone 343,783 6.5% Hispanic 190,508 3.6% Two or more races 89,888 1.7% Asian alone 29,390 0.6% Other race alone 12,112 0.2% American Indian alone 1,924 0.04% Native Hawaiian and Other
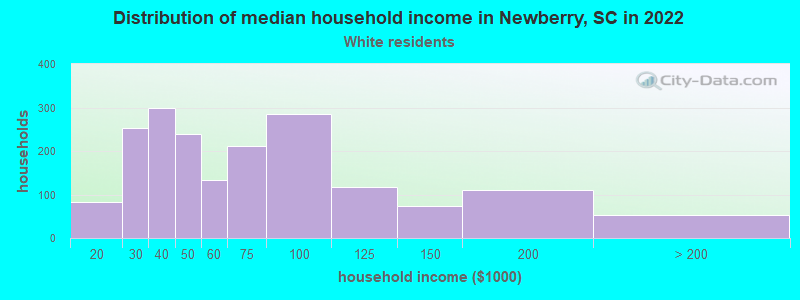
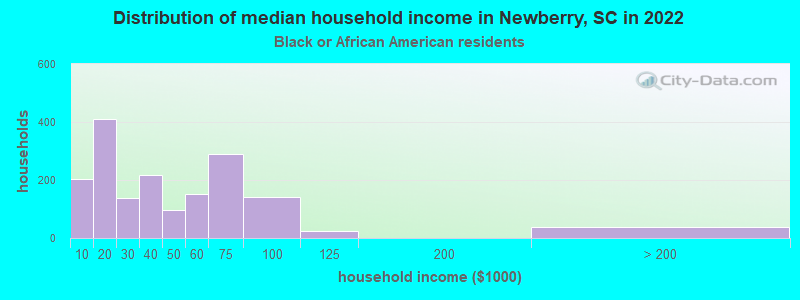
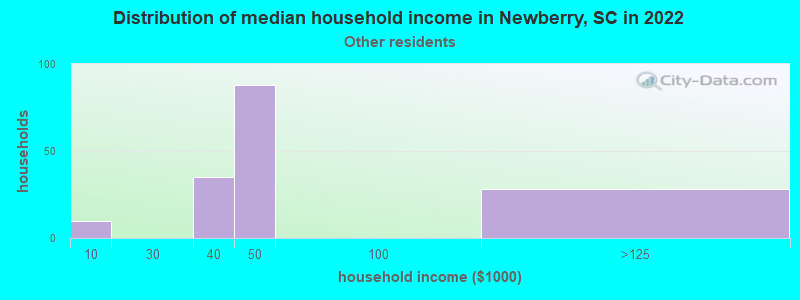
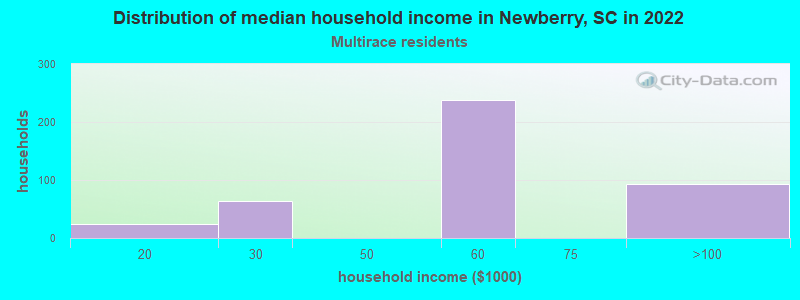
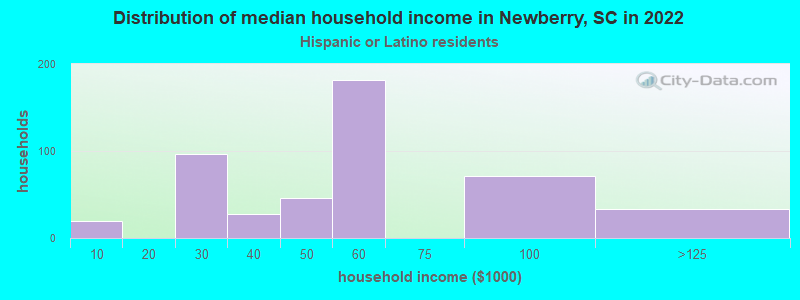
Income and house value in Newberry Median household income in 2022 $58,101 White non-Hispanic householders$34,570 Black householders$49,989 Some other race householders$51,144 Two or more races householders$53,782 Hispanic or Latino race householdersMedian 2022 house value $154,493 White Non-Hispanic householders$93,579 Black or African American householders$124,901 Hispanic or Latino householders
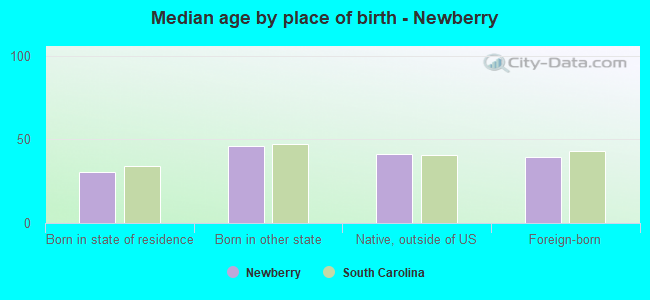
Median age by race in Newberry
43.6 Median age for White residents46.7 41.6 30.2 Median age for Black or African American residents30.7 29.2 -626,702,996.6 Median age for American Indian / Alaska Native residents-583,333,332.8 -659,400,544.3 21.6 Median age for Asian residents-720,616,569.6 -688,832,053.9 -698,412,697.7 Median age for Native Hawaiian / Pacific Islander residents-551,574,375.1 -1,016,109,044.8 30.7 Median age for Other race residents21.8 37.5 23.7 Median age for Two or more races residents25.6 24.1 46.1 Median age for White alone residents50.7 44.3 21.9 Median age for Hispanic or Latino residents30.5 20.7
Owner/renter occupied households by race in Newberry
House owners and renters - White residents 1,382 74.3% Owner occupied479 25.7% Renter occupiedHouse owners and renters - Black or African American residents 500 29.8% Owner occupied1,176 70.2% Renter occupiedHouse owners and renters - American Indian / Alaska Native residents 28 100.0% Owner occupiedHouse owners and renters - Other race residents 133 75.4% Owner occupied43 24.6% Renter occupiedHouse owners and renters - Two or more races residents 276 61.7% Owner occupied171 38.3% Renter occupiedHouse owners and renters - White alone residents 1,326 73.1% Owner occupied488 26.9% Renter occupiedHouse owners and renters - Hispanic or Latino residents 371 72.6% Owner occupied140 27.4% Renter occupied
Language usage in Newberry
English speakers - Total 86.1% of residents of Newberry speak English at home.
10.4% of residents speak Spanish at home 422 39.7% Speak English very well642 60.3% Speak English less than very well3.3% of residents speak other language at home 154 45.2% Speak English very well187 54.8% Speak English less than very well
English speakers - Born in the United States 91.9% of residents of Newberry speak English at home.
7.9% of residents speak Spanish at home 170 100.0% Speak English very well
English speakers - Native, born elsewhere 95.0% of residents of Newberry speak English at home.
1.0% of residents speak Spanish at home 1 100.0% Speak English very well
English speakers - Foreign-born 7.0% of residents of Newberry speak English at home.
65.6% of residents speak Spanish at home 110 15.3% Speak English very well610 84.7% Speak English less than very well23.4% of residents speak other language at home 100 38.9% Speak English very well157 61.1% Speak English less than very well
White (Caucasian) - Speak only English Native:
95.9% (3,926)Foreign-born:
25.2% (72)
White (Caucasian) - Speak another language Native:
3.7% (151)Foreign-born:
69.7% (200)
Asian - Speak only English Native:
95.1% (20)Foreign-born:
90.3% (7)
Other race - Speak another language Native:
34.8% (94)Foreign-born:
98.6% (371)
Two or more races - Speak another language Native:
32.0% (156)Foreign-born:
100.0% (519)
White alone - Speak only English Native:
98.1% (3,920)Foreign-born:
30.5% (78)
White alone - Speak another language Native:
1.9% (76)Foreign-born:
68.6% (175)
Hispanic or Latino - Speak another language Native:
52.6% (315)Foreign-born:
100.0% (736)
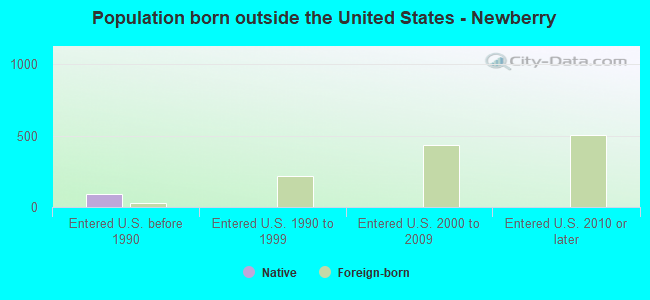
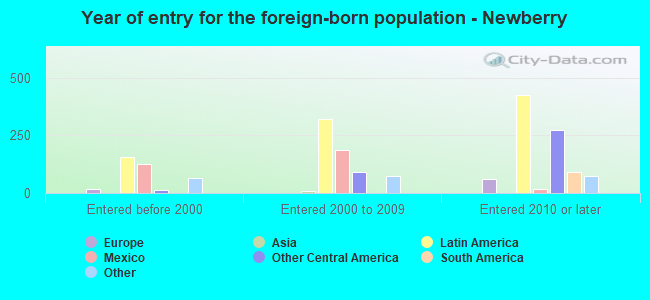
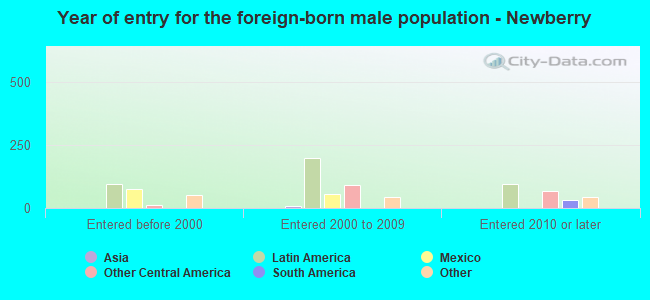
Foreign-born residents in Newberry 1,171 residents are foreign born (8.2% Latin America , 1.2% Africa ).
This city:
10.7%South Carolina:
5.3%
Marital status for residents in Newberry Marital status - White (Caucasian) population 15 years and over
Males 38.1% Never married45.1% Now married4.4% Separated7.9% Widowed4.5% DivorcedFemales 37.3% Never married35.4% Now married3.4% Separated14.9% Widowed9.0% DivorcedWomen who gave birth in the past 12 months Now married:
100.0% (38)Unmarried:
0.0% (0)
Women who did not give birth in the past 12 months Now married:
20.9% (213)Unmarried:
79.1% (806)
Marital status - Black or African American population 15 years and over
Males 45.8% Never married34.0% Now married6.6% Separated0.0% Widowed13.7% DivorcedFemales 55.0% Never married17.9% Now married6.0% Separated11.6% Widowed9.5% DivorcedWomen who gave birth in the past 12 months Now married:
58.7% (73)Unmarried:
41.3% (51)
Women who did not give birth in the past 12 months Now married:
11.0% (114)Unmarried:
89.0% (926)
Marital status - Asian population 15 years and over
Males 100.0% Never married0.0% Now married0.0% Separated0.0% Widowed0.0% DivorcedFemales 100.0% Never married0.0% Now married0.0% Separated0.0% Widowed0.0% DivorcedWomen who did not give birth in the past 12 months Now married:
0.0% (0)Unmarried:
100.0% (3)
Marital status - Other race population 15 years and over
Males 55.7% Never married39.5% Now married0.0% Separated4.8% Widowed0.0% DivorcedFemales 29.9% Never married63.3% Now married0.0% Separated0.0% Widowed6.8% DivorcedWomen who did not give birth in the past 12 months Now married:
45.6% (92)Unmarried:
54.4% (110)
Marital status - Two or more races population 15 years and over
Males 30.4% Never married69.6% Now married0.0% Separated0.0% Widowed0.0% DivorcedFemales 88.7% Never married11.3% Now married0.0% Separated0.0% Widowed0.0% DivorcedWomen who did not give birth in the past 12 months Now married:
11.6% (38)Unmarried:
88.4% (286)
Marital status - White alone, not Hispanic / Latino population 15 years and over
Males 35.9% Never married46.7% Now married4.5% Separated8.2% Widowed4.6% DivorcedFemales 35.4% Never married36.5% Now married3.5% Separated15.3% Widowed9.2% DivorcedWomen who gave birth in the past 12 months Now married:
100.0% (38)Unmarried:
0.0% (0)
Women who did not give birth in the past 12 months Now married:
22.2% (217)Unmarried:
77.8% (757)
Marital status - Hispanic or Latino population 15 years and over
Males 45.3% Never married52.1% Now married0.0% Separated2.7% Widowed0.0% DivorcedFemales 62.8% Never married33.9% Now married0.0% Separated0.0% Widowed3.3% DivorcedWomen who did not give birth in the past 12 months Now married:
21.3% (90)Unmarried:
78.7% (335)
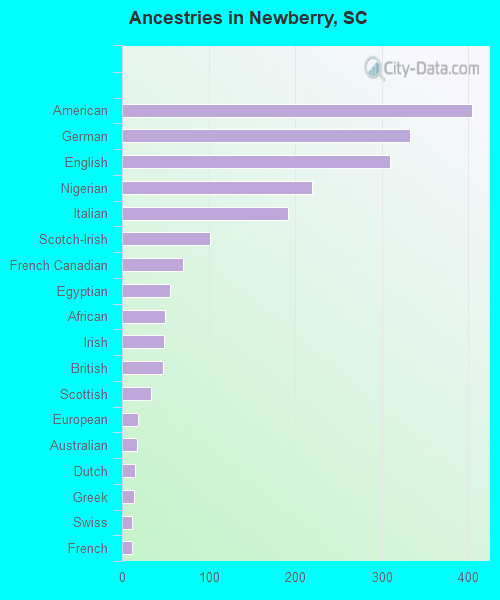
Ancestries in Newberry
404 6.7% American333 5.5% German310 5.2% English220 3.7% Nigerian192 3.2% Italian102 1.7% Scotch-Irish71 1.2% French Canadian56 0.9% Egyptian50 0.8% African49 0.8% Irish47 0.8% British33 0.5% Scottish19 0.3% European17 0.3% Australian15 0.2% Dutch14 0.2% Greek12 0.2% Swiss11 0.2% French
Geographical mobility in Newberry Same house 1 year ago 3,489 77.4% White (Caucasian)3,530 78.1% Black or African American26 100.0% American Indian / Alaska Native29 99.7% Asian529 77.0% Other race1,029 86.7% Two or more races3,249 76.1% White alone, not Hispanic / Latino1,438 88.6% Hispanic or LatinoMoved within same county 224 5.0% White / Caucasian402 8.9% Black or African American45 3.8% Two or more races227 5.3% White alone, not Hispanic / Latino35 2.2% Hispanic or LatinoMoved within same state 581 12.9% White / Caucasian486 10.8% Black or African American123 17.9% Other race103 8.7% Two or more races581 13.6% White alone, not Hispanic / Latino122 7.5% Hispanic or LatinoMoved from different state 192 4.3% White / Caucasian77 1.7% Black or African American16 1.4% Two or more races195 4.6% White alone, not Hispanic / Latino15 0.9% Hispanic or LatinoMoved from abroad 14 0.3% White15 0.4% White alone, not Hispanic / Latino
Children Nativity (place of birth) in Newberry
Children under 6 years - Living with two parents Both parents native 96 100.0% NativeBoth parents foreign-born 52 100.0% NativeChildren under 6 years - Living with one parent Native parent 420 100.0% NativeForeign-born parent 68 100.0% NativeChildren 6 to 17 years - Living with two parents Both parents native 374 100.0% NativeBoth parents foreign-born 46 55.0% Native37 45.0% Foreign-bornOne native, one foreign-born parent 6 100.0% NativeChildren 6 to 17 years - Living with one parent Native parent 739 100.0% NativeForeign-born parent 304 55.7% Native242 44.3% Foreign-born
Grandparents responsible for own grandchildren in Newberry
Grandparents (30 to 59 years) White / Caucasian 12 100.0% Not responsible for grandchildrenBlack or African American 70 100.0% Not responsible for grandchildrenTwo or more races 18 100.0% Responsible for grandchildrenWhite alone, not Hispanic / Latino 12 100.0% Not responsible for grandchildrenHispanic or Latino 16 100.0% Responsible for grandchildrenGrandparents (60 years and over) White / Caucasian 31 100.0% Not responsible for grandchildrenBlack or African American 21 42.0% Responsible for grandchildren29 58.0% Not responsible for grandchildrenWhite alone, not Hispanic / Latino 32 100.0% Not responsible for grandchildren