Races in Newburg, Kentucky (KY) Detailed Stats
Ancestries, Foreign-born residents, place of birth

Recent posts about races in Newburg, Kentucky on our local forum with over 2,400,000 registered users:
 | Best neighborhood to buy a house for me (15 replies) |
| Moving Back to Louisville (6 replies) |
| Possible relocation to Louisville... (5 replies) |
| Louisville for Retired People (12 replies) |
| Moving to Louisville from Argentina next year (125 replies) |
| Moving to Louisville (as a creative young professional) (22 replies) |
2.8% of Newburg, KY residents are foreign-born (1.9% born in Asia, 0.7% born in Latin America), which is 42.6% less than the foreign-born rate of 4.0% across the entire state of Kentucky.
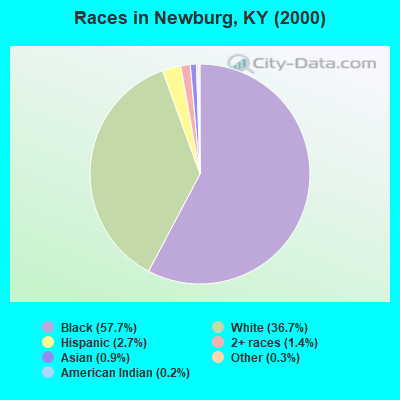
Race distribution in Newburg

- 11,91757.7%Black alone
- 7,57736.7%White alone
- 5602.7%Hispanic
- 2961.4%Two or more races
- 1770.9%Asian alone
- 550.3%Other race alone
- 450.2%American Indian alone
- 90.04%Native Hawaiian and Other
Pacific Islander alone
2000
2022
-
- 3,608,01389.3%White alone
- 293,6397.3%Black alone
- 59,9391.5%Hispanic
- 37,7500.9%Two or more races
- 29,3680.7%Asian alone
- 7,9390.2%American Indian alone
- 3,8460.10%Other race alone
- 1,2750.03%Native Hawaiian and Other
Pacific Islander alone

-
- 3,710,99882.2%White alone
- 343,1947.6%Black alone
- 187,4834.2%Hispanic
- 187,3944.2%Two or more races
- 62,2401.4%Asian alone
- 13,5290.3%Other race alone
- 4,3020.10%American Indian alone
- 3,1700.07%Native Hawaiian and Other
Pacific Islander alone

Income and house value in Newburg
- Median household income in 2022
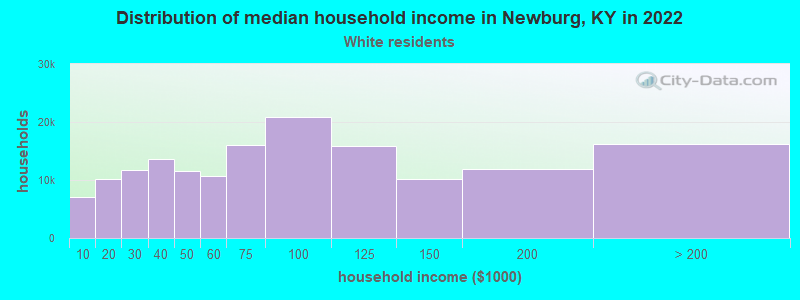
- $49,036White non-Hispanic householders
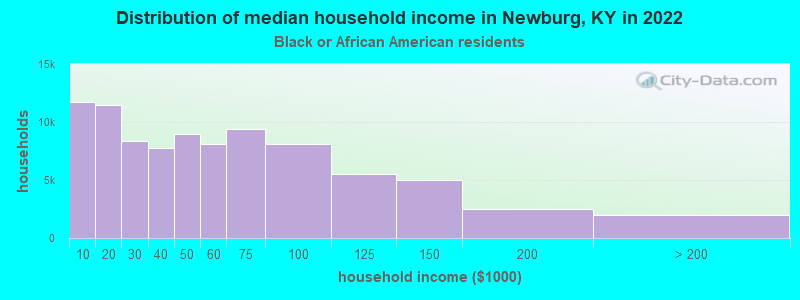
- $56,034Black householders
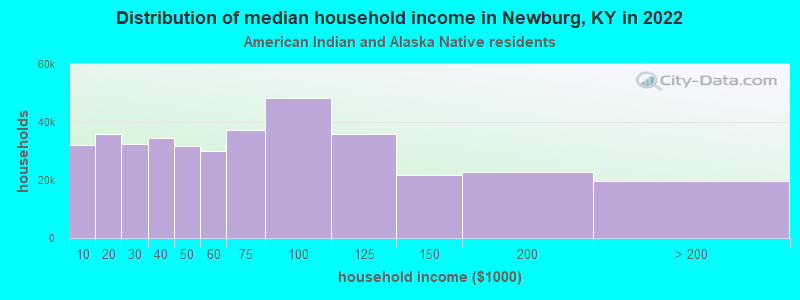
- $21,961American Indian and Alaska Native householders
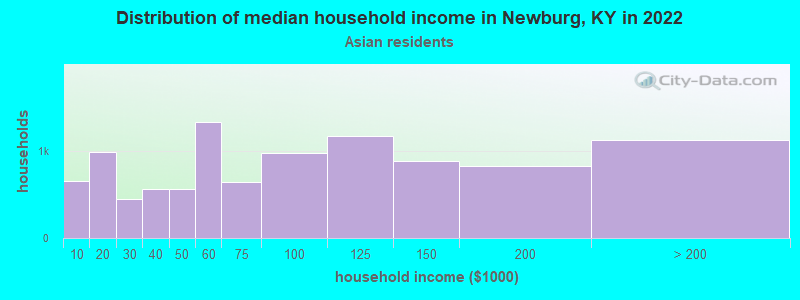
- $100,602Asian householders
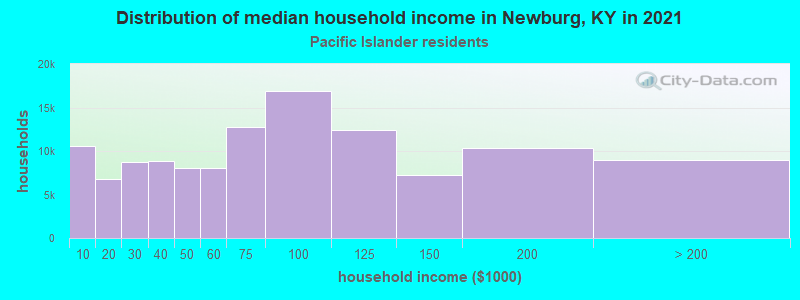
- $110,343Native Hawaiian and other Pacific Islander householders
- $54,063Some other race householders
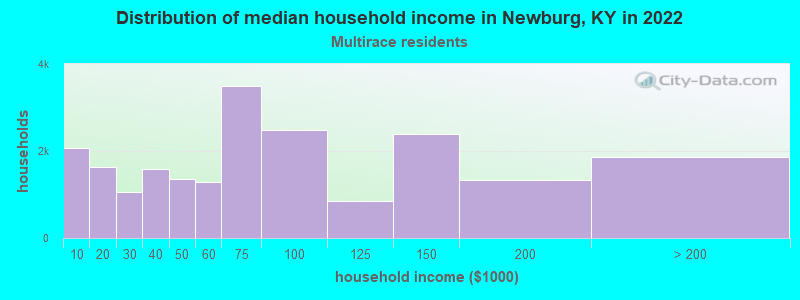
- $72,992Two or more races householders
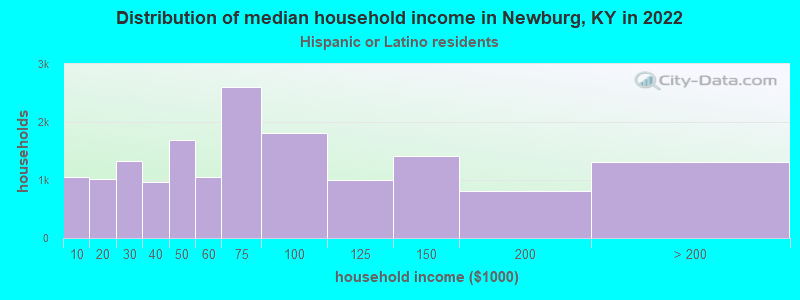
- $63,327Hispanic or Latino race householders
- Median 2022 house value
- $187,476White Non-Hispanic householders
- $162,174Black or African American householders
- $194,946Asian householders
- $180,729Some other race householders
- $265,069Two or more races householders
- $259,768Hispanic or Latino householders
Household income for White non-Hispanic householders
Household income for Black householders
Household income for American Indian and Alaska Native householders
Household income for Asian householders
Household income for Native Hawaiian and other Pacific Islander householders
Household income for Two or more races householders
Household income for Hispanic or Latino race householders
Foreign-born residents in Newburg
579 residents are foreign born (1.9% Asia, 0.7% Latin America).
| This city: | 2.8% |
| Kentucky: | 2.0% |
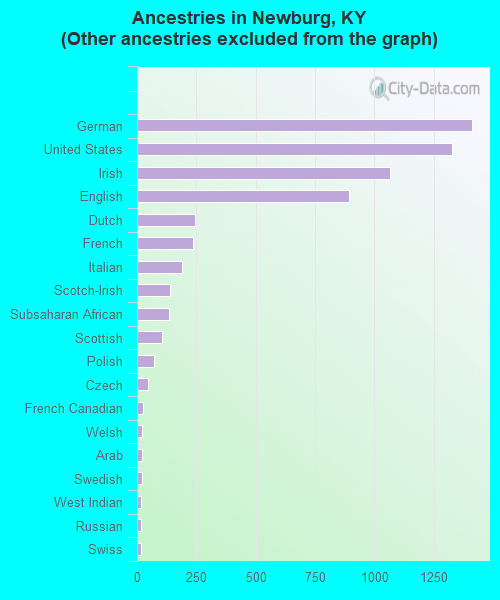
Ancestries in Newburg

- 12,31967.2%Other
- 1,4127.7%German
- 1,3267.2%United States
- 1,0675.8%Irish
- 8934.9%English
- 2441.3%Dutch
- 2341.3%French
- 1881.0%Italian
- 1400.8%Scotch-Irish
- 1360.7%Subsaharan African
- 1050.6%Scottish
- 730.4%Polish
- 450.2%Czech
- 240.1%French Canadian
- 220.1%Welsh
- 210.1%Arab
- 190.1%Swedish
- 170.09%West Indian
- 150.08%Russian
- 150.08%Swiss
- 100.05%Norwegian
- 70.04%Danish
- 70.04%Portuguese
- 10.01%Hungarian
Zip codes: 40219.