Races in Newbury, New Hampshire (NH) Detailed Stats
Ancestries, Foreign-born residents, place of birth

Recent posts about races in Newbury, New Hampshire on our local forum with over 2,400,000 registered users:
 | Around 95 up to Portsmouth - Looking to buy a house in good school district 475k (11 replies) |
| NH Sale & Income tax offset with property taxes? (150 replies) |
| First visit to NH (28 replies) |
| interested in buying a house in southern NH (7 replies) |
| Moving from MA to NH Town Suggestions to Start a Family (5 replies) |
| Some ideas for relocation? (18 replies) |
6.3% of Newbury, NH residents are foreign-born (2.5% born in North America, 1.9% born in Europe, 1.4% born in Latin America), which is 21.2% greater than the foreign-born rate of 5.0% across the entire state of New Hampshire.
Race distribution in Newbury

- 1,65997.5%White alone
- 201.2%Hispanic
- 130.8%Two or more races
- 70.4%Black alone
- 20.1%Asian alone
- 10.06%American Indian alone

2000
2022
-
- 1,175,25295.1%White alone
- 20,4891.7%Hispanic
- 15,8031.3%Asian alone
- 11,6060.9%Two or more races
- 8,3540.7%Black alone
- 2,6980.2%American Indian alone
- 1,2540.1%Other race alone
- 3300.03%Native Hawaiian and Other
Pacific Islander alone

-
- 1,208,10186.6%White alone
- 63,4794.5%Hispanic
- 60,7244.4%Two or more races
- 36,5192.6%Asian alone
- 17,9311.3%Black alone
- 6,6150.5%Other race alone
- 1,0140.07%American Indian alone
- 8480.06%Native Hawaiian and Other
Pacific Islander alone

Income and house value in Newbury
- Median household income in 2022
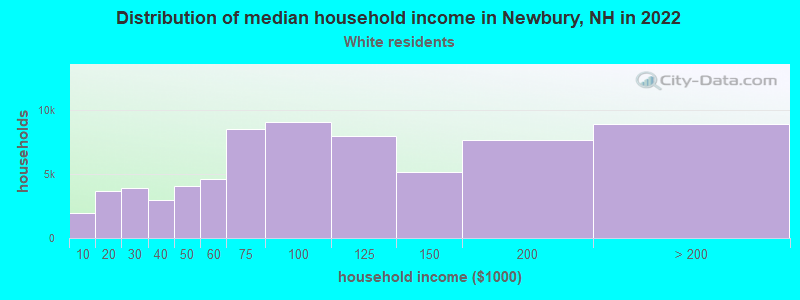
- $100,439White non-Hispanic householders
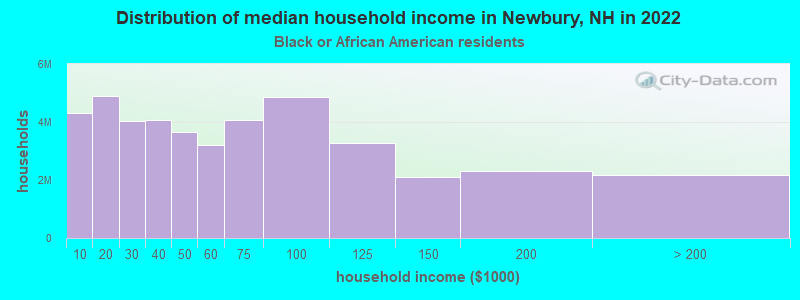
- $134,509Black householders
- over $200,000Some other race householders
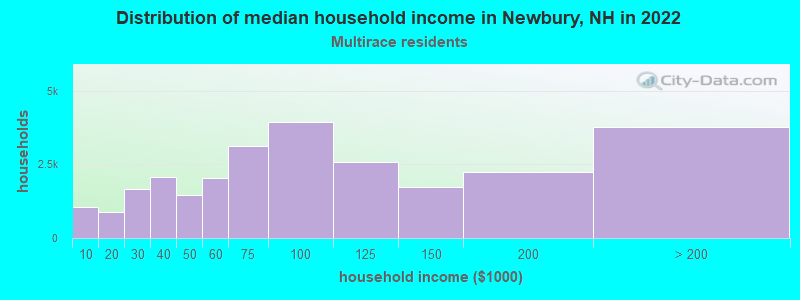
- $155,451Two or more races householders
- $9,435Hispanic or Latino race householders
- Median 2022 house value
- $452,205White Non-Hispanic householders
- $352,063Black or African American householders
- $266,003American Indian or Alaska Native householders
- over $1,000,000Some other race householders
- $423,727Two or more races householders
Household income for White non-Hispanic householders
Household income for Black householders
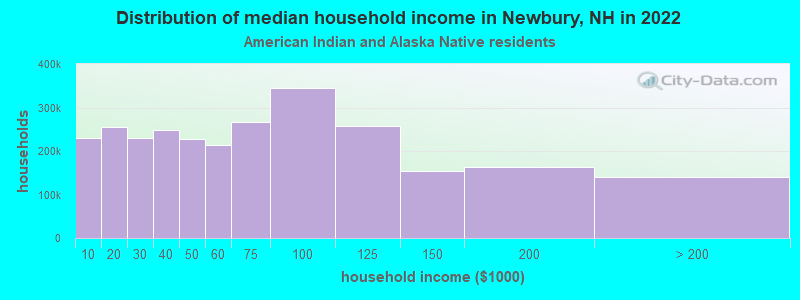
Household income for American Indian and Alaska Native householders
Household income for Two or more races householders
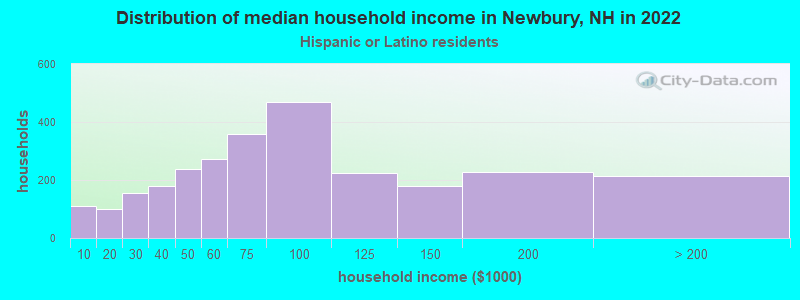
Household income for Hispanic or Latino race householders
Foreign-born residents in Newbury
108 residents are foreign born (2.5% North America, 1.9% Europe, 1.4% Latin America).
| This city: | 6.3% |
| New Hampshire: | 4.4% |
Ancestries in Newbury

- 34917.8%English
- 28014.3%Irish
- 20710.6%German
- 19610.0%Other
- 1779.0%French
- 1387.0%United States
- 1035.3%Italian
- 974.9%French Canadian
- 834.2%Scottish
- 723.7%Polish
- 462.3%Scotch-Irish
- 442.2%Dutch
- 422.1%Swedish
- 211.1%Russian
- 170.9%Lithuanian
- 130.7%Greek
- 130.7%Portuguese
- 120.6%Norwegian
- 110.6%Czech
- 100.5%Hungarian
- 80.4%Welsh
- 70.4%Danish
- 70.4%Swiss
- 50.3%Arab
- 30.2%Slovak

Zip codes: 03255.