Races in Newcastle, Washington (WA) Detailed Stats
Data:
Races - White alone (%)
Races - White alone (% change since 2000)
Races - Black alone (%)
Races - Black alone (% change since 2000)
Races - American Indian alone (%)
Races - American Indian alone (% change since 2000)
Races - Asian alone (%)
Races - Asian alone (% change since 2000)
Races - Hispanic (%)
Races - Hispanic (% change since 2000)
Races - Native Hawaiian and Other Pacific Islander alone (%)
Races - Native Hawaiian and Other Pacific Islander alone (% change since 2000)
Races - Two or more races(%)
Races - Two or more races(% change since 2000)
Races - Other race alone (%)
Races - Other race alone (% change since 2000)
Racial diversity
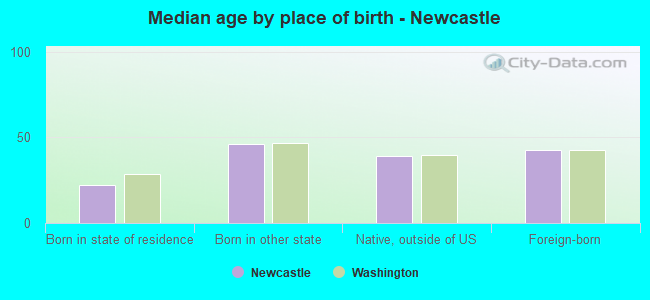
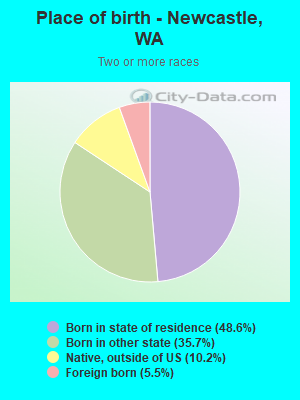
Place of birth - Born in state of residence (%)
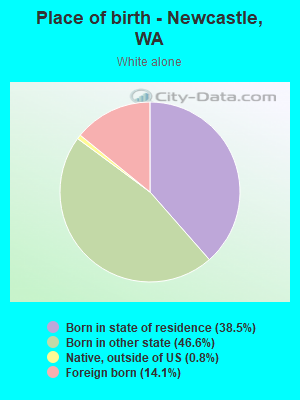
Place of birth - Born in state of residence (%) - White
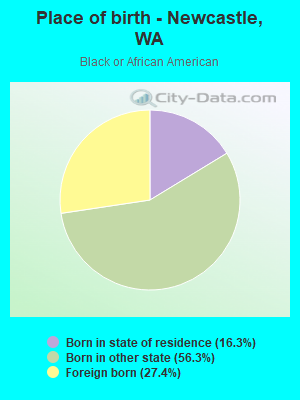
Place of birth - Born in state of residence (%) - Black or African American
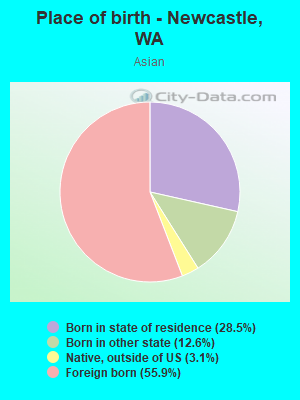
Place of birth - Born in state of residence (%) - Asian
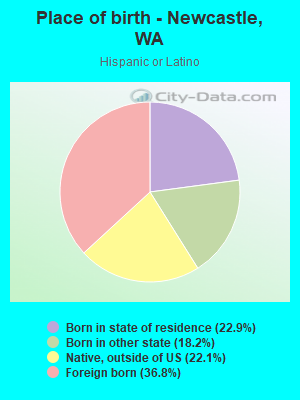
Place of birth - Born in state of residence (%) - Hispanic or Latino
Place of birth - Born in state of residence (%) - American Indian and Alaska Native
Place of birth - Born in state of residence (%) - Multirace
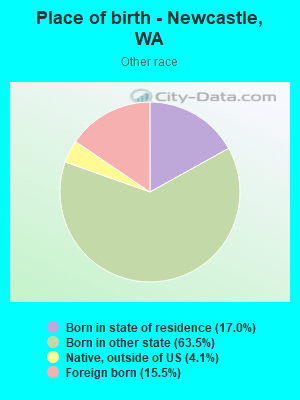
Place of birth - Born in state of residence (%) - Other Race
Place of birth - Born in other state (%)
Place of birth - Born in other state (%) - White
Place of birth - Born in other state (%) - Black or African American
Place of birth - Born in other state (%) - Asian
Place of birth - Born in other state (%) - Hispanic or Latino
Place of birth - Born in other state (%) - American Indian and Alaska Native
Place of birth - Born in other state (%) - Multirace
Place of birth - Born in other state (%) - Other Race
Place of birth - Native, outside of US (%)
Place of birth - Native, outside of US (%) - White
Place of birth - Native, outside of US (%) - Black or African American
Place of birth - Native, outside of US (%) - Asian
Place of birth - Native, outside of US (%) - Hispanic or Latino
Place of birth - Native, outside of US (%) - American Indian and Alaska Native
Place of birth - Native, outside of US (%) - Multirace
Place of birth - Native, outside of US (%) - Other Race
Place of birth - Foreign born (%)
Place of birth - Foreign born (%) - White
Place of birth - Foreign born (%) - Black or African American
Place of birth - Foreign born (%) - Asian
Place of birth - Foreign born (%) - Hispanic or Latino
Place of birth - Foreign born (%) - American Indian and Alaska Native
Place of birth - Foreign born (%) - Multirace
Place of birth - Foreign born (%) - Other Race
Residents speaking English at home (%)
Residents speaking English at home - Born in the United States (%)
Residents speaking English at home - Native, born elsewhere (%)
Residents speaking English at home - Foreign born (%)
Residents speaking Spanish at home (%)
Residents speaking Spanish at home - Born in the United States (%)
Residents speaking Spanish at home - Native, born elsewhere (%)
Residents speaking Spanish at home - Foreign born (%)
Residents speaking other language at home (%)
Residents speaking other language at home - Born in the United States (%)
Residents speaking other language at home - Native, born elsewhere (%)
Residents speaking other language at home - Foreign born (%)
Marital status - Never married (%)
Marital status - Now married (%)
Marital status - Separated (%)
Marital status - Widowed (%)
Marital status - Divorced (%)
Ancestries Reported - Arab (%)
Ancestries Reported - Czech (%)
Ancestries Reported - Danish (%)
Ancestries Reported - Dutch (%)
Ancestries Reported - English (%)
Ancestries Reported - French (%)
Ancestries Reported - French Canadian (%)
Ancestries Reported - German (%)
Ancestries Reported - Greek (%)
Ancestries Reported - Hungarian (%)
Ancestries Reported - Irish (%)
Ancestries Reported - Italian (%)
Ancestries Reported - Lithuanian (%)
Ancestries Reported - Norwegian (%)
Ancestries Reported - Polish (%)
Ancestries Reported - Portuguese (%)
Ancestries Reported - Russian (%)
Ancestries Reported - Scotch-Irish (%)
Ancestries Reported - Scottish (%)
Ancestries Reported - Slovak (%)
Ancestries Reported - Subsaharan African (%)
Ancestries Reported - Swedish (%)
Ancestries Reported - Swiss (%)
Ancestries Reported - Ukrainian (%)
Ancestries Reported - United States (%)
Ancestries Reported - Welsh (%)
Ancestries Reported - West Indian (%)
Ancestries Reported - Other (%)
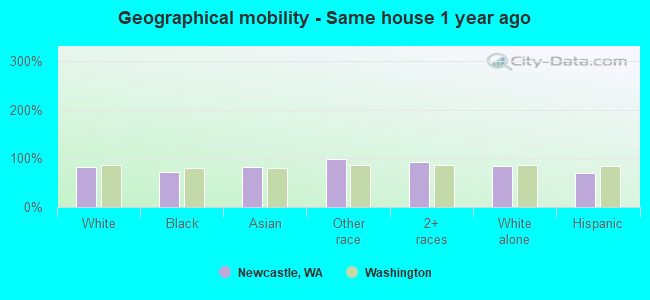
Geographical mobility - Same house 1 year ago (%)
Geographical mobility - Same house 1 year ago (%) - White
Geographical mobility - Same house 1 year ago (%) - Black or African American
Geographical mobility - Same house 1 year ago (%) - Asian
Geographical mobility - Same house 1 year ago (%) - Hispanic or Latino
Geographical mobility - Same house 1 year ago (%) - American Indian and Alaska Native
Geographical mobility - Same house 1 year ago (%) - Multirace
Geographical mobility - Same house 1 year ago (%) - Other Race
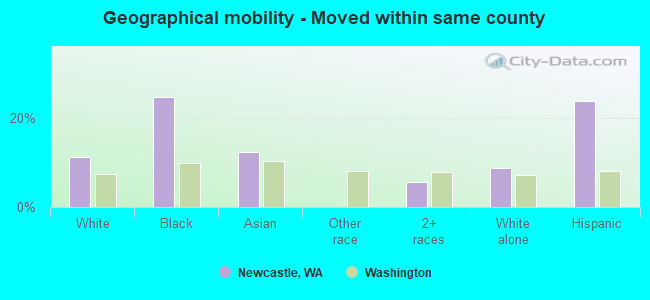
Geographical mobility - Moved within same county (%)
Geographical mobility - Moved within same county (%) - White
Geographical mobility - Moved within same county (%) - Black or African American
Geographical mobility - Moved within same county (%) - Asian
Geographical mobility - Moved within same county (%) - Hispanic or Latino
Geographical mobility - Moved within same county (%) - American Indian and Alaska Native
Geographical mobility - Moved within same county (%) - Multirace
Geographical mobility - Moved within same county (%) - Other Race
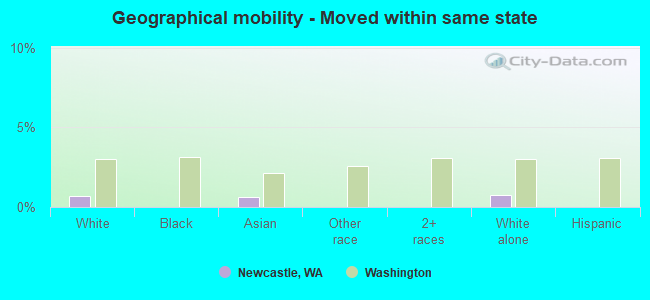
Geographical mobility - Moved from different county within same state (%)
Geographical mobility - Moved from different county within same state (%) - White
Geographical mobility - Moved from different county within same state (%) - Black or African American
Geographical mobility - Moved from different county within same state (%) - Asian
Geographical mobility - Moved from different county within same state (%) - Hispanic or Latino
Geographical mobility - Moved from different county within same state (%) - American Indian and Alaska Native
Geographical mobility - Moved from different county within same state (%) - Multirace
Geographical mobility - Moved from different county within same state (%) - Other Race
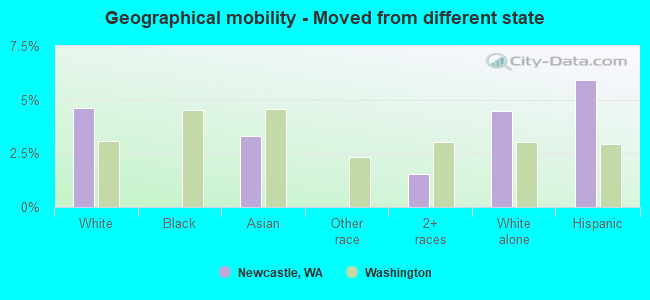
Geographical mobility - Moved from different state (%)
Geographical mobility - Moved from different state (%) - White
Geographical mobility - Moved from different state (%) - Black or African American
Geographical mobility - Moved from different state (%) - Asian
Geographical mobility - Moved from different state (%) - Hispanic or Latino
Geographical mobility - Moved from different state (%) - American Indian and Alaska Native
Geographical mobility - Moved from different state (%) - Multirace
Geographical mobility - Moved from different state (%) - Other Race
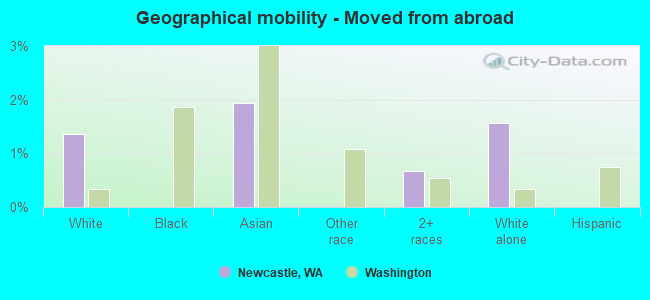
Geographical mobility - Moved from abroad (%)
Geographical mobility - Moved from abroad (%) - White
Geographical mobility - Moved from abroad (%) - Black or African American
Geographical mobility - Moved from abroad (%) - Asian
Geographical mobility - Moved from abroad (%) - Hispanic or Latino
Geographical mobility - Moved from abroad (%) - American Indian and Alaska Native
Geographical mobility - Moved from abroad (%) - Multirace
Geographical mobility - Moved from abroad (%) - Other Race
Place of birth for the foreign-born population - Ireland (%)
Place of birth for the foreign-born population - Denmark (%)
Place of birth for the foreign-born population - Norway (%)
Place of birth for the foreign-born population - Sweden (%)
Place of birth for the foreign-born population - United Kingdom (%)
Place of birth for the foreign-born population - England (%)
Place of birth for the foreign-born population - Scotland (%)
Place of birth for the foreign-born population - Other Northern Europe (%)
Place of birth for the foreign-born population - Austria (%)
Place of birth for the foreign-born population - Belgium (%)
Place of birth for the foreign-born population - France (%)
Place of birth for the foreign-born population - Germany (%)
Place of birth for the foreign-born population - Netherlands (%)
Place of birth for the foreign-born population - Switzerland (%)
Place of birth for the foreign-born population - Other Western Europe (%)
Place of birth for the foreign-born population - Greece (%)
Place of birth for the foreign-born population - Italy (%)
Place of birth for the foreign-born population - Portugal (%)
Place of birth for the foreign-born population - Spain (%)
Place of birth for the foreign-born population - Other Southern Europe (%)
Place of birth for the foreign-born population - Albania (%)
Place of birth for the foreign-born population - Belarus (%)
Place of birth for the foreign-born population - Bosnia and Herzegovina (%)
Place of birth for the foreign-born population - Bulgaria (%)
Place of birth for the foreign-born population - Croatia (%)
Place of birth for the foreign-born population - Czechoslovakia (%)
Place of birth for the foreign-born population - Hungary (%)
Place of birth for the foreign-born population - Latvia (%)
Place of birth for the foreign-born population - Lithuania (%)
Place of birth for the foreign-born population - North Macedonia (Macedonia) (%)
Place of birth for the foreign-born population - Moldova (%)
Place of birth for the foreign-born population - Poland (%)
Place of birth for the foreign-born population - Romania (%)
Place of birth for the foreign-born population - Russia (%)
Place of birth for the foreign-born population - Serbia (%)
Place of birth for the foreign-born population - Ukraine (%)
Place of birth for the foreign-born population - Other Eastern Europe (%)
Place of birth for the foreign-born population - China (%)
Place of birth for the foreign-born population - Hong Kong (%)
Place of birth for the foreign-born population - Taiwan (%)
Place of birth for the foreign-born population - Japan (%)
Place of birth for the foreign-born population - Korea (%)
Place of birth for the foreign-born population - Other Eastern Asia (%)
Place of birth for the foreign-born population - Afghanistan (%)
Place of birth for the foreign-born population - Bangladesh (%)
Place of birth for the foreign-born population - India (%)
Place of birth for the foreign-born population - Iran (%)
Place of birth for the foreign-born population - Kazakhstan (%)
Place of birth for the foreign-born population - Nepal (%)
Place of birth for the foreign-born population - Pakistan (%)
Place of birth for the foreign-born population - Sri Lanka (%)
Place of birth for the foreign-born population - Uzbekistan (%)
Place of birth for the foreign-born population - Other South Central Asia (%)
Place of birth for the foreign-born population - Burma (%)
Place of birth for the foreign-born population - Cambodia (%)
Place of birth for the foreign-born population - Indonesia (%)
Place of birth for the foreign-born population - Laos (%)
Place of birth for the foreign-born population - Malaysia (%)
Place of birth for the foreign-born population - Philippines (%)
Place of birth for the foreign-born population - Singapore (%)
Place of birth for the foreign-born population - Thailand (%)
Place of birth for the foreign-born population - Vietnam (%)
Place of birth for the foreign-born population - Other South Eastern Asia (%)
Place of birth for the foreign-born population - Armenia (%)
Place of birth for the foreign-born population - Iraq (%)
Place of birth for the foreign-born population - Israel (%)
Place of birth for the foreign-born population - Jordan (%)
Place of birth for the foreign-born population - Kuwait (%)
Place of birth for the foreign-born population - Lebanon (%)
Place of birth for the foreign-born population - Saudi Arabia (%)
Place of birth for the foreign-born population - Syria (%)
Place of birth for the foreign-born population - Turkey (%)
Place of birth for the foreign-born population - Yemen (%)
Place of birth for the foreign-born population - Other Western Asia (%)
Place of birth for the foreign-born population - Eritrea (%)
Place of birth for the foreign-born population - Ethiopia (%)
Place of birth for the foreign-born population - Kenya (%)
Place of birth for the foreign-born population - Somalia (%)
Place of birth for the foreign-born population - Uganda (%)
Place of birth for the foreign-born population - Zimbabwe (%)
Place of birth for the foreign-born population - Other Eastern Africa (%)
Place of birth for the foreign-born population - Cameroon (%)
Place of birth for the foreign-born population - Congo (%)
Place of birth for the foreign-born population - Democratic Republic of Congo (Zaire) (%)
Place of birth for the foreign-born population - Other Middle Africa (%)
Place of birth for the foreign-born population - Egypt (%)
Place of birth for the foreign-born population - Morocco (%)
Place of birth for the foreign-born population - Sudan (%)
Place of birth for the foreign-born population - Other Northern Africa (%)
Place of birth for the foreign-born population - South Africa (%)
Place of birth for the foreign-born population - Other Southern Africa (%)
Place of birth for the foreign-born population - Cabo Verde (%)
Place of birth for the foreign-born population - Ghana (%)
Place of birth for the foreign-born population - Liberia (%)
Place of birth for the foreign-born population - Nigeria (%)
Place of birth for the foreign-born population - Senegal (%)
Place of birth for the foreign-born population - Sierra Leone (%)
Place of birth for the foreign-born population - Other Western Africa (%)
Place of birth for the foreign-born population - Australia (%)
Place of birth for the foreign-born population - New Zealand (%)
Place of birth for the foreign-born population - Fiji (%)
Place of birth for the foreign-born population - Micronesia (%)
Place of birth for the foreign-born population - Bahamas (%)
Place of birth for the foreign-born population - Barbados (%)
Place of birth for the foreign-born population - Cuba (%)
Place of birth for the foreign-born population - Dominica (%)
Place of birth for the foreign-born population - Dominican Republic (%)
Place of birth for the foreign-born population - Grenada (%)
Place of birth for the foreign-born population - Haiti (%)
Place of birth for the foreign-born population - Jamaica (%)
Place of birth for the foreign-born population - St. Vincent and the Grenadines (%)
Place of birth for the foreign-born population - Trinidad and Tobago (%)
Place of birth for the foreign-born population - West Indies (%)
Place of birth for the foreign-born population - Other Caribbean (%)
Place of birth for the foreign-born population - Belize (%)
Place of birth for the foreign-born population - Costa Rica (%)
Place of birth for the foreign-born population - El Salvador (%)
Place of birth for the foreign-born population - Guatemala (%)
Place of birth for the foreign-born population - Honduras (%)
Place of birth for the foreign-born population - Mexico (%)
Place of birth for the foreign-born population - Nicaragua (%)
Place of birth for the foreign-born population - Panama (%)
Place of birth for the foreign-born population - Other Central America (%)
Place of birth for the foreign-born population - Argentina (%)
Place of birth for the foreign-born population - Bolivia (%)
Place of birth for the foreign-born population - Brazil (%)
Place of birth for the foreign-born population - Chile (%)
Place of birth for the foreign-born population - Colombia (%)
Place of birth for the foreign-born population - Ecuador (%)
Place of birth for the foreign-born population - Guyana (%)
Place of birth for the foreign-born population - Peru (%)
Place of birth for the foreign-born population - Uruguay (%)
Place of birth for the foreign-born population - Venezuela (%)
Place of birth for the foreign-born population - Other South America (%)
Place of birth for the foreign-born population - Canada (%)
Place of birth for the foreign-born population - Other Northern America (%)
Place of birth for the foreign-born population - Other (%)
Latest news about races in Newcastle, WA collected exclusively by city-data.com from local newspapers, TV, and radio stations
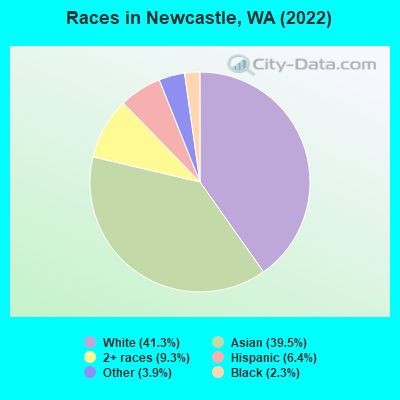
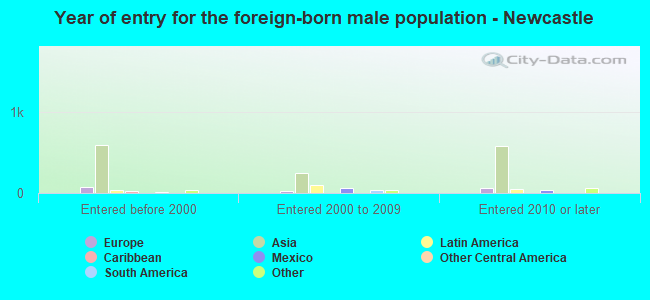
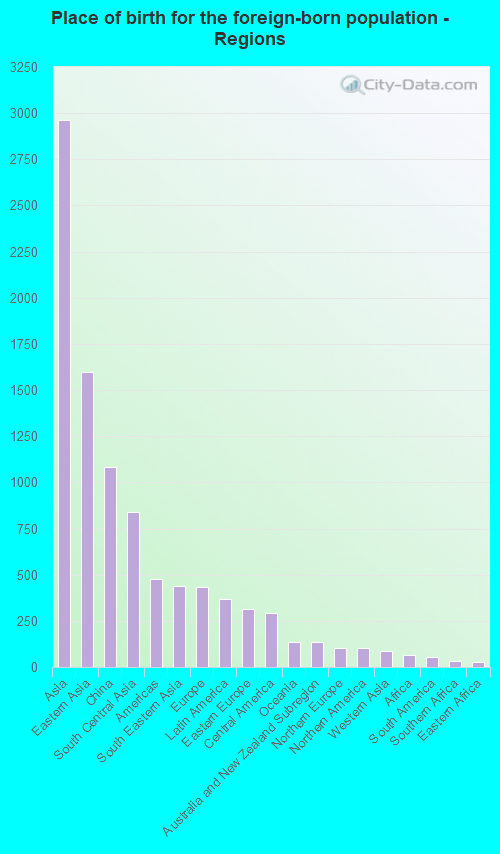
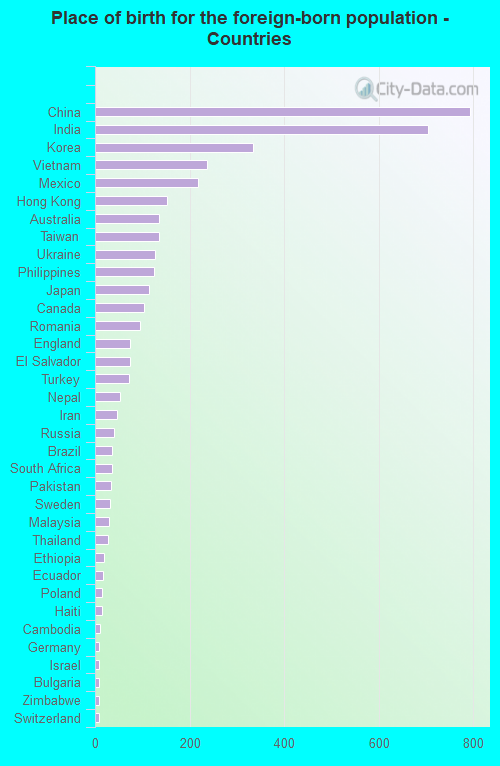
According to 2022 data, the most numerous races in Newcastle, WA are White alone (5,366 residents), Hispanic (830 residents), and Asian alone (5,130 residents). 61.4% of Newcastle residents speak English at home. 31.3% of Newcastle, WA residents are foreign-born (21.9% born in Asia, 3.2% born in Europe), which is 52.2% greater than the foreign-born rate of 15.0% across the entire state of Washington.
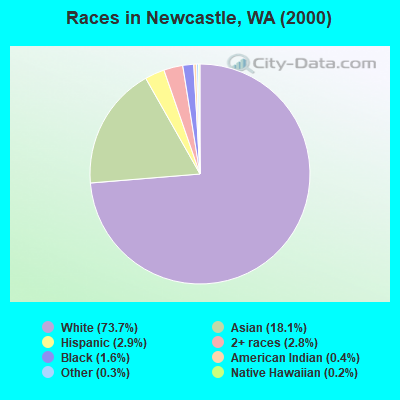
Race distribution in Newcastle
2000 2022
4,652,490 78.9% White alone 441,509 7.5% Hispanic 319,401 5.4% Asian alone 184,631 3.1% Black alone 175,926 3.0% Two or more races 85,396 1.4% American Indian alone 22,779 0.4% Native Hawaiian and Other 11,989 0.2% Other race alone
4,941,456 63.5% White alone 1,093,313 14.0% Hispanic 755,832 9.7% Asian alone 523,448 6.7% Two or more races 299,537 3.8% Black alone 69,024 0.9% American Indian alone 52,231 0.7% Native Hawaiian and Other 50,945 0.7% Other race alone
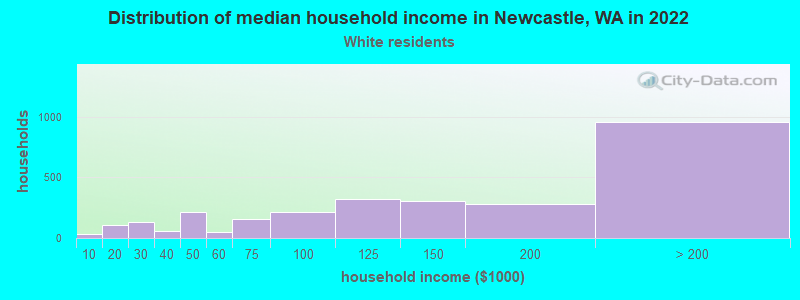
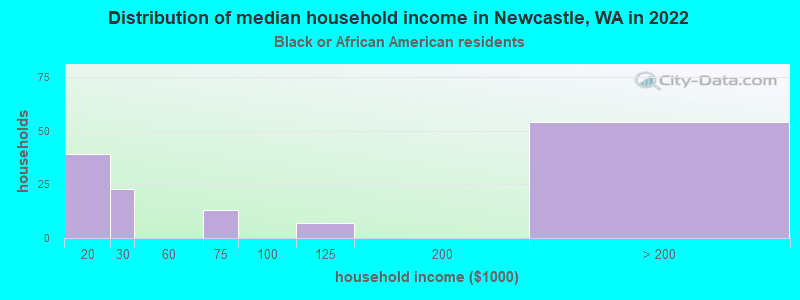
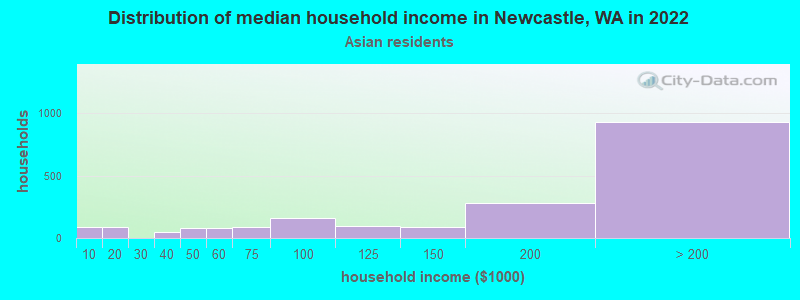
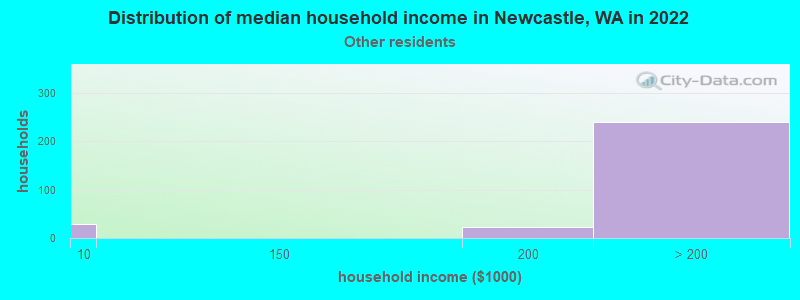
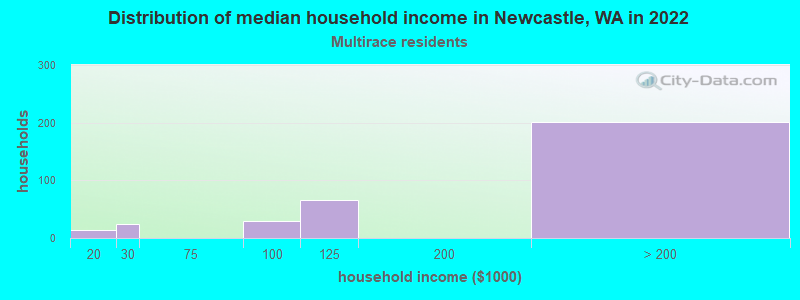
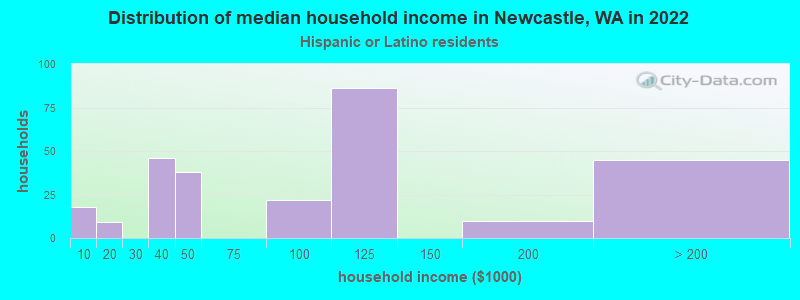
Income and house value in Newcastle Median household income in 2022 $134,786 White non-Hispanic householders$180,438 Asian householdersover $200,000 Some other race householdersover $200,000 Two or more races householders$102,114 Hispanic or Latino race householdersMedian 2022 house value over $1,000,000 White Non-Hispanic householdersover $1,000,000 Black or African American householdersover $1,000,000 American Indian or Alaska Native householders over $1,000,000 Asian householdersover $1,000,000 Some other race householdersover $1,000,000 Two or more races householdersover $1,000,000 Hispanic or Latino householders
Median age by race in Newcastle
44.0 Median age for White residents42.5 47.6 37.7 Median age for Black or African American residents37.1 8.2 -639,412,997.3 Median age for American Indian / Alaska Native residents-658,092,175.1 -631,249,999.4 36.2 Median age for Asian residents34.4 36.8 -653,927,812.5 Median age for Native Hawaiian / Pacific Islander residents-664,509,168.7 -651,945,320.1 46.0 Median age for Other race residents69.0 35.9 15.8 Median age for Two or more races residents17.2 12.7 46.3 Median age for White alone residents42.7 50.1 35.6 Median age for Hispanic or Latino residents31.7 38.6
Owner/renter occupied households by race in Newcastle
House owners and renters - White residents 1,796 63.3% Owner occupied1,042 36.7% Renter occupiedHouse owners and renters - Black or African American residents 17 10.0% Owner occupied150 90.0% Renter occupiedHouse owners and renters - Asian residents 1,402 69.2% Owner occupied623 30.8% Renter occupiedHouse owners and renters - Other race residents 205 93.2% Owner occupied15 6.8% Renter occupiedHouse owners and renters - Two or more races residents 217 65.6% Owner occupied114 34.4% Renter occupiedHouse owners and renters - White alone residents 1,759 64.6% Owner occupied966 35.4% Renter occupiedHouse owners and renters - Hispanic or Latino residents 97 36.8% Owner occupied167 63.2% Renter occupied
Language usage in Newcastle
English speakers - Total 61.4% of residents of Newcastle speak English at home.
5.4% of residents speak Spanish at home 555 84.3% Speak English very well103 15.7% Speak English less than very well34.0% of residents speak other language at home 2,704 65.6% Speak English very well1,416 34.4% Speak English less than very well
English speakers - Born in the United States 88.1% of residents of Newcastle speak English at home.
3.5% of residents speak Spanish at home 144 100.0% Speak English very well8.3% of residents speak other language at home 301 87.5% Speak English very well43 12.5% Speak English less than very well
English speakers - Native, born elsewhere 34.1% of residents of Newcastle speak English at home.
40.9% of residents speak Spanish at home 157 100.0% Speak English very well35.9% of residents speak other language at home 22 15.9% Speak English very well116 84.1% Speak English less than very well
English speakers - Foreign-born 14.9% of residents of Newcastle speak English at home.
7.8% of residents speak Spanish at home 219 69.1% Speak English very well98 30.9% Speak English less than very well77.9% of residents speak other language at home 1,995 63.1% Speak English very well1,168 36.9% Speak English less than very well
White (Caucasian) - Speak only English Native:
93.3% (4,244)Foreign-born:
37.7% (326)
White (Caucasian) - Speak another language Native:
6.6% (301)Foreign-born:
62.0% (535)
Black or African American - Speak only English Native:
81.8% (182)Foreign-born:
10.8% (8)
Black or African American - Speak another language Native:
18.1% (40)Foreign-born:
88.4% (69)
Asian - Speak only English Native:
63.6% (1,268)Foreign-born:
8.4% (241)
Asian - Speak another language Native:
35.3% (704)Foreign-born:
91.6% (2,641)
Other race - Speak another language Native:
8.3% (37)Foreign-born:
100.0% (83)
Two or more races - Speak another language Native:
22.4% (260)Foreign-born:
100.0% (89)
White alone - Speak only English Native:
94.3% (4,190)Foreign-born:
41.2% (314)
White alone - Speak another language Native:
5.9% (264)Foreign-born:
57.3% (437)
Hispanic or Latino - Speak only English Native:
41.1% (187)Foreign-born:
5.4% (17)
Hispanic or Latino - Speak another language Native:
59.9% (272)Foreign-born:
94.7% (303)
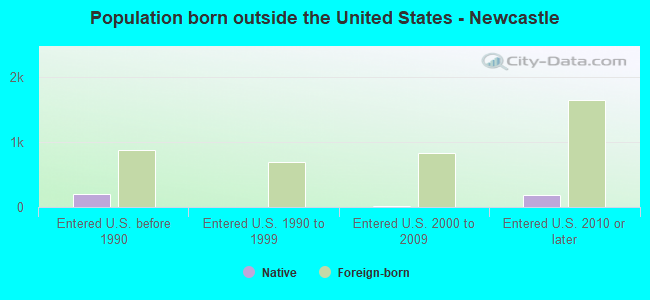
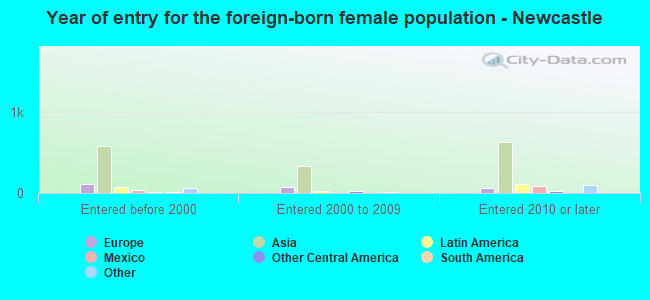
Foreign-born residents in Newcastle 4,076 residents are foreign born (21.9% Asia , 3.2% Europe ).
This city:
31.3%Washington:
14.9%
Marital status for residents in Newcastle Marital status - White (Caucasian) population 15 years and over
Males 31.9% Never married60.3% Now married0.0% Separated0.8% Widowed7.0% DivorcedFemales 24.6% Never married50.1% Now married0.0% Separated11.8% Widowed13.4% DivorcedWomen who gave birth in the past 12 months Now married:
100.0% (42)Unmarried:
0.0% (0)
Women who did not give birth in the past 12 months Now married:
43.0% (532)Unmarried:
57.0% (704)
Marital status - Black or African American population 15 years and over
Males 43.7% Never married31.2% Now married0.0% Separated0.0% Widowed25.1% DivorcedFemales 0.0% Never married90.9% Now married0.0% Separated9.1% Widowed0.0% DivorcedMarital status - Asian population 15 years and over
Males 28.5% Never married70.4% Now married0.0% Separated0.0% Widowed1.1% DivorcedFemales 22.9% Never married65.1% Now married1.0% Separated6.2% Widowed4.8% DivorcedWomen who gave birth in the past 12 months Now married:
100.0% (79)Unmarried:
0.0% (0)
Women who did not give birth in the past 12 months Now married:
62.0% (977)Unmarried:
38.0% (598)
Marital status - Other race population 15 years and over
Males 11.2% Never married25.5% Now married0.0% Separated0.0% Widowed63.3% DivorcedFemales 0.0% Never married77.8% Now married0.0% Separated0.0% Widowed22.2% DivorcedWomen who did not give birth in the past 12 months Now married:
100.0% (152)Unmarried:
0.0% (0)
Marital status - Two or more races population 15 years and over
Males 58.3% Never married37.8% Now married0.0% Separated0.0% Widowed3.9% DivorcedFemales 40.4% Never married52.2% Now married0.0% Separated0.0% Widowed7.3% DivorcedWomen who gave birth in the past 12 months Now married:
100.0% (79)Unmarried:
0.0% (0)
Women who did not give birth in the past 12 months Now married:
17.9% (39)Unmarried:
82.1% (177)
Marital status - White alone, not Hispanic / Latino population 15 years and over
Males 32.0% Never married60.2% Now married0.0% Separated0.8% Widowed7.0% DivorcedFemales 25.3% Never married49.2% Now married0.0% Separated12.5% Widowed13.1% DivorcedWomen who gave birth in the past 12 months Now married:
100.0% (36)Unmarried:
0.0% (0)
Women who did not give birth in the past 12 months Now married:
42.2% (499)Unmarried:
57.8% (683)
Marital status - Hispanic or Latino population 15 years and over
Males 42.4% Never married54.0% Now married0.0% Separated0.0% Widowed3.6% DivorcedFemales 13.4% Never married67.8% Now married0.0% Separated0.0% Widowed18.8% DivorcedWomen who gave birth in the past 12 months Now married:
100.0% (8)Unmarried:
0.0% (0)
Women who did not give birth in the past 12 months Now married:
66.3% (135)Unmarried:
33.7% (69)
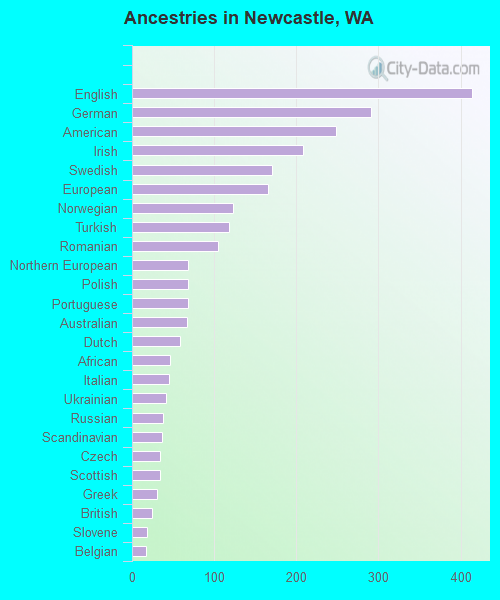
Ancestries in Newcastle
414 5.5% English291 3.9% German249 3.3% American208 2.8% Irish171 2.3% Swedish165 2.2% European123 1.6% Norwegian118 1.6% Turkish105 1.4% Romanian68 0.9% Northern European68 0.9% Polish68 0.9% Portuguese67 0.9% Australian58 0.8% Dutch46 0.6% African45 0.6% Italian41 0.5% Ukrainian38 0.5% Russian36 0.5% Scandinavian34 0.5% Czech34 0.5% Scottish30 0.4% Greek24 0.3% British18 0.2% Slovene17 0.2% Belgian16 0.2% Haitian13 0.2% Egyptian10 0.1% Lebanese10 0.1% Slovak6 0.08% Eastern European5 0.07% Jamaican4 0.05% Bulgarian
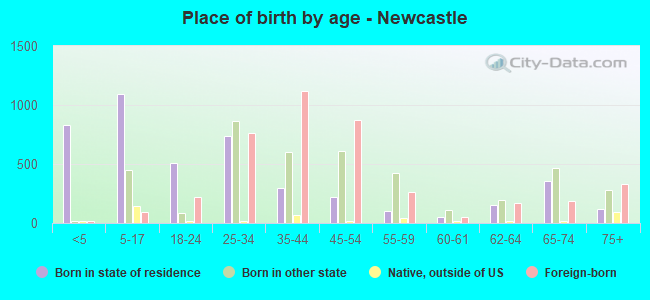
Children Nativity (place of birth) in Newcastle
Children under 6 years - Living with two parents Both parents native 218 100.0% NativeBoth parents foreign-born 304 91.5% Native28 8.5% Foreign-bornOne native, one foreign-born parent 149 100.0% NativeChildren under 6 years - Living with one parent Native parent 36 100.0% NativeForeign-born parent 81 100.0% NativeChildren 6 to 17 years - Living with two parents Both parents native 508 97.3% Native14 2.7% Foreign-bornBoth parents foreign-born 464 91.0% Native46 9.0% Foreign-bornOne native, one foreign-born parent 198 100.0% NativeChildren 6 to 17 years - Living with one parent Native parent 246 100.0% NativeForeign-born parent 167 54.2% Native141 45.8% Foreign-born