Races in Newport, Rhode Island (RI) Detailed Stats
Data:
Races - White alone (%)
Races - White alone (% change since 2000)
Races - Black alone (%)
Races - Black alone (% change since 2000)
Races - American Indian alone (%)
Races - American Indian alone (% change since 2000)
Races - Asian alone (%)
Races - Asian alone (% change since 2000)
Races - Hispanic (%)
Races - Hispanic (% change since 2000)
Races - Native Hawaiian and Other Pacific Islander alone (%)
Races - Native Hawaiian and Other Pacific Islander alone (% change since 2000)
Races - Two or more races(%)
Races - Two or more races(% change since 2000)
Races - Other race alone (%)
Races - Other race alone (% change since 2000)
Racial diversity
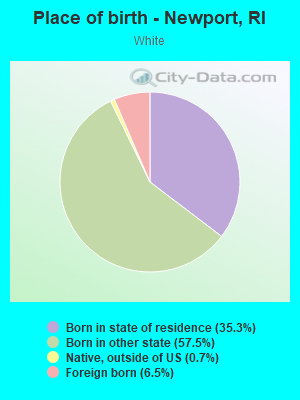
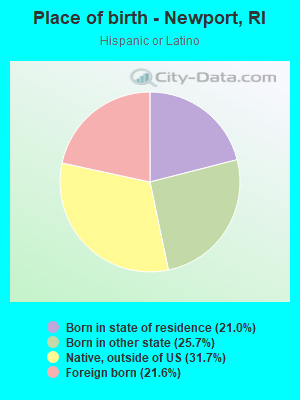
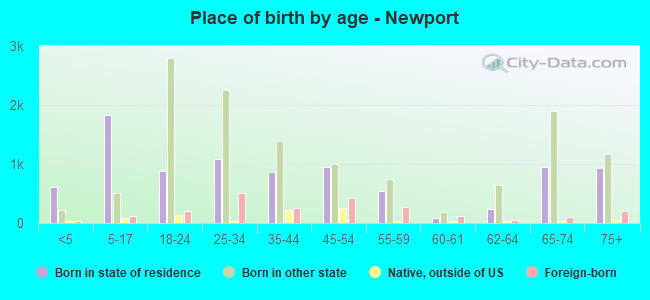
Place of birth - Born in state of residence (%)
Place of birth - Born in state of residence (%) - White
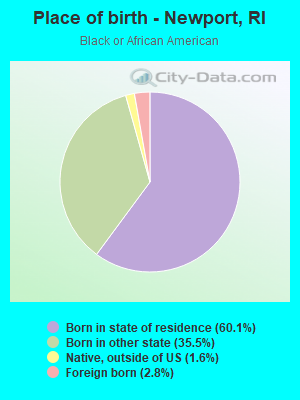
Place of birth - Born in state of residence (%) - Black or African American
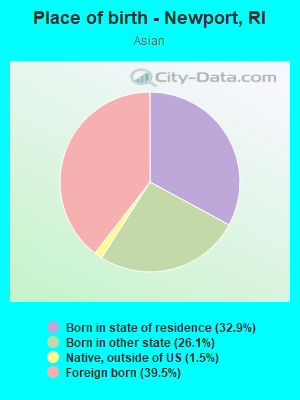
Place of birth - Born in state of residence (%) - Asian
Place of birth - Born in state of residence (%) - Hispanic or Latino
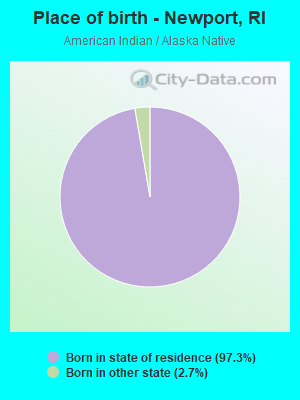
Place of birth - Born in state of residence (%) - American Indian and Alaska Native
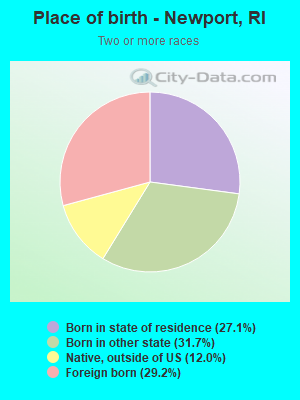
Place of birth - Born in state of residence (%) - Multirace
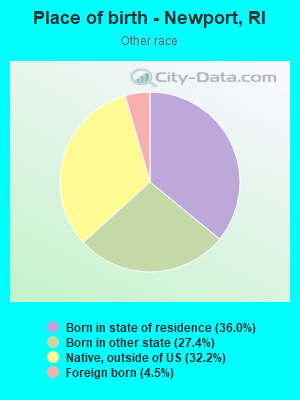
Place of birth - Born in state of residence (%) - Other Race
Place of birth - Born in other state (%)
Place of birth - Born in other state (%) - White
Place of birth - Born in other state (%) - Black or African American
Place of birth - Born in other state (%) - Asian
Place of birth - Born in other state (%) - Hispanic or Latino
Place of birth - Born in other state (%) - American Indian and Alaska Native
Place of birth - Born in other state (%) - Multirace
Place of birth - Born in other state (%) - Other Race
Place of birth - Native, outside of US (%)
Place of birth - Native, outside of US (%) - White
Place of birth - Native, outside of US (%) - Black or African American
Place of birth - Native, outside of US (%) - Asian
Place of birth - Native, outside of US (%) - Hispanic or Latino
Place of birth - Native, outside of US (%) - American Indian and Alaska Native
Place of birth - Native, outside of US (%) - Multirace
Place of birth - Native, outside of US (%) - Other Race
Place of birth - Foreign born (%)
Place of birth - Foreign born (%) - White
Place of birth - Foreign born (%) - Black or African American
Place of birth - Foreign born (%) - Asian
Place of birth - Foreign born (%) - Hispanic or Latino
Place of birth - Foreign born (%) - American Indian and Alaska Native
Place of birth - Foreign born (%) - Multirace
Place of birth - Foreign born (%) - Other Race
Residents speaking English at home (%)
Residents speaking English at home - Born in the United States (%)
Residents speaking English at home - Native, born elsewhere (%)
Residents speaking English at home - Foreign born (%)
Residents speaking Spanish at home (%)
Residents speaking Spanish at home - Born in the United States (%)
Residents speaking Spanish at home - Native, born elsewhere (%)
Residents speaking Spanish at home - Foreign born (%)
Residents speaking other language at home (%)
Residents speaking other language at home - Born in the United States (%)
Residents speaking other language at home - Native, born elsewhere (%)
Residents speaking other language at home - Foreign born (%)
Marital status - Never married (%)
Marital status - Now married (%)
Marital status - Separated (%)
Marital status - Widowed (%)
Marital status - Divorced (%)
Ancestries Reported - Arab (%)
Ancestries Reported - Czech (%)
Ancestries Reported - Danish (%)
Ancestries Reported - Dutch (%)
Ancestries Reported - English (%)
Ancestries Reported - French (%)
Ancestries Reported - French Canadian (%)
Ancestries Reported - German (%)
Ancestries Reported - Greek (%)
Ancestries Reported - Hungarian (%)
Ancestries Reported - Irish (%)
Ancestries Reported - Italian (%)
Ancestries Reported - Lithuanian (%)
Ancestries Reported - Norwegian (%)
Ancestries Reported - Polish (%)
Ancestries Reported - Portuguese (%)
Ancestries Reported - Russian (%)
Ancestries Reported - Scotch-Irish (%)
Ancestries Reported - Scottish (%)
Ancestries Reported - Slovak (%)
Ancestries Reported - Subsaharan African (%)
Ancestries Reported - Swedish (%)
Ancestries Reported - Swiss (%)
Ancestries Reported - Ukrainian (%)
Ancestries Reported - United States (%)
Ancestries Reported - Welsh (%)
Ancestries Reported - West Indian (%)
Ancestries Reported - Other (%)
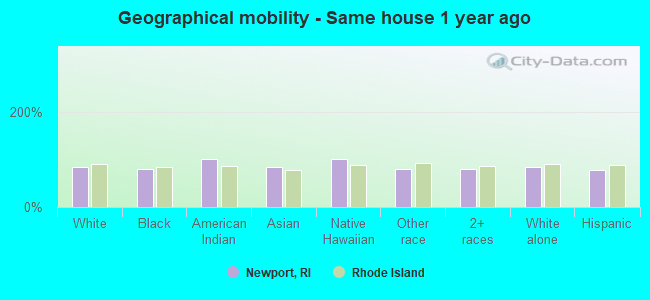
Geographical mobility - Same house 1 year ago (%)
Geographical mobility - Same house 1 year ago (%) - White
Geographical mobility - Same house 1 year ago (%) - Black or African American
Geographical mobility - Same house 1 year ago (%) - Asian
Geographical mobility - Same house 1 year ago (%) - Hispanic or Latino
Geographical mobility - Same house 1 year ago (%) - American Indian and Alaska Native
Geographical mobility - Same house 1 year ago (%) - Multirace
Geographical mobility - Same house 1 year ago (%) - Other Race
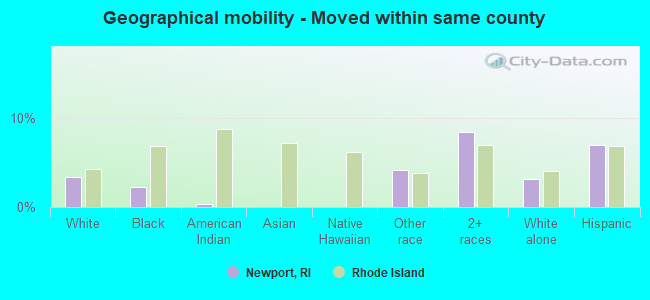
Geographical mobility - Moved within same county (%)
Geographical mobility - Moved within same county (%) - White
Geographical mobility - Moved within same county (%) - Black or African American
Geographical mobility - Moved within same county (%) - Asian
Geographical mobility - Moved within same county (%) - Hispanic or Latino
Geographical mobility - Moved within same county (%) - American Indian and Alaska Native
Geographical mobility - Moved within same county (%) - Multirace
Geographical mobility - Moved within same county (%) - Other Race
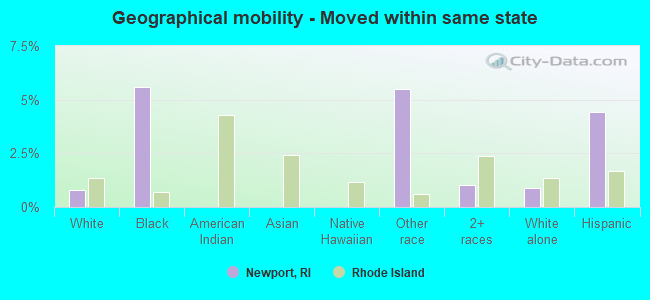
Geographical mobility - Moved from different county within same state (%)
Geographical mobility - Moved from different county within same state (%) - White
Geographical mobility - Moved from different county within same state (%) - Black or African American
Geographical mobility - Moved from different county within same state (%) - Asian
Geographical mobility - Moved from different county within same state (%) - Hispanic or Latino
Geographical mobility - Moved from different county within same state (%) - American Indian and Alaska Native
Geographical mobility - Moved from different county within same state (%) - Multirace
Geographical mobility - Moved from different county within same state (%) - Other Race
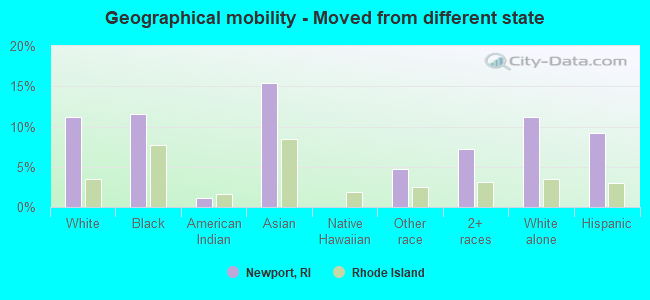
Geographical mobility - Moved from different state (%)
Geographical mobility - Moved from different state (%) - White
Geographical mobility - Moved from different state (%) - Black or African American
Geographical mobility - Moved from different state (%) - Asian
Geographical mobility - Moved from different state (%) - Hispanic or Latino
Geographical mobility - Moved from different state (%) - American Indian and Alaska Native
Geographical mobility - Moved from different state (%) - Multirace
Geographical mobility - Moved from different state (%) - Other Race
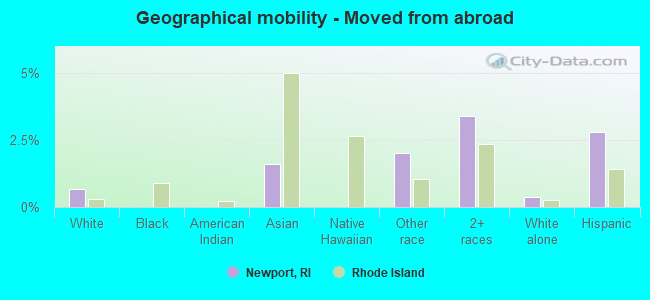
Geographical mobility - Moved from abroad (%)
Geographical mobility - Moved from abroad (%) - White
Geographical mobility - Moved from abroad (%) - Black or African American
Geographical mobility - Moved from abroad (%) - Asian
Geographical mobility - Moved from abroad (%) - Hispanic or Latino
Geographical mobility - Moved from abroad (%) - American Indian and Alaska Native
Geographical mobility - Moved from abroad (%) - Multirace
Geographical mobility - Moved from abroad (%) - Other Race
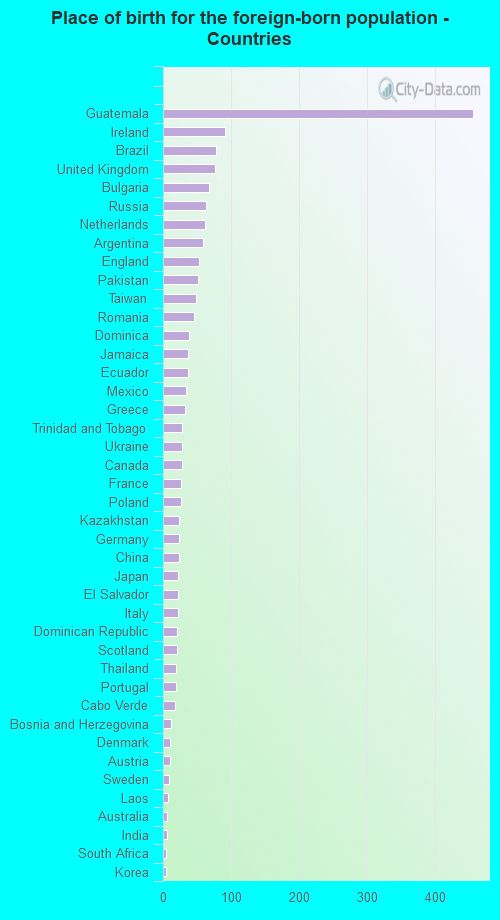
Place of birth for the foreign-born population - Ireland (%)
Place of birth for the foreign-born population - Denmark (%)
Place of birth for the foreign-born population - Norway (%)
Place of birth for the foreign-born population - Sweden (%)
Place of birth for the foreign-born population - United Kingdom (%)
Place of birth for the foreign-born population - England (%)
Place of birth for the foreign-born population - Scotland (%)
Place of birth for the foreign-born population - Other Northern Europe (%)
Place of birth for the foreign-born population - Austria (%)
Place of birth for the foreign-born population - Belgium (%)
Place of birth for the foreign-born population - France (%)
Place of birth for the foreign-born population - Germany (%)
Place of birth for the foreign-born population - Netherlands (%)
Place of birth for the foreign-born population - Switzerland (%)
Place of birth for the foreign-born population - Other Western Europe (%)
Place of birth for the foreign-born population - Greece (%)
Place of birth for the foreign-born population - Italy (%)
Place of birth for the foreign-born population - Portugal (%)
Place of birth for the foreign-born population - Spain (%)
Place of birth for the foreign-born population - Other Southern Europe (%)
Place of birth for the foreign-born population - Albania (%)
Place of birth for the foreign-born population - Belarus (%)
Place of birth for the foreign-born population - Bosnia and Herzegovina (%)
Place of birth for the foreign-born population - Bulgaria (%)
Place of birth for the foreign-born population - Croatia (%)
Place of birth for the foreign-born population - Czechoslovakia (%)
Place of birth for the foreign-born population - Hungary (%)
Place of birth for the foreign-born population - Latvia (%)
Place of birth for the foreign-born population - Lithuania (%)
Place of birth for the foreign-born population - North Macedonia (Macedonia) (%)
Place of birth for the foreign-born population - Moldova (%)
Place of birth for the foreign-born population - Poland (%)
Place of birth for the foreign-born population - Romania (%)
Place of birth for the foreign-born population - Russia (%)
Place of birth for the foreign-born population - Serbia (%)
Place of birth for the foreign-born population - Ukraine (%)
Place of birth for the foreign-born population - Other Eastern Europe (%)
Place of birth for the foreign-born population - China (%)
Place of birth for the foreign-born population - Hong Kong (%)
Place of birth for the foreign-born population - Taiwan (%)
Place of birth for the foreign-born population - Japan (%)
Place of birth for the foreign-born population - Korea (%)
Place of birth for the foreign-born population - Other Eastern Asia (%)
Place of birth for the foreign-born population - Afghanistan (%)
Place of birth for the foreign-born population - Bangladesh (%)
Place of birth for the foreign-born population - India (%)
Place of birth for the foreign-born population - Iran (%)
Place of birth for the foreign-born population - Kazakhstan (%)
Place of birth for the foreign-born population - Nepal (%)
Place of birth for the foreign-born population - Pakistan (%)
Place of birth for the foreign-born population - Sri Lanka (%)
Place of birth for the foreign-born population - Uzbekistan (%)
Place of birth for the foreign-born population - Other South Central Asia (%)
Place of birth for the foreign-born population - Burma (%)
Place of birth for the foreign-born population - Cambodia (%)
Place of birth for the foreign-born population - Indonesia (%)
Place of birth for the foreign-born population - Laos (%)
Place of birth for the foreign-born population - Malaysia (%)
Place of birth for the foreign-born population - Philippines (%)
Place of birth for the foreign-born population - Singapore (%)
Place of birth for the foreign-born population - Thailand (%)
Place of birth for the foreign-born population - Vietnam (%)
Place of birth for the foreign-born population - Other South Eastern Asia (%)
Place of birth for the foreign-born population - Armenia (%)
Place of birth for the foreign-born population - Iraq (%)
Place of birth for the foreign-born population - Israel (%)
Place of birth for the foreign-born population - Jordan (%)
Place of birth for the foreign-born population - Kuwait (%)
Place of birth for the foreign-born population - Lebanon (%)
Place of birth for the foreign-born population - Saudi Arabia (%)
Place of birth for the foreign-born population - Syria (%)
Place of birth for the foreign-born population - Turkey (%)
Place of birth for the foreign-born population - Yemen (%)
Place of birth for the foreign-born population - Other Western Asia (%)
Place of birth for the foreign-born population - Eritrea (%)
Place of birth for the foreign-born population - Ethiopia (%)
Place of birth for the foreign-born population - Kenya (%)
Place of birth for the foreign-born population - Somalia (%)
Place of birth for the foreign-born population - Uganda (%)
Place of birth for the foreign-born population - Zimbabwe (%)
Place of birth for the foreign-born population - Other Eastern Africa (%)
Place of birth for the foreign-born population - Cameroon (%)
Place of birth for the foreign-born population - Congo (%)
Place of birth for the foreign-born population - Democratic Republic of Congo (Zaire) (%)
Place of birth for the foreign-born population - Other Middle Africa (%)
Place of birth for the foreign-born population - Egypt (%)
Place of birth for the foreign-born population - Morocco (%)
Place of birth for the foreign-born population - Sudan (%)
Place of birth for the foreign-born population - Other Northern Africa (%)
Place of birth for the foreign-born population - South Africa (%)
Place of birth for the foreign-born population - Other Southern Africa (%)
Place of birth for the foreign-born population - Cabo Verde (%)
Place of birth for the foreign-born population - Ghana (%)
Place of birth for the foreign-born population - Liberia (%)
Place of birth for the foreign-born population - Nigeria (%)
Place of birth for the foreign-born population - Senegal (%)
Place of birth for the foreign-born population - Sierra Leone (%)
Place of birth for the foreign-born population - Other Western Africa (%)
Place of birth for the foreign-born population - Australia (%)
Place of birth for the foreign-born population - New Zealand (%)
Place of birth for the foreign-born population - Fiji (%)
Place of birth for the foreign-born population - Micronesia (%)
Place of birth for the foreign-born population - Bahamas (%)
Place of birth for the foreign-born population - Barbados (%)
Place of birth for the foreign-born population - Cuba (%)
Place of birth for the foreign-born population - Dominica (%)
Place of birth for the foreign-born population - Dominican Republic (%)
Place of birth for the foreign-born population - Grenada (%)
Place of birth for the foreign-born population - Haiti (%)
Place of birth for the foreign-born population - Jamaica (%)
Place of birth for the foreign-born population - St. Vincent and the Grenadines (%)
Place of birth for the foreign-born population - Trinidad and Tobago (%)
Place of birth for the foreign-born population - West Indies (%)
Place of birth for the foreign-born population - Other Caribbean (%)
Place of birth for the foreign-born population - Belize (%)
Place of birth for the foreign-born population - Costa Rica (%)
Place of birth for the foreign-born population - El Salvador (%)
Place of birth for the foreign-born population - Guatemala (%)
Place of birth for the foreign-born population - Honduras (%)
Place of birth for the foreign-born population - Mexico (%)
Place of birth for the foreign-born population - Nicaragua (%)
Place of birth for the foreign-born population - Panama (%)
Place of birth for the foreign-born population - Other Central America (%)
Place of birth for the foreign-born population - Argentina (%)
Place of birth for the foreign-born population - Bolivia (%)
Place of birth for the foreign-born population - Brazil (%)
Place of birth for the foreign-born population - Chile (%)
Place of birth for the foreign-born population - Colombia (%)
Place of birth for the foreign-born population - Ecuador (%)
Place of birth for the foreign-born population - Guyana (%)
Place of birth for the foreign-born population - Peru (%)
Place of birth for the foreign-born population - Uruguay (%)
Place of birth for the foreign-born population - Venezuela (%)
Place of birth for the foreign-born population - Other South America (%)
Place of birth for the foreign-born population - Canada (%)
Place of birth for the foreign-born population - Other Northern America (%)
Place of birth for the foreign-born population - Other (%)
Latest news about races in Newport, RI collected exclusively by city-data.com from local newspapers, TV, and radio stations
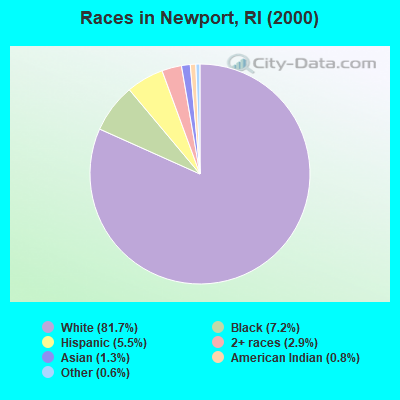
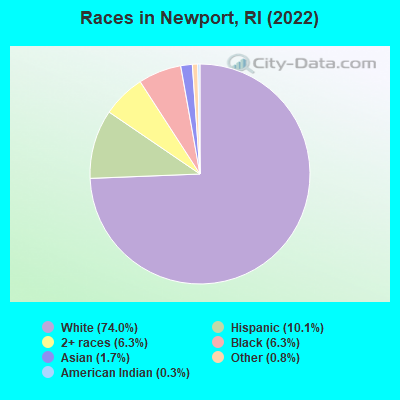
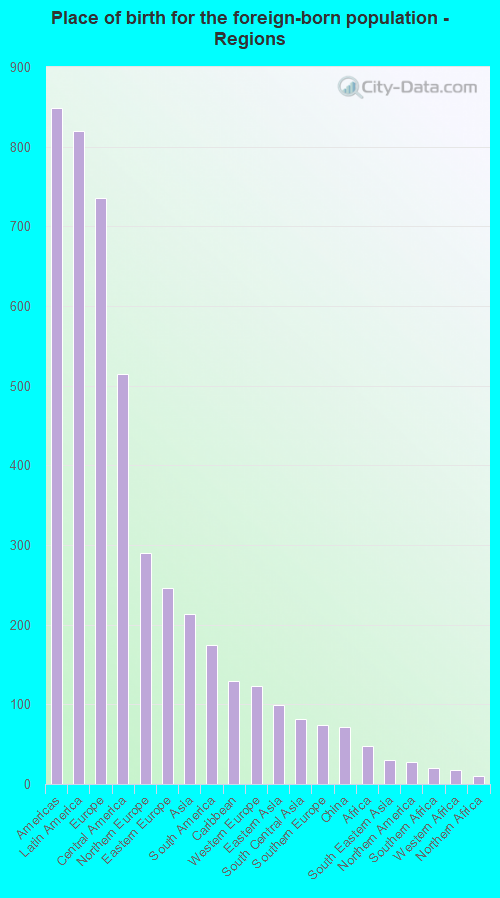
According to 2022 data, the most numerous races in Newport, RI are White alone (18,547 residents), Hispanic (2,528 residents), and Two or more races (1,580 residents). 87.1% of Newport residents speak English at home. 7.5% of Newport, RI residents are foreign-born (3.2% born in Latin America, 2.9% born in Europe, 0.8% born in Asia), which is 87.5% less than the foreign-born rate of 14.0% across the entire state of Rhode Island.
Race distribution in Newport
2000 2022
858,433 81.9% White alone 90,820 8.7% Hispanic 41,922 4.0% Black alone 23,416 2.2% Asian alone 20,816 2.0% Two or more races 8,411 0.8% Other race alone 4,181 0.4% American Indian alone 320 0.03% Native Hawaiian and Other
745,825 68.2% White alone 191,979 17.6% Hispanic 56,738 5.2% Two or more races 51,326 4.7% Black alone 37,234 3.4% Asian alone 9,514 0.9% Other race alone 978 0.09% American Indian alone 140 0.01% Native Hawaiian and Other
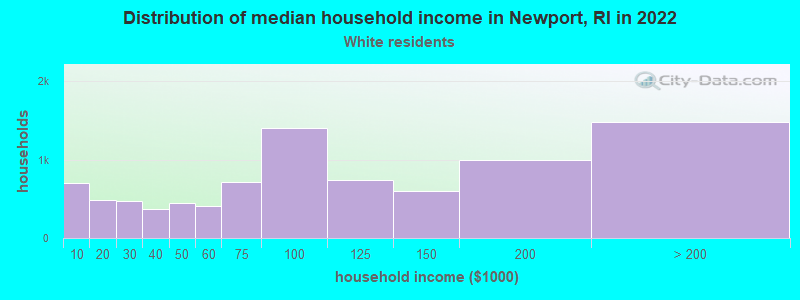
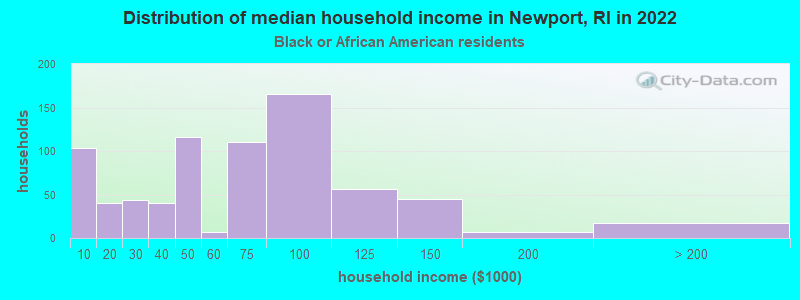
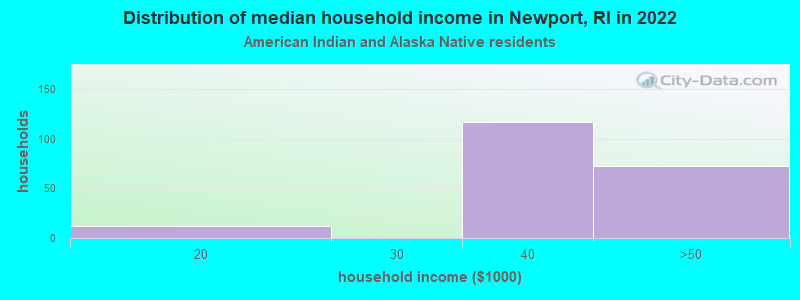
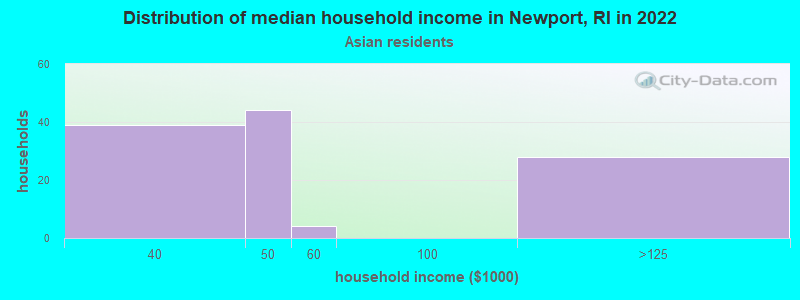
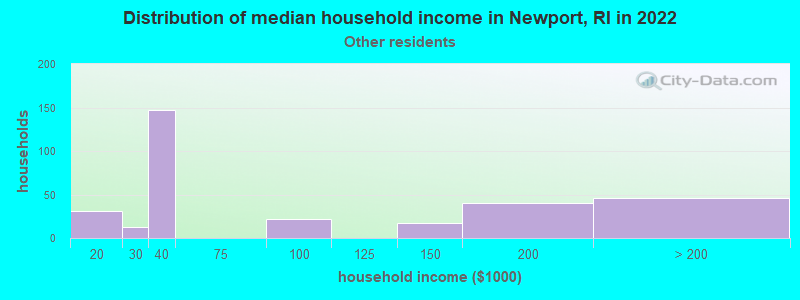
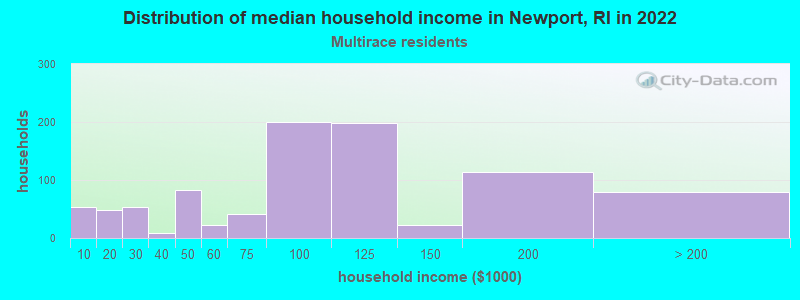
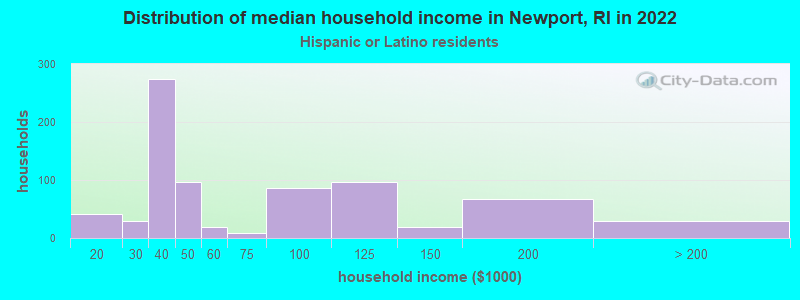
Income and house value in Newport Median household income in 2022 $84,572 White non-Hispanic householders$57,765 Black householders$49,585 American Indian and Alaska Native householders$47,025 Asian householders$35,990 Some other race householders$98,652 Two or more races householders$68,597 Hispanic or Latino race householdersMedian 2022 house value $751,134 White Non-Hispanic householders$543,071 Black or African American householders$744,718 American Indian or Alaska Native householders $523,823 Asian householders$744,718 Native Hawaiian and other Pacific Islander householders$888,162 Some other race householders$596,691 Two or more races householders$695,681 Hispanic or Latino householders
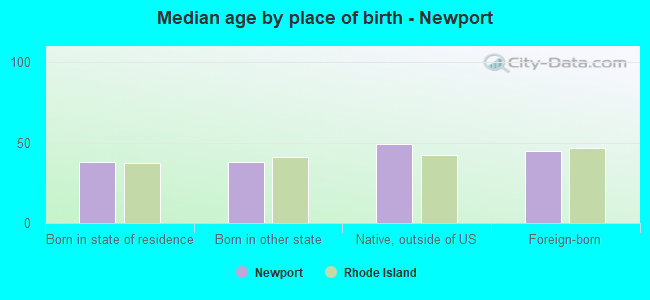
Median age by race in Newport
44.6 Median age for White residents45.2 44.2 30.7 Median age for Black or African American residents24.4 39.2 24.3 Median age for American Indian / Alaska Native residents5.1 33.9 26.6 Median age for Asian residents23.6 26.2 16.7 Median age for Native Hawaiian / Pacific Islander residents-666,666,666.0 -666,666,666.0 29.6 Median age for Other race residents27.2 40.4 31.9 Median age for Two or more races residents29.8 32.9 44.7 Median age for White alone residents45.2 44.2 27.5 Median age for Hispanic or Latino residents23.8 31.6
Owner/renter occupied households by race in Newport
House owners and renters - White residents 4,834 54.9% Owner occupied3,973 45.1% Renter occupiedHouse owners and renters - Black or African American residents 121 24.4% Owner occupied374 75.6% Renter occupiedHouse owners and renters - American Indian / Alaska Native residents 156 100.0% Renter occupiedHouse owners and renters - Asian residents 110 81.2% Owner occupied26 18.8% Renter occupiedHouse owners and renters - Native Hawaiian / Pacific Islander residents 69 100.0% Renter occupiedHouse owners and renters - Other race residents 64 17.1% Owner occupied310 82.9% Renter occupiedHouse owners and renters - Two or more races residents 289 29.4% Owner occupied695 70.6% Renter occupiedHouse owners and renters - White alone residents 4,840 54.8% Owner occupied3,998 45.2% Renter occupiedHouse owners and renters - Hispanic or Latino residents 148 25.2% Owner occupied439 74.8% Renter occupied
Language usage in Newport
English speakers - Total 87.1% of residents of Newport speak English at home.
6.4% of residents speak Spanish at home 990 64.5% Speak English very well546 35.5% Speak English less than very well6.2% of residents speak other language at home 1,036 69.8% Speak English very well448 30.2% Speak English less than very well
English speakers - Born in the United States 96.3% of residents of Newport speak English at home.
2.4% of residents speak Spanish at home 280 94.6% Speak English very well16 5.4% Speak English less than very well1.7% of residents speak other language at home 145 67.4% Speak English very well70 32.6% Speak English less than very well
English speakers - Native, born elsewhere 18.1% of residents of Newport speak English at home.
94.7% of residents speak Spanish at home 301 40.2% Speak English very well447 59.8% Speak English less than very well2.5% of residents speak other language at home 20 100.0% Speak English very well
English speakers - Foreign-born 23.6% of residents of Newport speak English at home.
22.5% of residents speak Spanish at home 329 62.3% Speak English very well199 37.7% Speak English less than very well45.8% of residents speak other language at home 736 68.6% Speak English very well337 31.4% Speak English less than very well
White (Caucasian) - Speak only English Native:
97.2% (16,558)Foreign-born:
28.3% (345)
White (Caucasian) - Speak another language Native:
2.7% (466)Foreign-born:
70.5% (859)
Black or African American - Speak only English Native:
98.9% (1,526)Foreign-born:
91.3% (95)
Black or African American - Speak another language Native:
1.5% (23)Foreign-born:
28.3% (29)
Asian - Speak only English Native:
98.2% (267)Foreign-born:
27.6% (95)
Asian - Speak another language Native:
22.1% (60)Foreign-born:
74.7% (258)
Other race - Speak another language Native:
41.0% (327)Foreign-born:
97.9% (40)
Two or more races - Speak only English Native:
79.1% (1,686)Foreign-born:
11.0% (66)
Two or more races - Speak another language Native:
20.5% (436)Foreign-born:
89.4% (534)
White alone - Speak only English Native:
97.6% (16,446)Foreign-born:
29.6% (345)
White alone - Speak another language Native:
2.4% (406)Foreign-born:
67.6% (789)
Hispanic or Latino - Speak only English Native:
32.8% (519)Foreign-born:
3.0% (16)
Hispanic or Latino - Speak another language Native:
66.7% (1,053)Foreign-born:
96.1% (523)
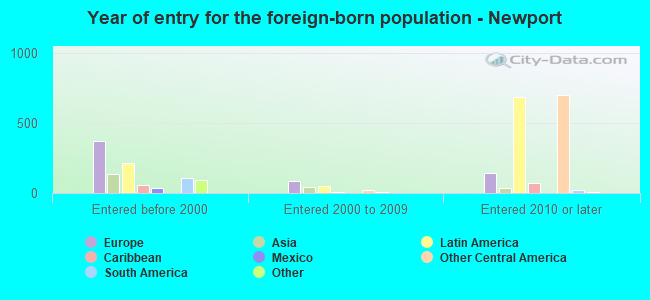
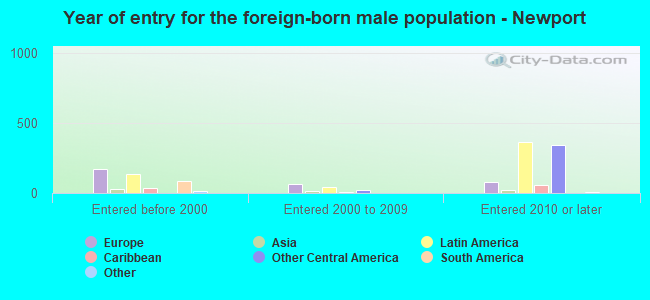
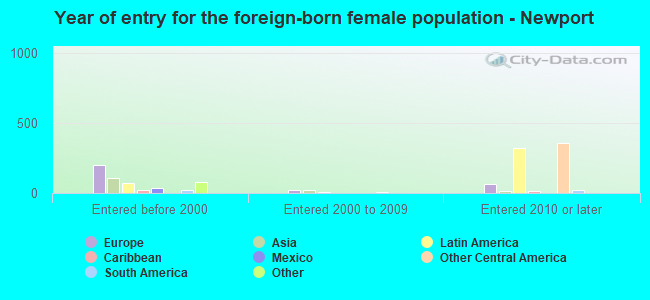
Foreign-born residents in Newport 1,852 residents are foreign born (3.2% Latin America , 2.9% Europe , 0.8% Asia ).
This city:
7.5%Rhode Island:
14.4%
Marital status for residents in Newport Marital status - White (Caucasian) population 15 years and over
Males 44.6% Never married40.7% Now married1.2% Separated2.8% Widowed10.7% DivorcedFemales 43.9% Never married33.0% Now married1.2% Separated9.4% Widowed12.5% DivorcedWomen who gave birth in the past 12 months Now married:
31.7% (40)Unmarried:
68.3% (87)
Women who did not give birth in the past 12 months Now married:
19.4% (895)Unmarried:
80.6% (3,720)
Marital status - Black or African American population 15 years and over
Males 60.1% Never married25.8% Now married2.7% Separated1.4% Widowed10.1% DivorcedFemales 56.2% Never married25.3% Now married4.0% Separated3.0% Widowed11.5% DivorcedWomen who gave birth in the past 12 months Now married:
0.0% (0)Unmarried:
100.0% (48)
Women who did not give birth in the past 12 months Now married:
28.7% (87)Unmarried:
71.3% (216)
Marital status - American Indian / Alaska Native population 15 years and over
Males 50.0% Never married0.0% Now married50.0% Separated0.0% Widowed0.0% DivorcedFemales 100.0% Never married0.0% Now married0.0% Separated0.0% Widowed0.0% DivorcedWomen who did not give birth in the past 12 months Now married:
0.0% (0)Unmarried:
100.0% (183)
Marital status - Asian population 15 years and over
Males 51.7% Never married30.9% Now married0.0% Separated0.0% Widowed17.4% DivorcedFemales 35.3% Never married46.8% Now married18.0% Separated0.0% Widowed0.0% DivorcedWomen who did not give birth in the past 12 months Now married:
46.2% (47)Unmarried:
53.8% (55)
Marital status - Other race population 15 years and over
Males 62.1% Never married30.1% Now married5.1% Separated2.8% Widowed0.0% DivorcedFemales 58.9% Never married27.5% Now married0.0% Separated0.0% Widowed13.6% DivorcedWomen who gave birth in the past 12 months Now married:
0.0% (0)Unmarried:
100.0% (30)
Women who did not give birth in the past 12 months Now married:
24.1% (44)Unmarried:
75.9% (140)
Marital status - Two or more races population 15 years and over
Males 64.1% Never married29.4% Now married0.0% Separated0.0% Widowed6.5% DivorcedFemales 45.4% Never married42.9% Now married0.0% Separated2.8% Widowed8.9% DivorcedWomen who gave birth in the past 12 months Now married:
61.9% (19)Unmarried:
38.1% (12)
Women who did not give birth in the past 12 months Now married:
40.5% (306)Unmarried:
59.5% (449)
Marital status - White alone, not Hispanic / Latino population 15 years and over
Males 44.5% Never married40.9% Now married1.3% Separated2.8% Widowed10.4% DivorcedFemales 43.1% Never married33.9% Now married1.2% Separated8.9% Widowed13.0% DivorcedWomen who gave birth in the past 12 months Now married:
62.1% (34)Unmarried:
37.9% (21)
Women who did not give birth in the past 12 months Now married:
20.3% (928)Unmarried:
79.7% (3,634)
Marital status - Hispanic or Latino population 15 years and over
Males 65.8% Never married28.7% Now married0.0% Separated0.5% Widowed5.1% DivorcedFemales 61.8% Never married23.7% Now married2.4% Separated8.4% Widowed3.7% DivorcedWomen who gave birth in the past 12 months Now married:
7.5% (8)Unmarried:
92.5% (102)
Women who did not give birth in the past 12 months Now married:
21.3% (165)Unmarried:
78.7% (610)
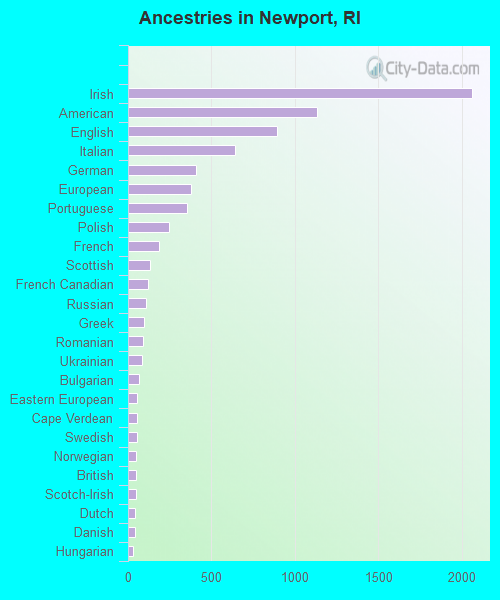
Ancestries in Newport
2,060 18.6% Irish1,133 10.2% American894 8.1% English644 5.8% Italian409 3.7% German377 3.4% European352 3.2% Portuguese248 2.2% Polish187 1.7% French133 1.2% Scottish122 1.1% French Canadian106 1.0% Russian95 0.9% Greek88 0.8% Romanian84 0.8% Ukrainian65 0.6% Bulgarian55 0.5% Eastern European51 0.5% Cape Verdean51 0.5% Swedish50 0.5% Norwegian48 0.4% British47 0.4% Scotch-Irish43 0.4% Dutch40 0.4% Danish29 0.3% Hungarian28 0.3% Northern European27 0.2% Australian25 0.2% Czech23 0.2% Brazilian22 0.2% Armenian20 0.2% Scandinavian19 0.2% Austrian16 0.1% Welsh16 0.1% Trinidadian and Tobagonian14 0.1% Syrian13 0.1% Lithuanian11 0.10% Croatian8 0.07% Haitian7 0.06% Canadian7 0.06% Jamaican6 0.05% Swiss5 0.05% Lebanese3 0.03% Albanian2 0.02% British West Indian1 0.01% Barbadian
Geographical mobility in Newport Same house 1 year ago 15,503 83.1% White (Caucasian)1,240 78.6% Black or African American288 100.0% American Indian / Alaska Native358 83.6% Asian218 100.0% Native Hawaiian / Pacific Islander662 78.5% Other race2,214 78.8% Two or more races15,336 83.2% White alone, not Hispanic / Latino1,916 77.4% Hispanic or LatinoMoved within same county 630 3.4% White / Caucasian35 2.2% Black or African American1 0.3% American Indian / Alaska Native35 4.2% Other race236 8.4% Two or more races582 3.2% White alone, not Hispanic / Latino171 6.9% Hispanic or LatinoMoved within same state 146 0.8% White / Caucasian89 5.6% Black or African American47 5.5% Other race29 1.0% Two or more races166 0.9% White alone, not Hispanic / Latino110 4.4% Hispanic or LatinoMoved from different state 2,081 11.2% White / Caucasian182 11.6% Black or African American3 1.1% American Indian / Alaska Native66 15.4% Asian40 4.8% Other race203 7.2% Two or more races2,069 11.2% White alone, not Hispanic / Latino228 9.2% Hispanic or LatinoMoved from abroad 123 0.7% White7 1.6% Asian17 2.0% Other race95 3.4% Two or more races68 0.4% White alone, not Hispanic / Latino69 2.8% Hispanic or Latino
Children Nativity (place of birth) in Newport
Children under 6 years - Living with two parents Both parents native 398 100.0% NativeBoth parents foreign-born 28 100.0% NativeOne native, one foreign-born parent 33 100.0% NativeChildren under 6 years - Living with one parent Native parent 455 100.0% NativeForeign-born parent 10 100.0% NativeChildren 6 to 17 years - Living with two parents Both parents native 1,040 100.0% NativeBoth parents foreign-born 94 65.5% Native49 34.5% Foreign-bornOne native, one foreign-born parent 160 100.0% NativeChildren 6 to 17 years - Living with one parent Native parent 1,071 100.0% NativeForeign-born parent 46 51.3% Native44 48.7% Foreign-born
Grandparents responsible for own grandchildren in Newport
Grandparents (30 to 59 years) White / Caucasian 6 22.2% Responsible for grandchildren23 77.8% Not responsible for grandchildrenWhite alone, not Hispanic / Latino 8 23.7% Responsible for grandchildren25 76.3% Not responsible for grandchildrenGrandparents (60 years and over) White / Caucasian 15 19.4% Responsible for grandchildren64 80.6% Not responsible for grandchildrenWhite alone, not Hispanic / Latino 16 23.2% Responsible for grandchildren54 76.8% Not responsible for grandchildren