Races in Newstead, New York (NY) Detailed Stats
Ancestries, Foreign-born residents, place of birth
1.7% of Newstead, NY residents are foreign-born , which is 1166.4% less than the foreign-born rate of 22.0% across the entire state of New York.
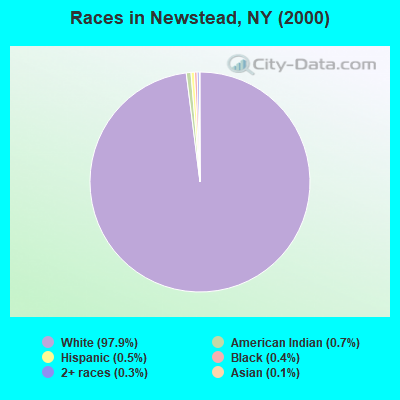
Race distribution in Newstead

- 8,22597.9%White alone
- 610.7%American Indian alone
- 440.5%Hispanic
- 340.4%Black alone
- 280.3%Two or more races
- 100.1%Asian alone
- 20.02%Other race alone
2000
2022
-
- 11,760,98162.0%White alone
- 2,867,58315.1%Hispanic
- 2,812,62314.8%Black alone
- 1,035,9265.5%Asian alone
- 366,1161.9%Two or more races
- 75,4990.4%Other race alone
- 52,4990.3%American Indian alone
- 5,2300.03%Native Hawaiian and Other
Pacific Islander alone

-
- 10,408,93352.9%White alone
- 3,867,29919.7%Hispanic
- 2,633,84013.4%Black alone
- 1,776,2869.0%Asian alone
- 732,6703.7%Two or more races
- 216,1101.1%Other race alone
- 35,0820.2%American Indian alone
- 6,9310.04%Native Hawaiian and Other
Pacific Islander alone

Income and house value in Newstead
- Median household income in 2022
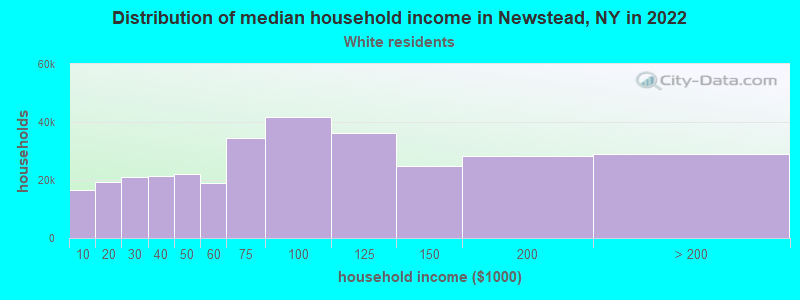
- $75,134White non-Hispanic householders
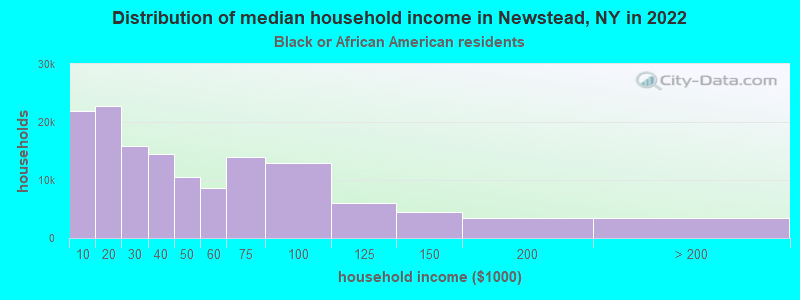
- $99,522Black householders
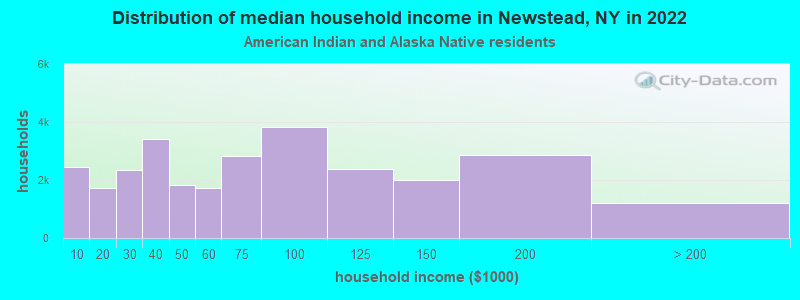
- $81,770American Indian and Alaska Native householders
- $67,052Some other race householders
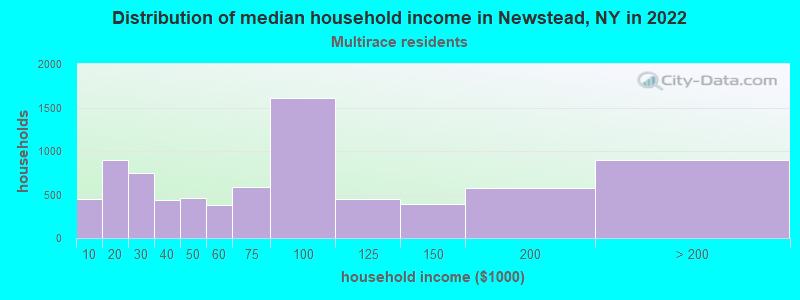
- $40,167Two or more races householders
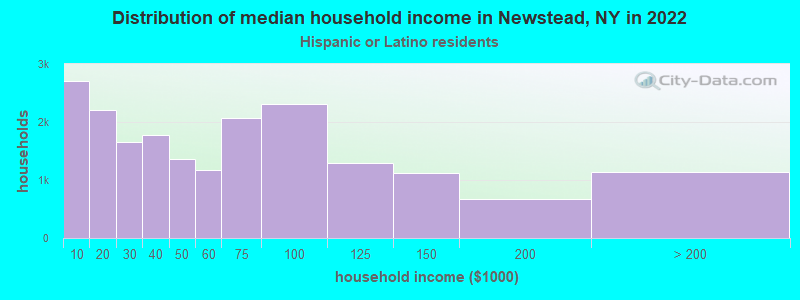
- $51,154Hispanic or Latino race householders
- Median 2022 house value
- $252,201White Non-Hispanic householders
- $191,836Black or African American householders
- $242,993American Indian or Alaska Native householders
- $115,102Two or more races householders
Household income for White non-Hispanic householders
Household income for Black householders
Household income for American Indian and Alaska Native householders
Household income for Two or more races householders
Household income for Hispanic or Latino race householders
Foreign-born residents in Newstead
146 residents are foreign born
| This city: | 1.7% |
| New York: | 20.4% |
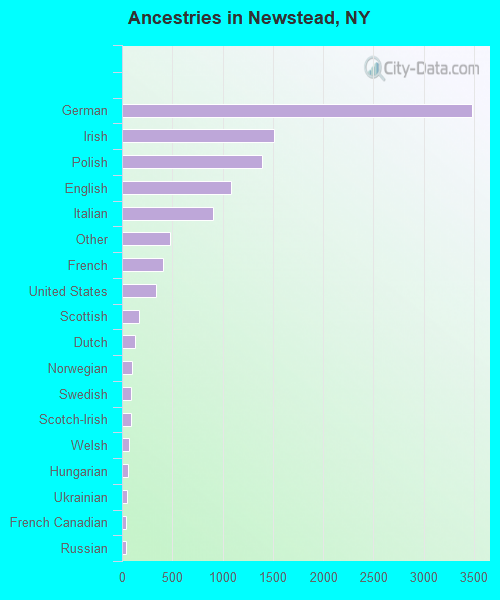
Ancestries in Newstead

- 3,47733.0%German
- 1,51514.4%Irish
- 1,39613.3%Polish
- 1,08910.3%English
- 9048.6%Italian
- 4814.6%Other
- 4063.9%French
- 3373.2%United States
- 1701.6%Scottish
- 1301.2%Dutch
- 950.9%Norwegian
- 940.9%Swedish
- 860.8%Scotch-Irish
- 650.6%Welsh
- 600.6%Hungarian
- 520.5%Ukrainian
- 430.4%French Canadian
- 390.4%Russian
- 310.3%Arab
- 160.2%Danish
- 150.1%Czech
- 130.1%Subsaharan African
- 90.09%Swiss
- 60.06%Greek
Zip codes: 14001.