Races in Newton, Iowa (IA) Detailed Stats
Data:
Races - White alone (%)
Races - White alone (% change since 2000)
Races - Black alone (%)
Races - Black alone (% change since 2000)
Races - American Indian alone (%)
Races - American Indian alone (% change since 2000)
Races - Asian alone (%)
Races - Asian alone (% change since 2000)
Races - Hispanic (%)
Races - Hispanic (% change since 2000)
Races - Native Hawaiian and Other Pacific Islander alone (%)
Races - Native Hawaiian and Other Pacific Islander alone (% change since 2000)
Races - Two or more races(%)
Races - Two or more races(% change since 2000)
Races - Other race alone (%)
Races - Other race alone (% change since 2000)
Racial diversity
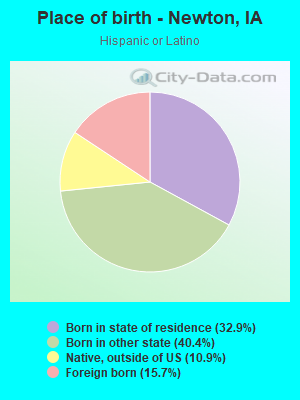
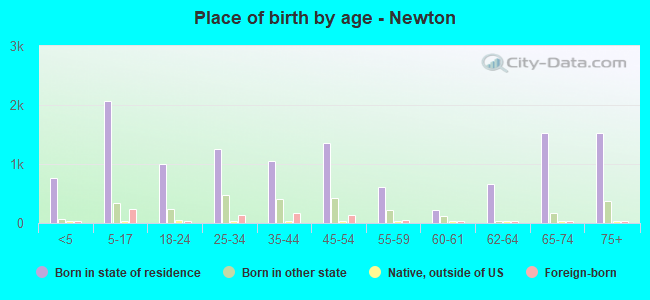
Place of birth - Born in state of residence (%)
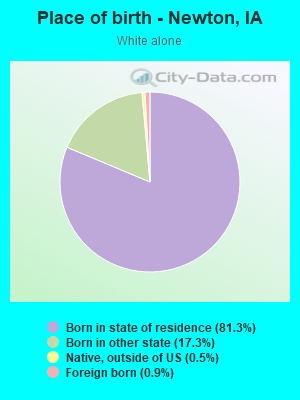
Place of birth - Born in state of residence (%) - White
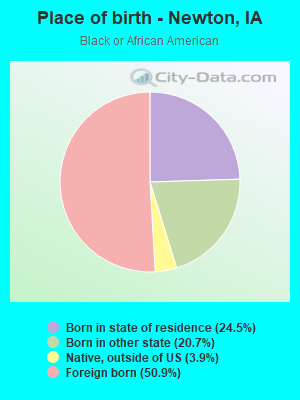
Place of birth - Born in state of residence (%) - Black or African American
Place of birth - Born in state of residence (%) - Asian
Place of birth - Born in state of residence (%) - Hispanic or Latino
Place of birth - Born in state of residence (%) - American Indian and Alaska Native
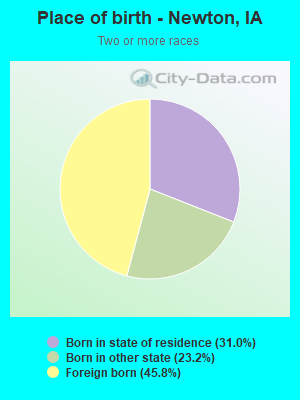
Place of birth - Born in state of residence (%) - Multirace
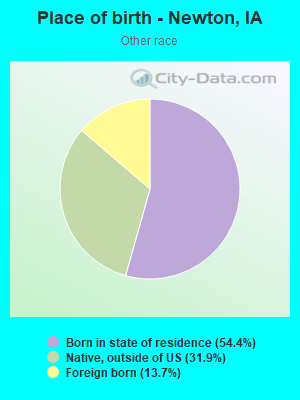
Place of birth - Born in state of residence (%) - Other Race
Place of birth - Born in other state (%)
Place of birth - Born in other state (%) - White
Place of birth - Born in other state (%) - Black or African American
Place of birth - Born in other state (%) - Asian
Place of birth - Born in other state (%) - Hispanic or Latino
Place of birth - Born in other state (%) - American Indian and Alaska Native
Place of birth - Born in other state (%) - Multirace
Place of birth - Born in other state (%) - Other Race
Place of birth - Native, outside of US (%)
Place of birth - Native, outside of US (%) - White
Place of birth - Native, outside of US (%) - Black or African American
Place of birth - Native, outside of US (%) - Asian
Place of birth - Native, outside of US (%) - Hispanic or Latino
Place of birth - Native, outside of US (%) - American Indian and Alaska Native
Place of birth - Native, outside of US (%) - Multirace
Place of birth - Native, outside of US (%) - Other Race
Place of birth - Foreign born (%)
Place of birth - Foreign born (%) - White
Place of birth - Foreign born (%) - Black or African American
Place of birth - Foreign born (%) - Asian
Place of birth - Foreign born (%) - Hispanic or Latino
Place of birth - Foreign born (%) - American Indian and Alaska Native
Place of birth - Foreign born (%) - Multirace
Place of birth - Foreign born (%) - Other Race
Residents speaking English at home (%)
Residents speaking English at home - Born in the United States (%)
Residents speaking English at home - Native, born elsewhere (%)
Residents speaking English at home - Foreign born (%)
Residents speaking Spanish at home (%)
Residents speaking Spanish at home - Born in the United States (%)
Residents speaking Spanish at home - Native, born elsewhere (%)
Residents speaking Spanish at home - Foreign born (%)
Residents speaking other language at home (%)
Residents speaking other language at home - Born in the United States (%)
Residents speaking other language at home - Native, born elsewhere (%)
Residents speaking other language at home - Foreign born (%)
Marital status - Never married (%)
Marital status - Now married (%)
Marital status - Separated (%)
Marital status - Widowed (%)
Marital status - Divorced (%)
Ancestries Reported - Arab (%)
Ancestries Reported - Czech (%)
Ancestries Reported - Danish (%)
Ancestries Reported - Dutch (%)
Ancestries Reported - English (%)
Ancestries Reported - French (%)
Ancestries Reported - French Canadian (%)
Ancestries Reported - German (%)
Ancestries Reported - Greek (%)
Ancestries Reported - Hungarian (%)
Ancestries Reported - Irish (%)
Ancestries Reported - Italian (%)
Ancestries Reported - Lithuanian (%)
Ancestries Reported - Norwegian (%)
Ancestries Reported - Polish (%)
Ancestries Reported - Portuguese (%)
Ancestries Reported - Russian (%)
Ancestries Reported - Scotch-Irish (%)
Ancestries Reported - Scottish (%)
Ancestries Reported - Slovak (%)
Ancestries Reported - Subsaharan African (%)
Ancestries Reported - Swedish (%)
Ancestries Reported - Swiss (%)
Ancestries Reported - Ukrainian (%)
Ancestries Reported - United States (%)
Ancestries Reported - Welsh (%)
Ancestries Reported - West Indian (%)
Ancestries Reported - Other (%)
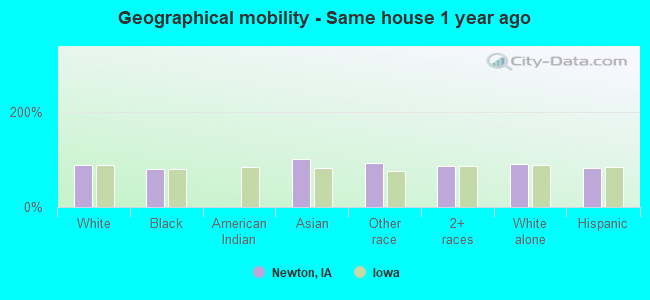
Geographical mobility - Same house 1 year ago (%)
Geographical mobility - Same house 1 year ago (%) - White
Geographical mobility - Same house 1 year ago (%) - Black or African American
Geographical mobility - Same house 1 year ago (%) - Asian
Geographical mobility - Same house 1 year ago (%) - Hispanic or Latino
Geographical mobility - Same house 1 year ago (%) - American Indian and Alaska Native
Geographical mobility - Same house 1 year ago (%) - Multirace
Geographical mobility - Same house 1 year ago (%) - Other Race
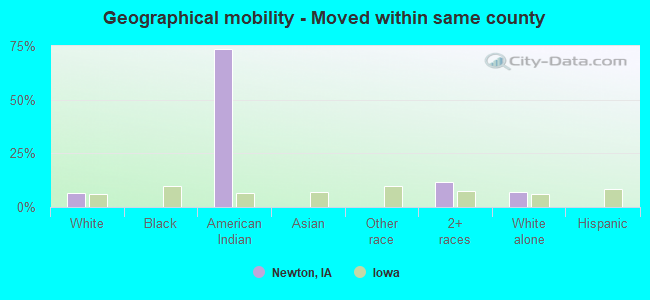
Geographical mobility - Moved within same county (%)
Geographical mobility - Moved within same county (%) - White
Geographical mobility - Moved within same county (%) - Black or African American
Geographical mobility - Moved within same county (%) - Asian
Geographical mobility - Moved within same county (%) - Hispanic or Latino
Geographical mobility - Moved within same county (%) - American Indian and Alaska Native
Geographical mobility - Moved within same county (%) - Multirace
Geographical mobility - Moved within same county (%) - Other Race
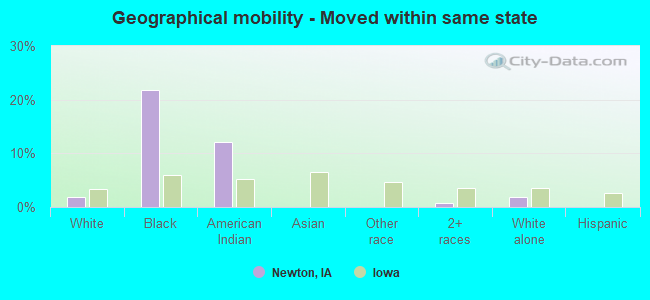
Geographical mobility - Moved from different county within same state (%)
Geographical mobility - Moved from different county within same state (%) - White
Geographical mobility - Moved from different county within same state (%) - Black or African American
Geographical mobility - Moved from different county within same state (%) - Asian
Geographical mobility - Moved from different county within same state (%) - Hispanic or Latino
Geographical mobility - Moved from different county within same state (%) - American Indian and Alaska Native
Geographical mobility - Moved from different county within same state (%) - Multirace
Geographical mobility - Moved from different county within same state (%) - Other Race
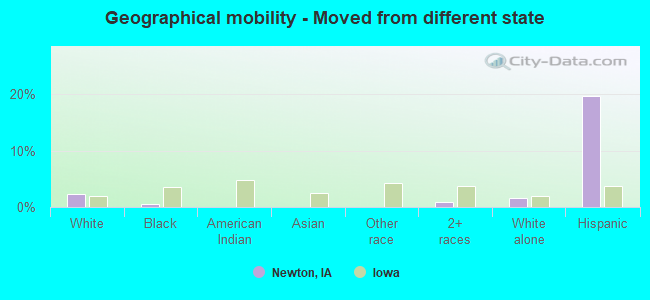
Geographical mobility - Moved from different state (%)
Geographical mobility - Moved from different state (%) - White
Geographical mobility - Moved from different state (%) - Black or African American
Geographical mobility - Moved from different state (%) - Asian
Geographical mobility - Moved from different state (%) - Hispanic or Latino
Geographical mobility - Moved from different state (%) - American Indian and Alaska Native
Geographical mobility - Moved from different state (%) - Multirace
Geographical mobility - Moved from different state (%) - Other Race
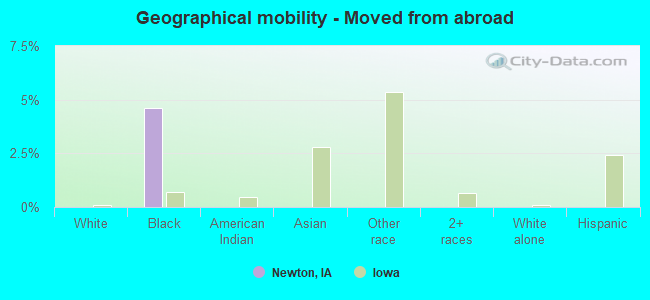
Geographical mobility - Moved from abroad (%)
Geographical mobility - Moved from abroad (%) - White
Geographical mobility - Moved from abroad (%) - Black or African American
Geographical mobility - Moved from abroad (%) - Asian
Geographical mobility - Moved from abroad (%) - Hispanic or Latino
Geographical mobility - Moved from abroad (%) - American Indian and Alaska Native
Geographical mobility - Moved from abroad (%) - Multirace
Geographical mobility - Moved from abroad (%) - Other Race
Place of birth for the foreign-born population - Ireland (%)
Place of birth for the foreign-born population - Denmark (%)
Place of birth for the foreign-born population - Norway (%)
Place of birth for the foreign-born population - Sweden (%)
Place of birth for the foreign-born population - United Kingdom (%)
Place of birth for the foreign-born population - England (%)
Place of birth for the foreign-born population - Scotland (%)
Place of birth for the foreign-born population - Other Northern Europe (%)
Place of birth for the foreign-born population - Austria (%)
Place of birth for the foreign-born population - Belgium (%)
Place of birth for the foreign-born population - France (%)
Place of birth for the foreign-born population - Germany (%)
Place of birth for the foreign-born population - Netherlands (%)
Place of birth for the foreign-born population - Switzerland (%)
Place of birth for the foreign-born population - Other Western Europe (%)
Place of birth for the foreign-born population - Greece (%)
Place of birth for the foreign-born population - Italy (%)
Place of birth for the foreign-born population - Portugal (%)
Place of birth for the foreign-born population - Spain (%)
Place of birth for the foreign-born population - Other Southern Europe (%)
Place of birth for the foreign-born population - Albania (%)
Place of birth for the foreign-born population - Belarus (%)
Place of birth for the foreign-born population - Bosnia and Herzegovina (%)
Place of birth for the foreign-born population - Bulgaria (%)
Place of birth for the foreign-born population - Croatia (%)
Place of birth for the foreign-born population - Czechoslovakia (%)
Place of birth for the foreign-born population - Hungary (%)
Place of birth for the foreign-born population - Latvia (%)
Place of birth for the foreign-born population - Lithuania (%)
Place of birth for the foreign-born population - North Macedonia (Macedonia) (%)
Place of birth for the foreign-born population - Moldova (%)
Place of birth for the foreign-born population - Poland (%)
Place of birth for the foreign-born population - Romania (%)
Place of birth for the foreign-born population - Russia (%)
Place of birth for the foreign-born population - Serbia (%)
Place of birth for the foreign-born population - Ukraine (%)
Place of birth for the foreign-born population - Other Eastern Europe (%)
Place of birth for the foreign-born population - China (%)
Place of birth for the foreign-born population - Hong Kong (%)
Place of birth for the foreign-born population - Taiwan (%)
Place of birth for the foreign-born population - Japan (%)
Place of birth for the foreign-born population - Korea (%)
Place of birth for the foreign-born population - Other Eastern Asia (%)
Place of birth for the foreign-born population - Afghanistan (%)
Place of birth for the foreign-born population - Bangladesh (%)
Place of birth for the foreign-born population - India (%)
Place of birth for the foreign-born population - Iran (%)
Place of birth for the foreign-born population - Kazakhstan (%)
Place of birth for the foreign-born population - Nepal (%)
Place of birth for the foreign-born population - Pakistan (%)
Place of birth for the foreign-born population - Sri Lanka (%)
Place of birth for the foreign-born population - Uzbekistan (%)
Place of birth for the foreign-born population - Other South Central Asia (%)
Place of birth for the foreign-born population - Burma (%)
Place of birth for the foreign-born population - Cambodia (%)
Place of birth for the foreign-born population - Indonesia (%)
Place of birth for the foreign-born population - Laos (%)
Place of birth for the foreign-born population - Malaysia (%)
Place of birth for the foreign-born population - Philippines (%)
Place of birth for the foreign-born population - Singapore (%)
Place of birth for the foreign-born population - Thailand (%)
Place of birth for the foreign-born population - Vietnam (%)
Place of birth for the foreign-born population - Other South Eastern Asia (%)
Place of birth for the foreign-born population - Armenia (%)
Place of birth for the foreign-born population - Iraq (%)
Place of birth for the foreign-born population - Israel (%)
Place of birth for the foreign-born population - Jordan (%)
Place of birth for the foreign-born population - Kuwait (%)
Place of birth for the foreign-born population - Lebanon (%)
Place of birth for the foreign-born population - Saudi Arabia (%)
Place of birth for the foreign-born population - Syria (%)
Place of birth for the foreign-born population - Turkey (%)
Place of birth for the foreign-born population - Yemen (%)
Place of birth for the foreign-born population - Other Western Asia (%)
Place of birth for the foreign-born population - Eritrea (%)
Place of birth for the foreign-born population - Ethiopia (%)
Place of birth for the foreign-born population - Kenya (%)
Place of birth for the foreign-born population - Somalia (%)
Place of birth for the foreign-born population - Uganda (%)
Place of birth for the foreign-born population - Zimbabwe (%)
Place of birth for the foreign-born population - Other Eastern Africa (%)
Place of birth for the foreign-born population - Cameroon (%)
Place of birth for the foreign-born population - Congo (%)
Place of birth for the foreign-born population - Democratic Republic of Congo (Zaire) (%)
Place of birth for the foreign-born population - Other Middle Africa (%)
Place of birth for the foreign-born population - Egypt (%)
Place of birth for the foreign-born population - Morocco (%)
Place of birth for the foreign-born population - Sudan (%)
Place of birth for the foreign-born population - Other Northern Africa (%)
Place of birth for the foreign-born population - South Africa (%)
Place of birth for the foreign-born population - Other Southern Africa (%)
Place of birth for the foreign-born population - Cabo Verde (%)
Place of birth for the foreign-born population - Ghana (%)
Place of birth for the foreign-born population - Liberia (%)
Place of birth for the foreign-born population - Nigeria (%)
Place of birth for the foreign-born population - Senegal (%)
Place of birth for the foreign-born population - Sierra Leone (%)
Place of birth for the foreign-born population - Other Western Africa (%)
Place of birth for the foreign-born population - Australia (%)
Place of birth for the foreign-born population - New Zealand (%)
Place of birth for the foreign-born population - Fiji (%)
Place of birth for the foreign-born population - Micronesia (%)
Place of birth for the foreign-born population - Bahamas (%)
Place of birth for the foreign-born population - Barbados (%)
Place of birth for the foreign-born population - Cuba (%)
Place of birth for the foreign-born population - Dominica (%)
Place of birth for the foreign-born population - Dominican Republic (%)
Place of birth for the foreign-born population - Grenada (%)
Place of birth for the foreign-born population - Haiti (%)
Place of birth for the foreign-born population - Jamaica (%)
Place of birth for the foreign-born population - St. Vincent and the Grenadines (%)
Place of birth for the foreign-born population - Trinidad and Tobago (%)
Place of birth for the foreign-born population - West Indies (%)
Place of birth for the foreign-born population - Other Caribbean (%)
Place of birth for the foreign-born population - Belize (%)
Place of birth for the foreign-born population - Costa Rica (%)
Place of birth for the foreign-born population - El Salvador (%)
Place of birth for the foreign-born population - Guatemala (%)
Place of birth for the foreign-born population - Honduras (%)
Place of birth for the foreign-born population - Mexico (%)
Place of birth for the foreign-born population - Nicaragua (%)
Place of birth for the foreign-born population - Panama (%)
Place of birth for the foreign-born population - Other Central America (%)
Place of birth for the foreign-born population - Argentina (%)
Place of birth for the foreign-born population - Bolivia (%)
Place of birth for the foreign-born population - Brazil (%)
Place of birth for the foreign-born population - Chile (%)
Place of birth for the foreign-born population - Colombia (%)
Place of birth for the foreign-born population - Ecuador (%)
Place of birth for the foreign-born population - Guyana (%)
Place of birth for the foreign-born population - Peru (%)
Place of birth for the foreign-born population - Uruguay (%)
Place of birth for the foreign-born population - Venezuela (%)
Place of birth for the foreign-born population - Other South America (%)
Place of birth for the foreign-born population - Canada (%)
Place of birth for the foreign-born population - Other Northern America (%)
Place of birth for the foreign-born population - Other (%)
Latest news about races in Newton, IA collected exclusively by city-data.com from local newspapers, TV, and radio stations
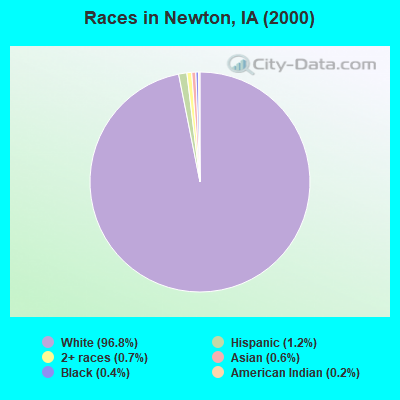
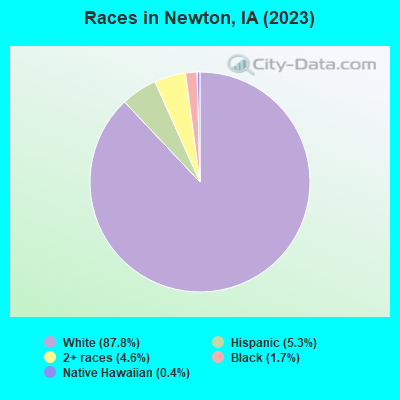
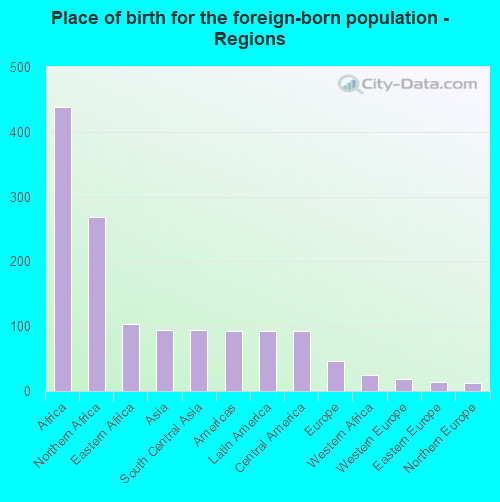
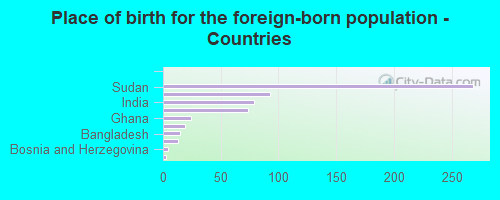
According to 2022 data, the most numerous races in Newton, IA are White alone (13,991 residents), Hispanic (684 residents), and Black alone (350 residents). 92.8% of Newton residents speak English at home. 4.3% of Newton, IA residents are foreign-born (2.7% born in Africa, 0.6% born in Asia, 0.6% born in Latin America), which is 16.8% less than the foreign-born rate of 5.0% across the entire state of Iowa.
Race distribution in Newton
2000 2022
2,710,344 92.6% White alone 82,473 2.8% Hispanic 60,744 2.1% Black alone 36,345 1.2% Asian alone 25,472 0.9% Two or more races 7,955 0.3% American Indian alone 2,103 0.07% Other race alone 888 0.03% Native Hawaiian and Other
2,650,110 82.8% White alone 218,024 6.8% Hispanic 119,004 3.7% Black alone 115,286 3.6% Two or more races 74,892 2.3% Asian alone 9,260 0.3% Other race alone 8,595 0.3% Native Hawaiian and Other 5,346 0.2% American Indian alone
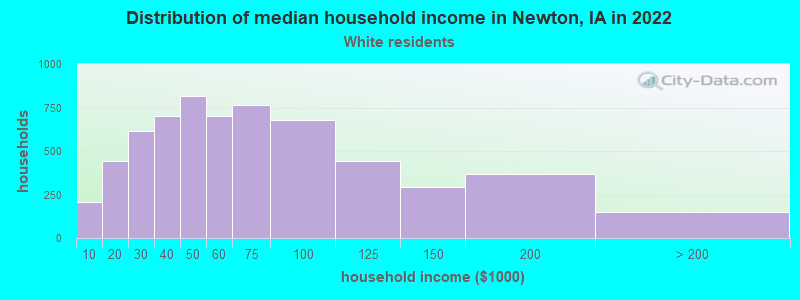
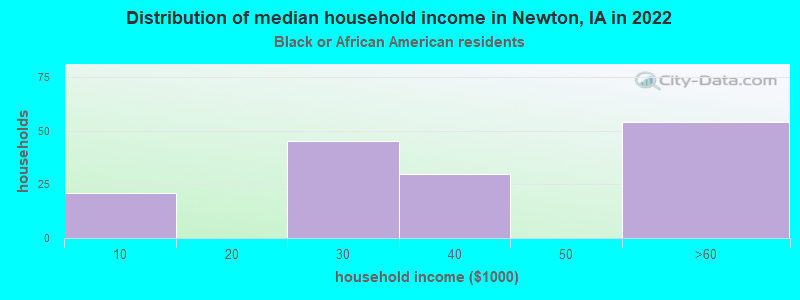
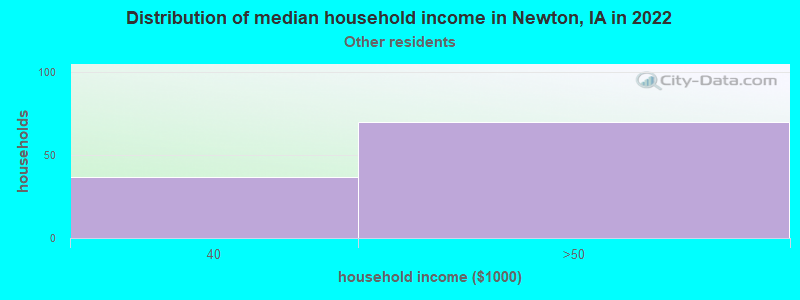
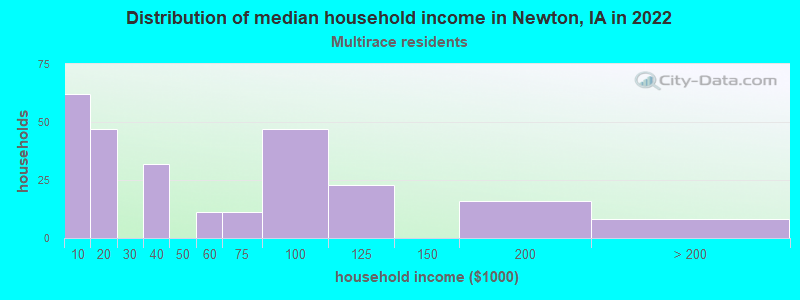
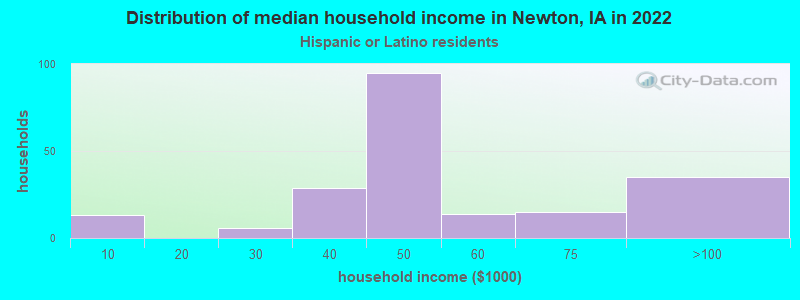
Income and house value in Newton Median household income in 2022 $54,156 White non-Hispanic householders$36,586 Black householders$49,471 Hispanic or Latino race householdersMedian 2022 house value $149,939 White Non-Hispanic householders$134,926 Black or African American householders$213,791 American Indian or Alaska Native householders $104,520 Asian householders$23,754 Some other race householders$172,173 Two or more races householders$137,776 Hispanic or Latino householders
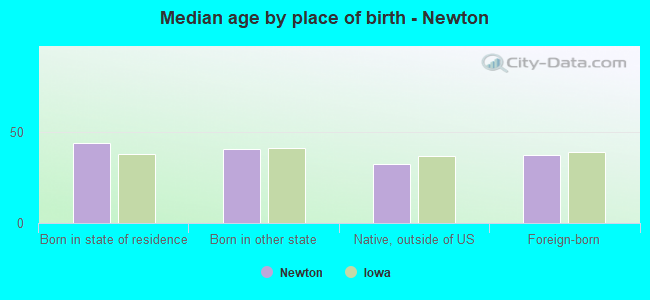
Median age by race in Newton
45.0 Median age for White residents41.3 48.2 30.4 Median age for Black or African American residents29.3 30.8 -660,397,073.5 Median age for American Indian / Alaska Native residents-654,282,765.1 -670,912,950.5 -719,077,567.4 Median age for Asian residents-729,641,693.1 -711,656,441.0 -580,729,166.1 Median age for Native Hawaiian / Pacific Islander residents-776,978,416.5 -504,347,825.6 32.0 Median age for Other race residents41.2 10.6 39.1 Median age for Two or more races residents37.0 44.1 45.3 Median age for White alone residents41.8 48.2 33.4 Median age for Hispanic or Latino residents35.1 17.2
Owner/renter occupied households by race in Newton
House owners and renters - White residents 4,427 72.0% Owner occupied1,724 28.0% Renter occupiedHouse owners and renters - Black or African American residents 23 15.6% Owner occupied127 84.4% Renter occupiedHouse owners and renters - American Indian / Alaska Native residents 22 100.0% Owner occupiedHouse owners and renters - Asian residents 13 100.0% Renter occupiedHouse owners and renters - Other race residents 63 63.5% Owner occupied36 36.5% Renter occupiedHouse owners and renters - Two or more races residents 118 46.7% Owner occupied135 53.3% Renter occupiedHouse owners and renters - White alone residents 4,404 72.2% Owner occupied1,696 27.8% Renter occupiedHouse owners and renters - Hispanic or Latino residents 108 54.2% Owner occupied91 45.8% Renter occupied
Language usage in Newton
English speakers - Total 92.8% of residents of Newton speak English at home.
2.6% of residents speak Spanish at home 223 58.2% Speak English very well160 41.8% Speak English less than very well4.6% of residents speak other language at home 362 52.7% Speak English very well325 47.3% Speak English less than very well
English speakers - Born in the United States 95.6% of residents of Newton speak English at home.
3.7% of residents speak Spanish at home 102 100.0% Speak English very well0.6% of residents speak other language at home 17 100.0% Speak English very well
English speakers - Native, born elsewhere 45.9% of residents of Newton speak English at home.
31.5% of residents speak Spanish at home 29 50.9% Speak English very well28 49.1% Speak English less than very well15.5% of residents speak other language at home 18 64.3% Speak English very well10 35.7% Speak English less than very well
English speakers - Foreign-born 6.2% of residents of Newton speak English at home.
14.3% of residents speak Spanish at home 15 14.9% Speak English very well86 85.1% Speak English less than very well77.1% of residents speak other language at home 238 43.8% Speak English very well305 56.2% Speak English less than very well
White (Caucasian) - Speak only English Native:
98.7% (13,100)Foreign-born:
27.0% (38)
White (Caucasian) - Speak another language Native:
1.4% (189)Foreign-born:
73.2% (105)
Black or African American - Speak another language Native:
12.3% (18)Foreign-born:
100.0% (179)
Other race - Speak another language Native:
62.6% (124)Foreign-born:
100.0% (19)
Two or more races - Speak another language Native:
11.3% (56)Foreign-born:
97.8% (419)
White alone - Speak only English Native:
98.5% (12,919)Foreign-born:
34.4% (43)
White alone - Speak another language Native:
1.5% (193)Foreign-born:
65.6% (82)
Hispanic or Latino - Speak another language Native:
28.7% (157)Foreign-born:
100.0% (101)
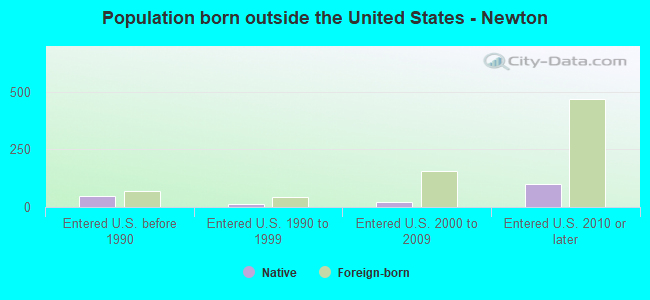
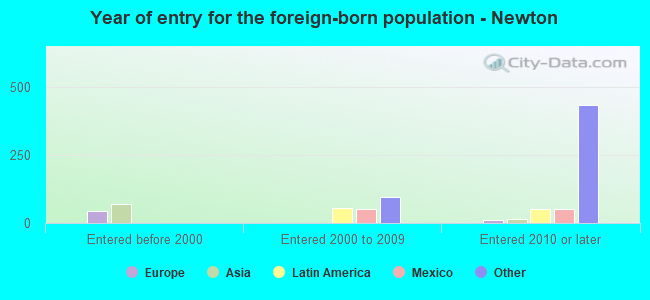
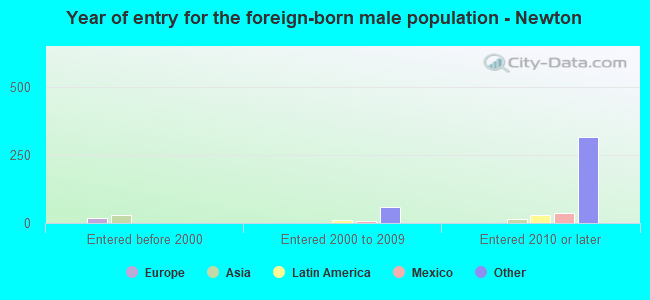
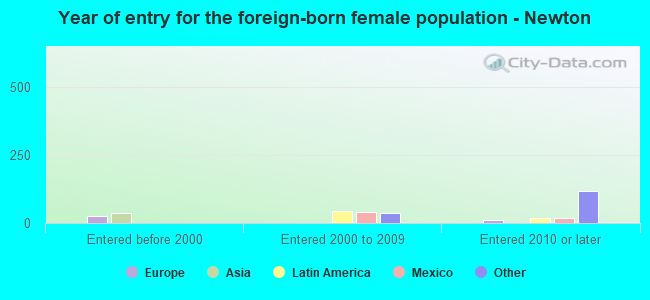
Foreign-born residents in Newton 674 residents are foreign born (2.7% Africa , 0.6% Asia , 0.6% Latin America ).
Marital status for residents in Newton Marital status - White (Caucasian) population 15 years and over
Males 36.3% Never married48.0% Now married1.5% Separated2.2% Widowed12.0% DivorcedFemales 19.8% Never married45.9% Now married3.1% Separated15.4% Widowed15.8% DivorcedWomen who gave birth in the past 12 months Now married:
100.0% (120)Unmarried:
0.0% (0)
Women who did not give birth in the past 12 months Now married:
48.2% (1,254)Unmarried:
51.8% (1,347)
Marital status - Black or African American population 15 years and over
Males 53.4% Never married35.4% Now married0.0% Separated0.0% Widowed11.1% DivorcedFemales 60.5% Never married39.5% Now married0.0% Separated0.0% Widowed0.0% DivorcedWomen who did not give birth in the past 12 months Now married:
41.1% (29)Unmarried:
58.9% (42)
Marital status - Other race population 15 years and over
Males 60.6% Never married39.4% Now married0.0% Separated0.0% Widowed0.0% DivorcedFemales 0.0% Never married100.0% Now married0.0% Separated0.0% Widowed0.0% DivorcedWomen who did not give birth in the past 12 months Now married:
100.0% (32)Unmarried:
0.0% (0)
Marital status - Two or more races population 15 years and over
Males 47.5% Never married42.6% Now married0.0% Separated5.4% Widowed4.5% DivorcedFemales 7.1% Never married80.0% Now married12.9% Separated0.0% Widowed0.0% DivorcedWomen who did not give birth in the past 12 months Now married:
92.1% (173)Unmarried:
7.9% (15)
Marital status - White alone, not Hispanic / Latino population 15 years and over
Males 36.6% Never married47.6% Now married1.5% Separated2.3% Widowed12.1% DivorcedFemales 20.0% Never married46.3% Now married2.3% Separated15.7% Widowed15.7% DivorcedWomen who gave birth in the past 12 months Now married:
100.0% (108)Unmarried:
0.0% (0)
Women who did not give birth in the past 12 months Now married:
47.4% (1,199)Unmarried:
52.6% (1,330)
Marital status - Hispanic or Latino population 15 years and over
Males 64.1% Never married35.9% Now married0.0% Separated0.0% Widowed0.0% DivorcedFemales 9.0% Never married39.7% Now married34.6% Separated0.0% Widowed16.7% DivorcedWomen who gave birth in the past 12 months Now married:
100.0% (15)Unmarried:
0.0% (0)
Women who did not give birth in the past 12 months Now married:
71.8% (112)Unmarried:
28.2% (44)
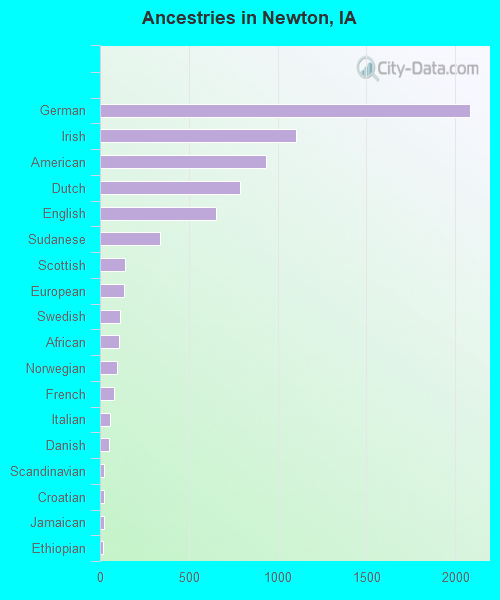
Ancestries in Newton
2,087 26.1% German1,105 13.8% Irish936 11.7% American789 9.9% Dutch655 8.2% English339 4.2% Sudanese142 1.8% Scottish135 1.7% European110 1.4% Swedish105 1.3% African93 1.2% Norwegian77 1.0% French56 0.7% Italian53 0.7% Danish24 0.3% Scandinavian20 0.2% Croatian20 0.2% Jamaican19 0.2% Ethiopian16 0.2% British13 0.2% French Canadian12 0.1% Scotch-Irish11 0.1% Polish10 0.1% Ukrainian9 0.1% Slovak8 0.10% Eastern European7 0.09% Welsh3 0.04% Czech3 0.04% Yugoslavian2 0.02% Albanian
Children Nativity (place of birth) in Newton
Children under 6 years - Living with two parents Both parents native 456 99.8% Native1 0.2% Foreign-bornBoth parents foreign-born 28 100.0% Foreign-bornChildren under 6 years - Living with one parent Native parent 416 100.0% NativeForeign-born parent 41 100.0% NativeChildren 6 to 17 years - Living with two parents Both parents native 1,305 100.0% NativeBoth parents foreign-born 91 36.4% Native159 63.6% Foreign-bornChildren 6 to 17 years - Living with one parent Native parent 692 100.0% NativeForeign-born parent 40 51.8% Native38 48.2% Foreign-born
Grandparents responsible for own grandchildren in Newton
Grandparents (30 to 59 years) White / Caucasian 21 35.6% Responsible for grandchildren39 64.4% Not responsible for grandchildrenWhite alone, not Hispanic / Latino 22 32.7% Responsible for grandchildren44 67.3% Not responsible for grandchildrenGrandparents (60 years and over) White / Caucasian 10 11.5% Responsible for grandchildren80 88.5% Not responsible for grandchildrenWhite alone, not Hispanic / Latino 10 11.1% Responsible for grandchildren83 88.9% Not responsible for grandchildren