Races in Newton, New Jersey (NJ) Detailed Stats
Data:
Races - White alone (%)
Races - White alone (% change since 2000)
Races - Black alone (%)
Races - Black alone (% change since 2000)
Races - American Indian alone (%)
Races - American Indian alone (% change since 2000)
Races - Asian alone (%)
Races - Asian alone (% change since 2000)
Races - Hispanic (%)
Races - Hispanic (% change since 2000)
Races - Native Hawaiian and Other Pacific Islander alone (%)
Races - Native Hawaiian and Other Pacific Islander alone (% change since 2000)
Races - Two or more races(%)
Races - Two or more races(% change since 2000)
Races - Other race alone (%)
Races - Other race alone (% change since 2000)
Racial diversity
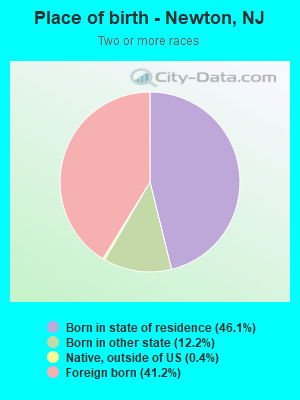
Place of birth - Born in state of residence (%)
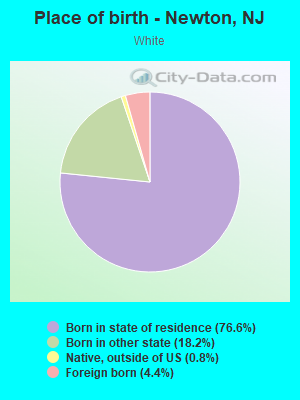
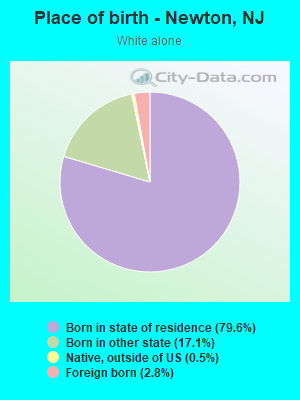
Place of birth - Born in state of residence (%) - White
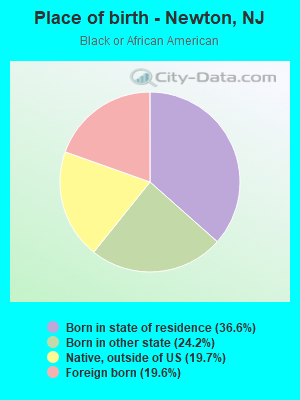
Place of birth - Born in state of residence (%) - Black or African American
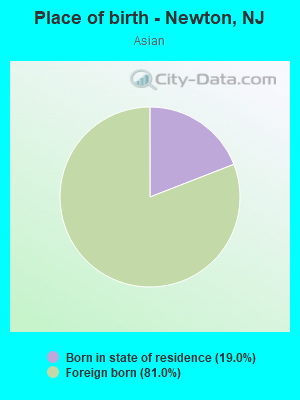
Place of birth - Born in state of residence (%) - Asian
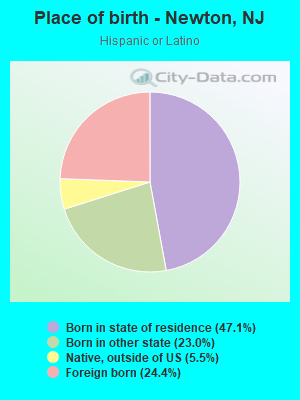
Place of birth - Born in state of residence (%) - Hispanic or Latino
Place of birth - Born in state of residence (%) - American Indian and Alaska Native
Place of birth - Born in state of residence (%) - Multirace
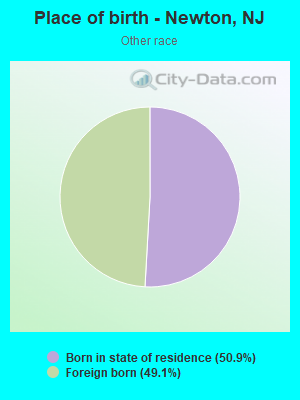
Place of birth - Born in state of residence (%) - Other Race
Place of birth - Born in other state (%)
Place of birth - Born in other state (%) - White
Place of birth - Born in other state (%) - Black or African American
Place of birth - Born in other state (%) - Asian
Place of birth - Born in other state (%) - Hispanic or Latino
Place of birth - Born in other state (%) - American Indian and Alaska Native
Place of birth - Born in other state (%) - Multirace
Place of birth - Born in other state (%) - Other Race
Place of birth - Native, outside of US (%)
Place of birth - Native, outside of US (%) - White
Place of birth - Native, outside of US (%) - Black or African American
Place of birth - Native, outside of US (%) - Asian
Place of birth - Native, outside of US (%) - Hispanic or Latino
Place of birth - Native, outside of US (%) - American Indian and Alaska Native
Place of birth - Native, outside of US (%) - Multirace
Place of birth - Native, outside of US (%) - Other Race
Place of birth - Foreign born (%)
Place of birth - Foreign born (%) - White
Place of birth - Foreign born (%) - Black or African American
Place of birth - Foreign born (%) - Asian
Place of birth - Foreign born (%) - Hispanic or Latino
Place of birth - Foreign born (%) - American Indian and Alaska Native
Place of birth - Foreign born (%) - Multirace
Place of birth - Foreign born (%) - Other Race
Residents speaking English at home (%)
Residents speaking English at home - Born in the United States (%)
Residents speaking English at home - Native, born elsewhere (%)
Residents speaking English at home - Foreign born (%)
Residents speaking Spanish at home (%)
Residents speaking Spanish at home - Born in the United States (%)
Residents speaking Spanish at home - Native, born elsewhere (%)
Residents speaking Spanish at home - Foreign born (%)
Residents speaking other language at home (%)
Residents speaking other language at home - Born in the United States (%)
Residents speaking other language at home - Native, born elsewhere (%)
Residents speaking other language at home - Foreign born (%)
Marital status - Never married (%)
Marital status - Now married (%)
Marital status - Separated (%)
Marital status - Widowed (%)
Marital status - Divorced (%)
Ancestries Reported - Arab (%)
Ancestries Reported - Czech (%)
Ancestries Reported - Danish (%)
Ancestries Reported - Dutch (%)
Ancestries Reported - English (%)
Ancestries Reported - French (%)
Ancestries Reported - French Canadian (%)
Ancestries Reported - German (%)
Ancestries Reported - Greek (%)
Ancestries Reported - Hungarian (%)
Ancestries Reported - Irish (%)
Ancestries Reported - Italian (%)
Ancestries Reported - Lithuanian (%)
Ancestries Reported - Norwegian (%)
Ancestries Reported - Polish (%)
Ancestries Reported - Portuguese (%)
Ancestries Reported - Russian (%)
Ancestries Reported - Scotch-Irish (%)
Ancestries Reported - Scottish (%)
Ancestries Reported - Slovak (%)
Ancestries Reported - Subsaharan African (%)
Ancestries Reported - Swedish (%)
Ancestries Reported - Swiss (%)
Ancestries Reported - Ukrainian (%)
Ancestries Reported - United States (%)
Ancestries Reported - Welsh (%)
Ancestries Reported - West Indian (%)
Ancestries Reported - Other (%)
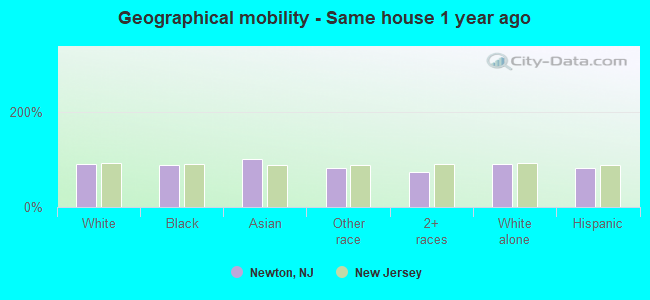
Geographical mobility - Same house 1 year ago (%)
Geographical mobility - Same house 1 year ago (%) - White
Geographical mobility - Same house 1 year ago (%) - Black or African American
Geographical mobility - Same house 1 year ago (%) - Asian
Geographical mobility - Same house 1 year ago (%) - Hispanic or Latino
Geographical mobility - Same house 1 year ago (%) - American Indian and Alaska Native
Geographical mobility - Same house 1 year ago (%) - Multirace
Geographical mobility - Same house 1 year ago (%) - Other Race
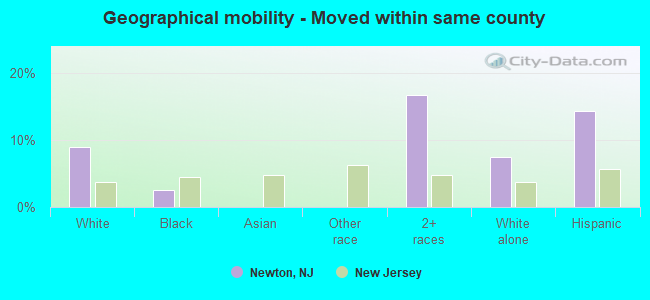
Geographical mobility - Moved within same county (%)
Geographical mobility - Moved within same county (%) - White
Geographical mobility - Moved within same county (%) - Black or African American
Geographical mobility - Moved within same county (%) - Asian
Geographical mobility - Moved within same county (%) - Hispanic or Latino
Geographical mobility - Moved within same county (%) - American Indian and Alaska Native
Geographical mobility - Moved within same county (%) - Multirace
Geographical mobility - Moved within same county (%) - Other Race
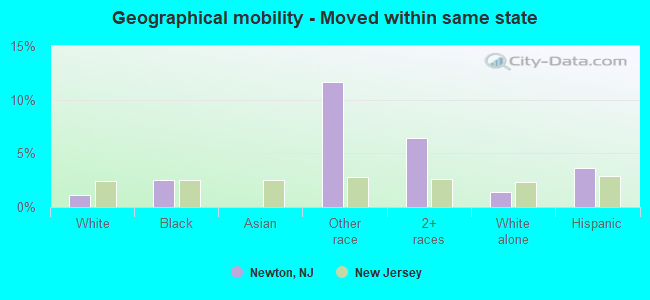
Geographical mobility - Moved from different county within same state (%)
Geographical mobility - Moved from different county within same state (%) - White
Geographical mobility - Moved from different county within same state (%) - Black or African American
Geographical mobility - Moved from different county within same state (%) - Asian
Geographical mobility - Moved from different county within same state (%) - Hispanic or Latino
Geographical mobility - Moved from different county within same state (%) - American Indian and Alaska Native
Geographical mobility - Moved from different county within same state (%) - Multirace
Geographical mobility - Moved from different county within same state (%) - Other Race
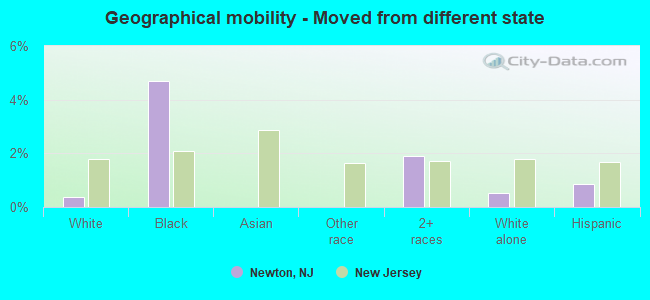
Geographical mobility - Moved from different state (%)
Geographical mobility - Moved from different state (%) - White
Geographical mobility - Moved from different state (%) - Black or African American
Geographical mobility - Moved from different state (%) - Asian
Geographical mobility - Moved from different state (%) - Hispanic or Latino
Geographical mobility - Moved from different state (%) - American Indian and Alaska Native
Geographical mobility - Moved from different state (%) - Multirace
Geographical mobility - Moved from different state (%) - Other Race
Geographical mobility - Moved from abroad (%)
Geographical mobility - Moved from abroad (%) - White
Geographical mobility - Moved from abroad (%) - Black or African American
Geographical mobility - Moved from abroad (%) - Asian
Geographical mobility - Moved from abroad (%) - Hispanic or Latino
Geographical mobility - Moved from abroad (%) - American Indian and Alaska Native
Geographical mobility - Moved from abroad (%) - Multirace
Geographical mobility - Moved from abroad (%) - Other Race
Place of birth for the foreign-born population - Ireland (%)
Place of birth for the foreign-born population - Denmark (%)
Place of birth for the foreign-born population - Norway (%)
Place of birth for the foreign-born population - Sweden (%)
Place of birth for the foreign-born population - United Kingdom (%)
Place of birth for the foreign-born population - England (%)
Place of birth for the foreign-born population - Scotland (%)
Place of birth for the foreign-born population - Other Northern Europe (%)
Place of birth for the foreign-born population - Austria (%)
Place of birth for the foreign-born population - Belgium (%)
Place of birth for the foreign-born population - France (%)
Place of birth for the foreign-born population - Germany (%)
Place of birth for the foreign-born population - Netherlands (%)
Place of birth for the foreign-born population - Switzerland (%)
Place of birth for the foreign-born population - Other Western Europe (%)
Place of birth for the foreign-born population - Greece (%)
Place of birth for the foreign-born population - Italy (%)
Place of birth for the foreign-born population - Portugal (%)
Place of birth for the foreign-born population - Spain (%)
Place of birth for the foreign-born population - Other Southern Europe (%)
Place of birth for the foreign-born population - Albania (%)
Place of birth for the foreign-born population - Belarus (%)
Place of birth for the foreign-born population - Bosnia and Herzegovina (%)
Place of birth for the foreign-born population - Bulgaria (%)
Place of birth for the foreign-born population - Croatia (%)
Place of birth for the foreign-born population - Czechoslovakia (%)
Place of birth for the foreign-born population - Hungary (%)
Place of birth for the foreign-born population - Latvia (%)
Place of birth for the foreign-born population - Lithuania (%)
Place of birth for the foreign-born population - North Macedonia (Macedonia) (%)
Place of birth for the foreign-born population - Moldova (%)
Place of birth for the foreign-born population - Poland (%)
Place of birth for the foreign-born population - Romania (%)
Place of birth for the foreign-born population - Russia (%)
Place of birth for the foreign-born population - Serbia (%)
Place of birth for the foreign-born population - Ukraine (%)
Place of birth for the foreign-born population - Other Eastern Europe (%)
Place of birth for the foreign-born population - China (%)
Place of birth for the foreign-born population - Hong Kong (%)
Place of birth for the foreign-born population - Taiwan (%)
Place of birth for the foreign-born population - Japan (%)
Place of birth for the foreign-born population - Korea (%)
Place of birth for the foreign-born population - Other Eastern Asia (%)
Place of birth for the foreign-born population - Afghanistan (%)
Place of birth for the foreign-born population - Bangladesh (%)
Place of birth for the foreign-born population - India (%)
Place of birth for the foreign-born population - Iran (%)
Place of birth for the foreign-born population - Kazakhstan (%)
Place of birth for the foreign-born population - Nepal (%)
Place of birth for the foreign-born population - Pakistan (%)
Place of birth for the foreign-born population - Sri Lanka (%)
Place of birth for the foreign-born population - Uzbekistan (%)
Place of birth for the foreign-born population - Other South Central Asia (%)
Place of birth for the foreign-born population - Burma (%)
Place of birth for the foreign-born population - Cambodia (%)
Place of birth for the foreign-born population - Indonesia (%)
Place of birth for the foreign-born population - Laos (%)
Place of birth for the foreign-born population - Malaysia (%)
Place of birth for the foreign-born population - Philippines (%)
Place of birth for the foreign-born population - Singapore (%)
Place of birth for the foreign-born population - Thailand (%)
Place of birth for the foreign-born population - Vietnam (%)
Place of birth for the foreign-born population - Other South Eastern Asia (%)
Place of birth for the foreign-born population - Armenia (%)
Place of birth for the foreign-born population - Iraq (%)
Place of birth for the foreign-born population - Israel (%)
Place of birth for the foreign-born population - Jordan (%)
Place of birth for the foreign-born population - Kuwait (%)
Place of birth for the foreign-born population - Lebanon (%)
Place of birth for the foreign-born population - Saudi Arabia (%)
Place of birth for the foreign-born population - Syria (%)
Place of birth for the foreign-born population - Turkey (%)
Place of birth for the foreign-born population - Yemen (%)
Place of birth for the foreign-born population - Other Western Asia (%)
Place of birth for the foreign-born population - Eritrea (%)
Place of birth for the foreign-born population - Ethiopia (%)
Place of birth for the foreign-born population - Kenya (%)
Place of birth for the foreign-born population - Somalia (%)
Place of birth for the foreign-born population - Uganda (%)
Place of birth for the foreign-born population - Zimbabwe (%)
Place of birth for the foreign-born population - Other Eastern Africa (%)
Place of birth for the foreign-born population - Cameroon (%)
Place of birth for the foreign-born population - Congo (%)
Place of birth for the foreign-born population - Democratic Republic of Congo (Zaire) (%)
Place of birth for the foreign-born population - Other Middle Africa (%)
Place of birth for the foreign-born population - Egypt (%)
Place of birth for the foreign-born population - Morocco (%)
Place of birth for the foreign-born population - Sudan (%)
Place of birth for the foreign-born population - Other Northern Africa (%)
Place of birth for the foreign-born population - South Africa (%)
Place of birth for the foreign-born population - Other Southern Africa (%)
Place of birth for the foreign-born population - Cabo Verde (%)
Place of birth for the foreign-born population - Ghana (%)
Place of birth for the foreign-born population - Liberia (%)
Place of birth for the foreign-born population - Nigeria (%)
Place of birth for the foreign-born population - Senegal (%)
Place of birth for the foreign-born population - Sierra Leone (%)
Place of birth for the foreign-born population - Other Western Africa (%)
Place of birth for the foreign-born population - Australia (%)
Place of birth for the foreign-born population - New Zealand (%)
Place of birth for the foreign-born population - Fiji (%)
Place of birth for the foreign-born population - Micronesia (%)
Place of birth for the foreign-born population - Bahamas (%)
Place of birth for the foreign-born population - Barbados (%)
Place of birth for the foreign-born population - Cuba (%)
Place of birth for the foreign-born population - Dominica (%)
Place of birth for the foreign-born population - Dominican Republic (%)
Place of birth for the foreign-born population - Grenada (%)
Place of birth for the foreign-born population - Haiti (%)
Place of birth for the foreign-born population - Jamaica (%)
Place of birth for the foreign-born population - St. Vincent and the Grenadines (%)
Place of birth for the foreign-born population - Trinidad and Tobago (%)
Place of birth for the foreign-born population - West Indies (%)
Place of birth for the foreign-born population - Other Caribbean (%)
Place of birth for the foreign-born population - Belize (%)
Place of birth for the foreign-born population - Costa Rica (%)
Place of birth for the foreign-born population - El Salvador (%)
Place of birth for the foreign-born population - Guatemala (%)
Place of birth for the foreign-born population - Honduras (%)
Place of birth for the foreign-born population - Mexico (%)
Place of birth for the foreign-born population - Nicaragua (%)
Place of birth for the foreign-born population - Panama (%)
Place of birth for the foreign-born population - Other Central America (%)
Place of birth for the foreign-born population - Argentina (%)
Place of birth for the foreign-born population - Bolivia (%)
Place of birth for the foreign-born population - Brazil (%)
Place of birth for the foreign-born population - Chile (%)
Place of birth for the foreign-born population - Colombia (%)
Place of birth for the foreign-born population - Ecuador (%)
Place of birth for the foreign-born population - Guyana (%)
Place of birth for the foreign-born population - Peru (%)
Place of birth for the foreign-born population - Uruguay (%)
Place of birth for the foreign-born population - Venezuela (%)
Place of birth for the foreign-born population - Other South America (%)
Place of birth for the foreign-born population - Canada (%)
Place of birth for the foreign-born population - Other Northern America (%)
Place of birth for the foreign-born population - Other (%)
Latest news about races in Newton, NJ collected exclusively by city-data.com from local newspapers, TV, and radio stations
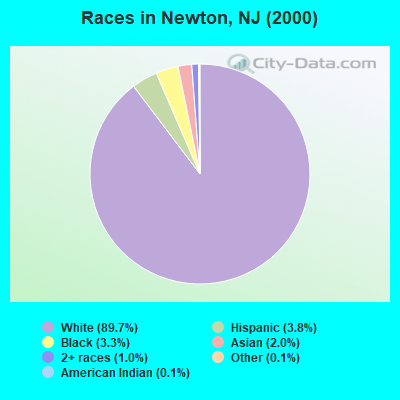
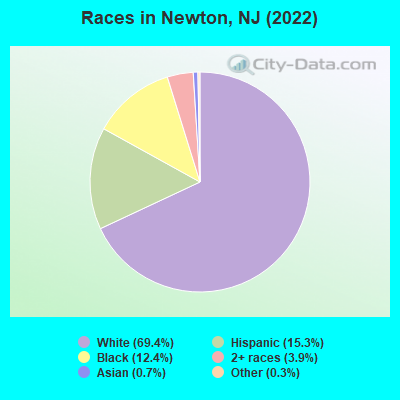
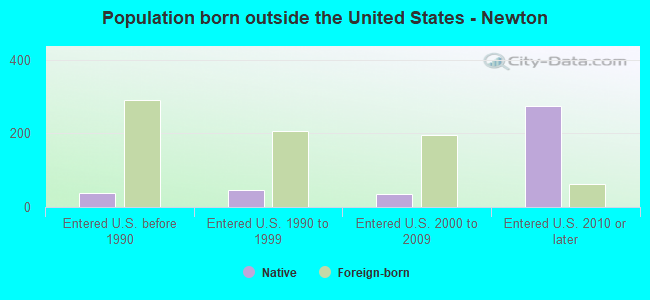
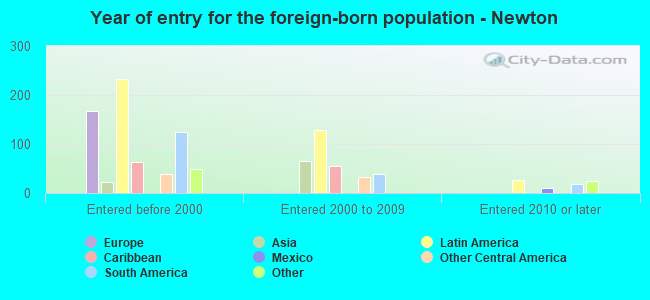
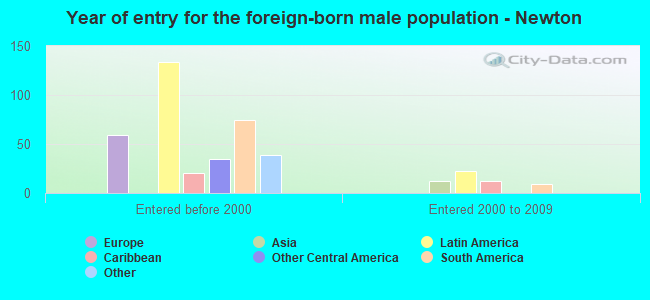
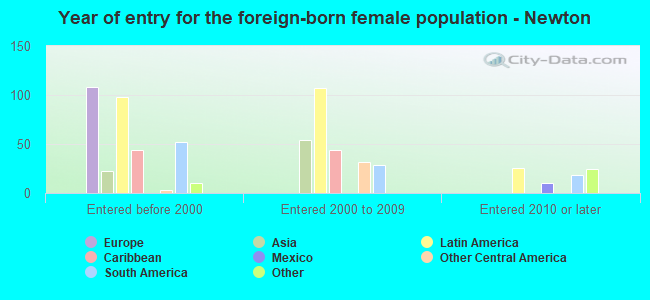
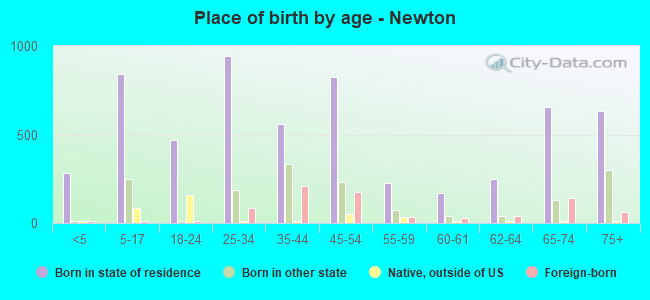
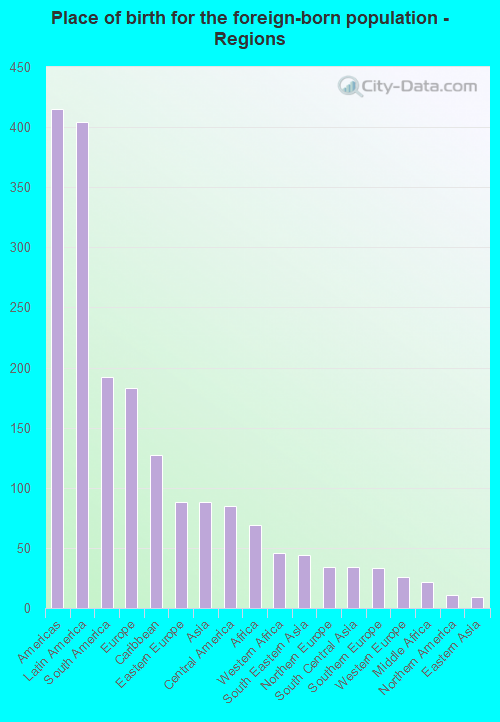
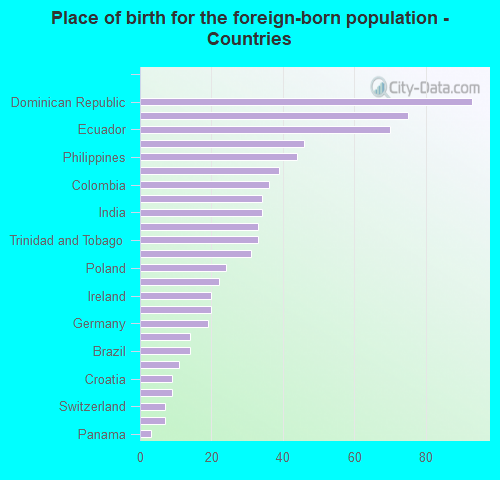
According to 2022 data, the most numerous races in Newton, NJ are White alone (5,862 residents), Hispanic (1,294 residents), and Black alone (1,046 residents). 87.1% of Newton residents speak English at home. 9.0% of Newton, NJ residents are foreign-born (4.7% born in Latin America, 2.1% born in Europe, 1.0% born in Asia), which is 156.9% less than the foreign-born rate of 23.0% across the entire state of New Jersey.
Race distribution in Newton
2000 2022
5,557,209 66.0% White alone 1,117,191 13.3% Hispanic 1,096,171 13.0% Black alone 477,012 5.7% Asian alone 133,689 1.6% Two or more races 19,565 0.2% Other race alone 11,338 0.1% American Indian alone 2,175 0.03% Native Hawaiian and Other
4,766,476 51.5% White alone 2,028,470 21.9% Hispanic 1,111,632 12.0% Black alone 923,546 10.0% Asian alone 332,237 3.6% Two or more races 89,847 1.0% Other race alone 8,557 0.09% American Indian alone 934 0.01% Native Hawaiian and Other
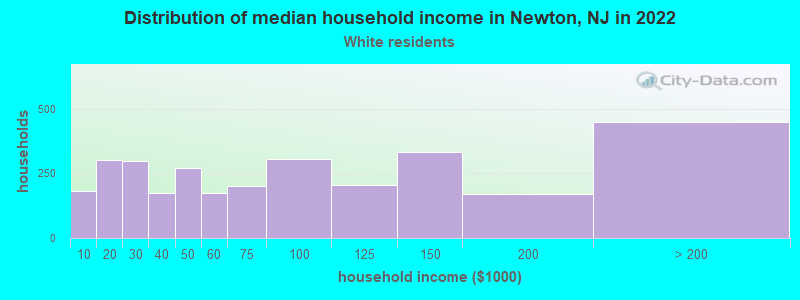
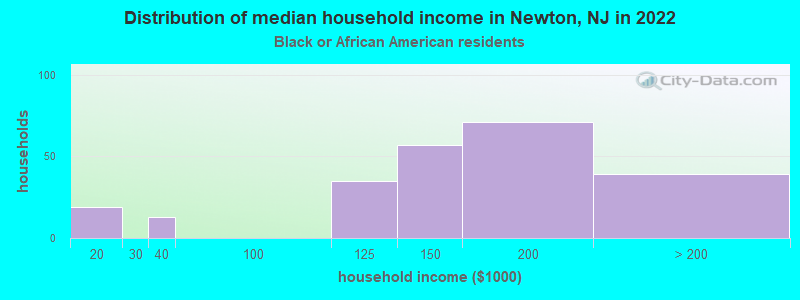
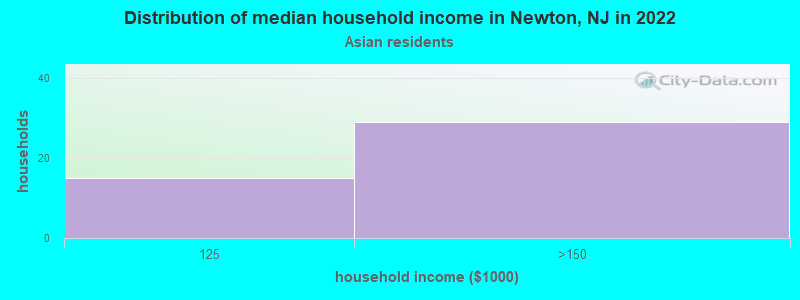
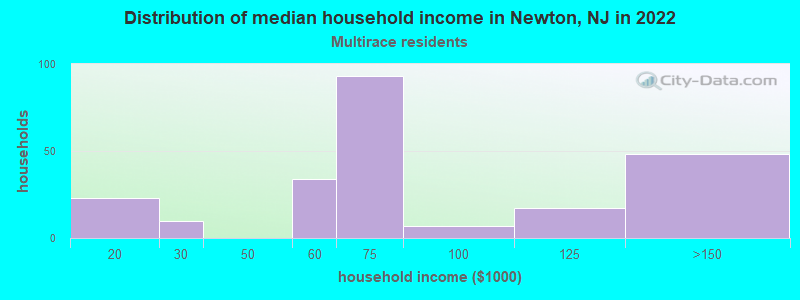
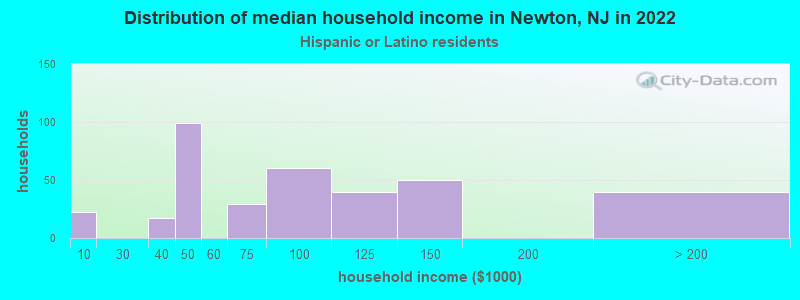
Income and house value in Newton Median household income in 2022 $72,337 White non-Hispanic householders$131,341 Black householders$55,736 Two or more races householders$84,132 Hispanic or Latino race householdersMedian 2022 house value $294,430 White Non-Hispanic householders$352,838 Black or African American householders $551,948 Asian householders$488,545 Some other race householders$442,079 Hispanic or Latino householders
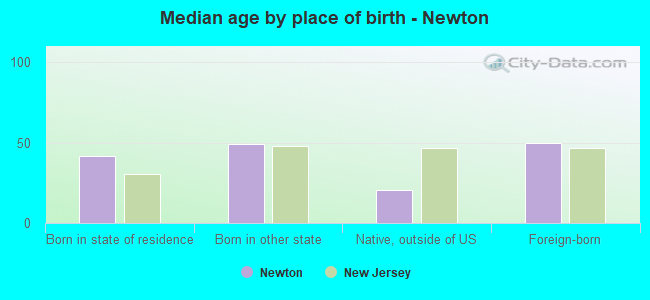
Median age by race in Newton
45.8 Median age for White residents40.0 51.8 30.8 Median age for Black or African American residents26.7 47.2 -1,094,650,204.7 Median age for American Indian / Alaska Native residents-1,093,004,114.1 -666,666,666.0 54.5 Median age for Asian residents-725,490,195.4 53.3 -666,666,666.0 Median age for Native Hawaiian / Pacific Islander residents-666,666,666.0 -666,666,666.0 45.7 Median age for Other race residents56.3 34.7 39.1 Median age for Two or more races residents27.4 49.2 49.0 Median age for White alone residents42.5 55.5 33.9 Median age for Hispanic or Latino residents35.8 31.6
Owner/renter occupied households by race in Newton
House owners and renters - White residents 1,746 56.5% Owner occupied1,345 43.5% Renter occupiedHouse owners and renters - Black or African American residents 167 68.0% Owner occupied79 32.0% Renter occupiedHouse owners and renters - Asian residents 16 35.0% Owner occupied30 65.0% Renter occupiedHouse owners and renters - Other race residents 43 100.0% Owner occupiedHouse owners and renters - Two or more races residents 177 77.4% Owner occupied52 22.6% Renter occupiedHouse owners and renters - White alone residents 1,698 59.3% Owner occupied1,166 40.7% Renter occupiedHouse owners and renters - Hispanic or Latino residents 184 49.4% Owner occupied188 50.6% Renter occupied
Language usage in Newton
English speakers - Total 87.1% of residents of Newton speak English at home.
9.7% of residents speak Spanish at home 619 78.5% Speak English very well170 21.5% Speak English less than very well3.7% of residents speak other language at home 266 88.4% Speak English very well35 11.6% Speak English less than very well
English speakers - Born in the United States 87.1% of residents of Newton speak English at home.
13.6% of residents speak Spanish at home 210 100.0% Speak English very well1.2% of residents speak other language at home 18 100.0% Speak English very well
English speakers - Native, born elsewhere 79.9% of residents of Newton speak English at home.
23.2% of residents speak Spanish at home 14 16.9% Speak English very well69 83.1% Speak English less than very well
English speakers - Foreign-born 33.6% of residents of Newton speak English at home.
31.7% of residents speak Spanish at home 139 55.2% Speak English very well113 44.8% Speak English less than very well33.5% of residents speak other language at home 227 85.3% Speak English very well39 14.7% Speak English less than very well
White (Caucasian) - Speak only English Native:
94.2% (5,646)Foreign-born:
11.8% (34)
White (Caucasian) - Speak another language Native:
4.8% (287)Foreign-born:
89.7% (257)
Black or African American - Speak only English Native:
100.0% (796)Foreign-born:
54.2% (53)
Asian - Speak only English Native:
100.0% (13)Foreign-born:
42.7% (23)
Other race - Speak only English Native:
41.8% (32)Foreign-born:
100.0% (69)
Other race - Speak another language Native:
29.4% (22)Foreign-born:
37.7% (26)
Two or more races - Speak only English Native:
81.5% (307)Foreign-born:
40.9% (121)
Two or more races - Speak another language Native:
18.1% (68)Foreign-born:
46.7% (138)
White alone - Speak only English Native:
99.5% (5,453)Foreign-born:
22.0% (36)
White alone - Speak another language Native:
0.8% (44)Foreign-born:
81.4% (134)
Hispanic or Latino - Speak only English Native:
45.6% (459)Foreign-born:
15.8% (49)
Hispanic or Latino - Speak another language Native:
54.6% (550)Foreign-born:
84.7% (261)
Foreign-born residents in Newton 756 residents are foreign born (4.7% Latin America , 2.1% Europe , 1.0% Asia ).
This city:
9.0%New Jersey:
23.2%
Marital status for residents in Newton Marital status - White (Caucasian) population 15 years and over
Males 37.5% Never married47.5% Now married1.3% Separated1.2% Widowed12.5% DivorcedFemales 27.6% Never married34.2% Now married3.3% Separated17.1% Widowed17.8% DivorcedWomen who gave birth in the past 12 months Now married:
44.6% (23)Unmarried:
55.4% (29)
Women who did not give birth in the past 12 months Now married:
42.4% (575)Unmarried:
57.6% (781)
Marital status - Black or African American population 15 years and over
Males 65.9% Never married29.5% Now married0.0% Separated4.6% Widowed0.0% DivorcedFemales 59.5% Never married22.0% Now married0.0% Separated18.5% Widowed0.0% DivorcedWomen who did not give birth in the past 12 months Now married:
20.8% (52)Unmarried:
79.2% (197)
Marital status - Other race population 15 years and over
Males 0.0% Never married100.0% Now married0.0% Separated0.0% Widowed0.0% DivorcedFemales 39.1% Never married60.9% Now married0.0% Separated0.0% Widowed0.0% DivorcedWomen who did not give birth in the past 12 months Now married:
60.9% (35)Unmarried:
39.1% (23)
Marital status - Two or more races population 15 years and over
Males 35.9% Never married45.8% Now married0.0% Separated5.6% Widowed12.7% DivorcedFemales 47.3% Never married40.1% Now married5.5% Separated3.8% Widowed3.3% DivorcedWomen who gave birth in the past 12 months Now married:
0.0% (0)Unmarried:
100.0% (20)
Women who did not give birth in the past 12 months Now married:
36.4% (71)Unmarried:
63.6% (125)
Marital status - White alone, not Hispanic / Latino population 15 years and over
Males 37.4% Never married47.9% Now married1.5% Separated1.3% Widowed11.9% DivorcedFemales 26.8% Never married34.5% Now married1.7% Separated18.7% Widowed18.3% DivorcedWomen who gave birth in the past 12 months Now married:
44.6% (24)Unmarried:
55.4% (29)
Women who did not give birth in the past 12 months Now married:
39.1% (448)Unmarried:
60.9% (698)
Marital status - Hispanic or Latino population 15 years and over
Males 28.5% Never married57.4% Now married0.0% Separated2.0% Widowed12.1% DivorcedFemales 34.2% Never married38.9% Now married14.6% Separated2.5% Widowed9.9% DivorcedWomen who gave birth in the past 12 months Now married:
0.0% (0)Unmarried:
100.0% (12)
Women who did not give birth in the past 12 months Now married:
61.0% (234)Unmarried:
39.0% (150)
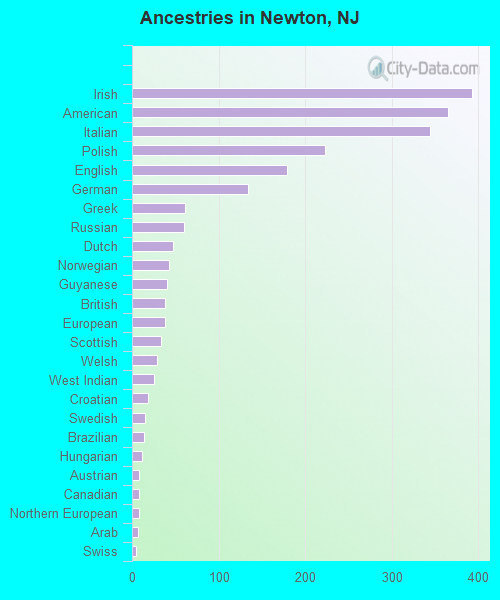
Ancestries in Newton
393 12.9% Irish365 12.0% American344 11.3% Italian223 7.3% Polish179 5.9% English134 4.4% German61 2.0% Greek60 2.0% Russian47 1.5% Dutch43 1.4% Norwegian41 1.3% Guyanese38 1.2% British38 1.2% European34 1.1% Scottish29 1.0% Welsh26 0.9% West Indian19 0.6% Croatian15 0.5% Swedish14 0.5% Brazilian11 0.4% Hungarian8 0.3% Austrian8 0.3% Canadian8 0.3% Northern European7 0.2% Arab5 0.2% Swiss
Children Nativity (place of birth) in Newton
Children under 6 years - Living with two parents Both parents native 198 100.0% NativeBoth parents foreign-born 16 100.0% NativeChildren under 6 years - Living with one parent Native parent 144 100.0% NativeChildren 6 to 17 years - Living with two parents Both parents native 514 100.0% NativeBoth parents foreign-born 107 100.0% NativeOne native, one foreign-born parent 94 100.0% NativeChildren 6 to 17 years - Living with one parent Native parent 142 100.0% NativeForeign-born parent 207 50.0% Native207 50.0% Foreign-born
Grandparents responsible for own grandchildren in Newton
Grandparents (30 to 59 years) White / Caucasian 5 100.0% Not responsible for grandchildrenWhite alone, not Hispanic / Latino 6 100.0% Not responsible for grandchildrenGrandparents (60 years and over) White / Caucasian 9 33.5% Responsible for grandchildren19 66.5% Not responsible for grandchildrenWhite alone, not Hispanic / Latino 11 100.0% Responsible for grandchildren