Races in Niagara Falls, New York (NY) Detailed Stats
Data:
Races - White alone (%)
Races - White alone (% change since 2000)
Races - Black alone (%)
Races - Black alone (% change since 2000)
Races - American Indian alone (%)
Races - American Indian alone (% change since 2000)
Races - Asian alone (%)
Races - Asian alone (% change since 2000)
Races - Hispanic (%)
Races - Hispanic (% change since 2000)
Races - Native Hawaiian and Other Pacific Islander alone (%)
Races - Native Hawaiian and Other Pacific Islander alone (% change since 2000)
Races - Two or more races(%)
Races - Two or more races(% change since 2000)
Races - Other race alone (%)
Races - Other race alone (% change since 2000)
Racial diversity
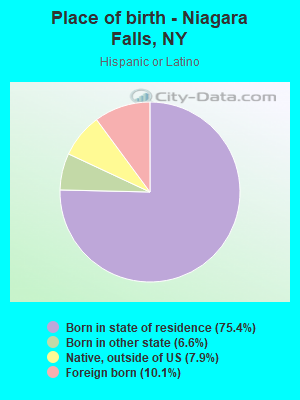
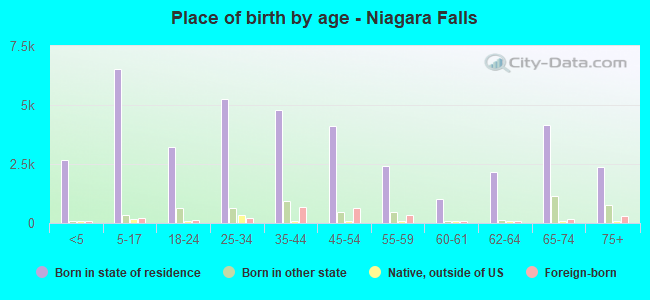
Place of birth - Born in state of residence (%)
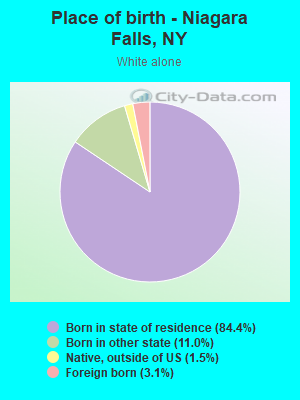
Place of birth - Born in state of residence (%) - White
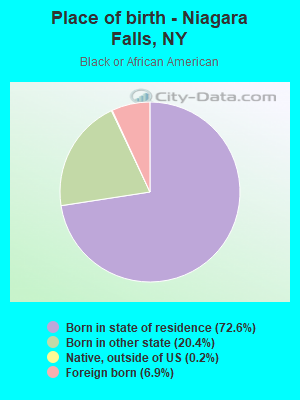
Place of birth - Born in state of residence (%) - Black or African American
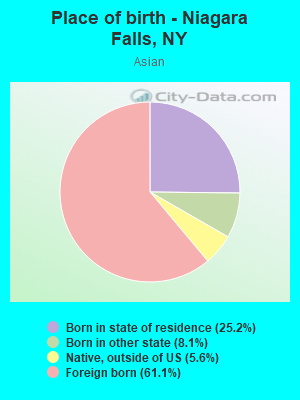
Place of birth - Born in state of residence (%) - Asian
Place of birth - Born in state of residence (%) - Hispanic or Latino
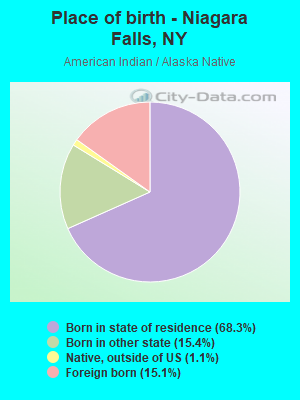
Place of birth - Born in state of residence (%) - American Indian and Alaska Native
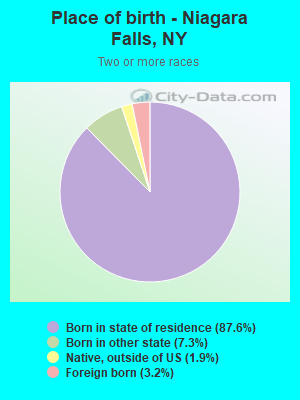
Place of birth - Born in state of residence (%) - Multirace
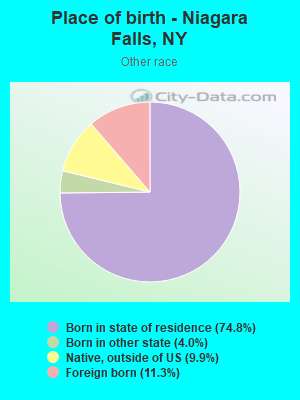
Place of birth - Born in state of residence (%) - Other Race
Place of birth - Born in other state (%)
Place of birth - Born in other state (%) - White
Place of birth - Born in other state (%) - Black or African American
Place of birth - Born in other state (%) - Asian
Place of birth - Born in other state (%) - Hispanic or Latino
Place of birth - Born in other state (%) - American Indian and Alaska Native
Place of birth - Born in other state (%) - Multirace
Place of birth - Born in other state (%) - Other Race
Place of birth - Native, outside of US (%)
Place of birth - Native, outside of US (%) - White
Place of birth - Native, outside of US (%) - Black or African American
Place of birth - Native, outside of US (%) - Asian
Place of birth - Native, outside of US (%) - Hispanic or Latino
Place of birth - Native, outside of US (%) - American Indian and Alaska Native
Place of birth - Native, outside of US (%) - Multirace
Place of birth - Native, outside of US (%) - Other Race
Place of birth - Foreign born (%)
Place of birth - Foreign born (%) - White
Place of birth - Foreign born (%) - Black or African American
Place of birth - Foreign born (%) - Asian
Place of birth - Foreign born (%) - Hispanic or Latino
Place of birth - Foreign born (%) - American Indian and Alaska Native
Place of birth - Foreign born (%) - Multirace
Place of birth - Foreign born (%) - Other Race
Residents speaking English at home (%)
Residents speaking English at home - Born in the United States (%)
Residents speaking English at home - Native, born elsewhere (%)
Residents speaking English at home - Foreign born (%)
Residents speaking Spanish at home (%)
Residents speaking Spanish at home - Born in the United States (%)
Residents speaking Spanish at home - Native, born elsewhere (%)
Residents speaking Spanish at home - Foreign born (%)
Residents speaking other language at home (%)
Residents speaking other language at home - Born in the United States (%)
Residents speaking other language at home - Native, born elsewhere (%)
Residents speaking other language at home - Foreign born (%)
Marital status - Never married (%)
Marital status - Now married (%)
Marital status - Separated (%)
Marital status - Widowed (%)
Marital status - Divorced (%)
Ancestries Reported - Arab (%)
Ancestries Reported - Czech (%)
Ancestries Reported - Danish (%)
Ancestries Reported - Dutch (%)
Ancestries Reported - English (%)
Ancestries Reported - French (%)
Ancestries Reported - French Canadian (%)
Ancestries Reported - German (%)
Ancestries Reported - Greek (%)
Ancestries Reported - Hungarian (%)
Ancestries Reported - Irish (%)
Ancestries Reported - Italian (%)
Ancestries Reported - Lithuanian (%)
Ancestries Reported - Norwegian (%)
Ancestries Reported - Polish (%)
Ancestries Reported - Portuguese (%)
Ancestries Reported - Russian (%)
Ancestries Reported - Scotch-Irish (%)
Ancestries Reported - Scottish (%)
Ancestries Reported - Slovak (%)
Ancestries Reported - Subsaharan African (%)
Ancestries Reported - Swedish (%)
Ancestries Reported - Swiss (%)
Ancestries Reported - Ukrainian (%)
Ancestries Reported - United States (%)
Ancestries Reported - Welsh (%)
Ancestries Reported - West Indian (%)
Ancestries Reported - Other (%)
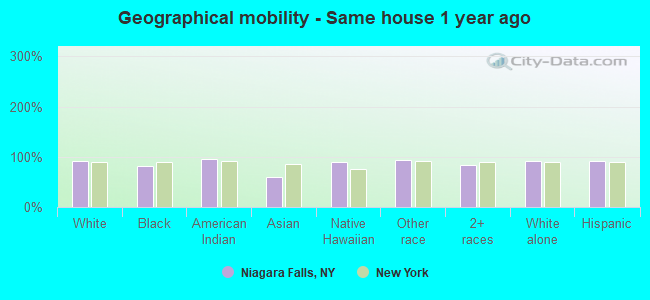
Geographical mobility - Same house 1 year ago (%)
Geographical mobility - Same house 1 year ago (%) - White
Geographical mobility - Same house 1 year ago (%) - Black or African American
Geographical mobility - Same house 1 year ago (%) - Asian
Geographical mobility - Same house 1 year ago (%) - Hispanic or Latino
Geographical mobility - Same house 1 year ago (%) - American Indian and Alaska Native
Geographical mobility - Same house 1 year ago (%) - Multirace
Geographical mobility - Same house 1 year ago (%) - Other Race
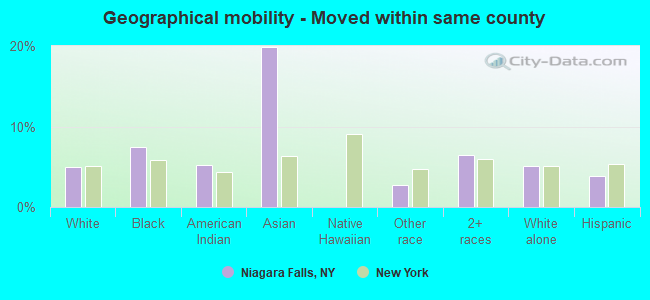
Geographical mobility - Moved within same county (%)
Geographical mobility - Moved within same county (%) - White
Geographical mobility - Moved within same county (%) - Black or African American
Geographical mobility - Moved within same county (%) - Asian
Geographical mobility - Moved within same county (%) - Hispanic or Latino
Geographical mobility - Moved within same county (%) - American Indian and Alaska Native
Geographical mobility - Moved within same county (%) - Multirace
Geographical mobility - Moved within same county (%) - Other Race
Geographical mobility - Moved from different county within same state (%)
Geographical mobility - Moved from different county within same state (%) - White
Geographical mobility - Moved from different county within same state (%) - Black or African American
Geographical mobility - Moved from different county within same state (%) - Asian
Geographical mobility - Moved from different county within same state (%) - Hispanic or Latino
Geographical mobility - Moved from different county within same state (%) - American Indian and Alaska Native
Geographical mobility - Moved from different county within same state (%) - Multirace
Geographical mobility - Moved from different county within same state (%) - Other Race
Geographical mobility - Moved from different state (%)
Geographical mobility - Moved from different state (%) - White
Geographical mobility - Moved from different state (%) - Black or African American
Geographical mobility - Moved from different state (%) - Asian
Geographical mobility - Moved from different state (%) - Hispanic or Latino
Geographical mobility - Moved from different state (%) - American Indian and Alaska Native
Geographical mobility - Moved from different state (%) - Multirace
Geographical mobility - Moved from different state (%) - Other Race
Geographical mobility - Moved from abroad (%)
Geographical mobility - Moved from abroad (%) - White
Geographical mobility - Moved from abroad (%) - Black or African American
Geographical mobility - Moved from abroad (%) - Asian
Geographical mobility - Moved from abroad (%) - Hispanic or Latino
Geographical mobility - Moved from abroad (%) - American Indian and Alaska Native
Geographical mobility - Moved from abroad (%) - Multirace
Geographical mobility - Moved from abroad (%) - Other Race
Place of birth for the foreign-born population - Ireland (%)
Place of birth for the foreign-born population - Denmark (%)
Place of birth for the foreign-born population - Norway (%)
Place of birth for the foreign-born population - Sweden (%)
Place of birth for the foreign-born population - United Kingdom (%)
Place of birth for the foreign-born population - England (%)
Place of birth for the foreign-born population - Scotland (%)
Place of birth for the foreign-born population - Other Northern Europe (%)
Place of birth for the foreign-born population - Austria (%)
Place of birth for the foreign-born population - Belgium (%)
Place of birth for the foreign-born population - France (%)
Place of birth for the foreign-born population - Germany (%)
Place of birth for the foreign-born population - Netherlands (%)
Place of birth for the foreign-born population - Switzerland (%)
Place of birth for the foreign-born population - Other Western Europe (%)
Place of birth for the foreign-born population - Greece (%)
Place of birth for the foreign-born population - Italy (%)
Place of birth for the foreign-born population - Portugal (%)
Place of birth for the foreign-born population - Spain (%)
Place of birth for the foreign-born population - Other Southern Europe (%)
Place of birth for the foreign-born population - Albania (%)
Place of birth for the foreign-born population - Belarus (%)
Place of birth for the foreign-born population - Bosnia and Herzegovina (%)
Place of birth for the foreign-born population - Bulgaria (%)
Place of birth for the foreign-born population - Croatia (%)
Place of birth for the foreign-born population - Czechoslovakia (%)
Place of birth for the foreign-born population - Hungary (%)
Place of birth for the foreign-born population - Latvia (%)
Place of birth for the foreign-born population - Lithuania (%)
Place of birth for the foreign-born population - North Macedonia (Macedonia) (%)
Place of birth for the foreign-born population - Moldova (%)
Place of birth for the foreign-born population - Poland (%)
Place of birth for the foreign-born population - Romania (%)
Place of birth for the foreign-born population - Russia (%)
Place of birth for the foreign-born population - Serbia (%)
Place of birth for the foreign-born population - Ukraine (%)
Place of birth for the foreign-born population - Other Eastern Europe (%)
Place of birth for the foreign-born population - China (%)
Place of birth for the foreign-born population - Hong Kong (%)
Place of birth for the foreign-born population - Taiwan (%)
Place of birth for the foreign-born population - Japan (%)
Place of birth for the foreign-born population - Korea (%)
Place of birth for the foreign-born population - Other Eastern Asia (%)
Place of birth for the foreign-born population - Afghanistan (%)
Place of birth for the foreign-born population - Bangladesh (%)
Place of birth for the foreign-born population - India (%)
Place of birth for the foreign-born population - Iran (%)
Place of birth for the foreign-born population - Kazakhstan (%)
Place of birth for the foreign-born population - Nepal (%)
Place of birth for the foreign-born population - Pakistan (%)
Place of birth for the foreign-born population - Sri Lanka (%)
Place of birth for the foreign-born population - Uzbekistan (%)
Place of birth for the foreign-born population - Other South Central Asia (%)
Place of birth for the foreign-born population - Burma (%)
Place of birth for the foreign-born population - Cambodia (%)
Place of birth for the foreign-born population - Indonesia (%)
Place of birth for the foreign-born population - Laos (%)
Place of birth for the foreign-born population - Malaysia (%)
Place of birth for the foreign-born population - Philippines (%)
Place of birth for the foreign-born population - Singapore (%)
Place of birth for the foreign-born population - Thailand (%)
Place of birth for the foreign-born population - Vietnam (%)
Place of birth for the foreign-born population - Other South Eastern Asia (%)
Place of birth for the foreign-born population - Armenia (%)
Place of birth for the foreign-born population - Iraq (%)
Place of birth for the foreign-born population - Israel (%)
Place of birth for the foreign-born population - Jordan (%)
Place of birth for the foreign-born population - Kuwait (%)
Place of birth for the foreign-born population - Lebanon (%)
Place of birth for the foreign-born population - Saudi Arabia (%)
Place of birth for the foreign-born population - Syria (%)
Place of birth for the foreign-born population - Turkey (%)
Place of birth for the foreign-born population - Yemen (%)
Place of birth for the foreign-born population - Other Western Asia (%)
Place of birth for the foreign-born population - Eritrea (%)
Place of birth for the foreign-born population - Ethiopia (%)
Place of birth for the foreign-born population - Kenya (%)
Place of birth for the foreign-born population - Somalia (%)
Place of birth for the foreign-born population - Uganda (%)
Place of birth for the foreign-born population - Zimbabwe (%)
Place of birth for the foreign-born population - Other Eastern Africa (%)
Place of birth for the foreign-born population - Cameroon (%)
Place of birth for the foreign-born population - Congo (%)
Place of birth for the foreign-born population - Democratic Republic of Congo (Zaire) (%)
Place of birth for the foreign-born population - Other Middle Africa (%)
Place of birth for the foreign-born population - Egypt (%)
Place of birth for the foreign-born population - Morocco (%)
Place of birth for the foreign-born population - Sudan (%)
Place of birth for the foreign-born population - Other Northern Africa (%)
Place of birth for the foreign-born population - South Africa (%)
Place of birth for the foreign-born population - Other Southern Africa (%)
Place of birth for the foreign-born population - Cabo Verde (%)
Place of birth for the foreign-born population - Ghana (%)
Place of birth for the foreign-born population - Liberia (%)
Place of birth for the foreign-born population - Nigeria (%)
Place of birth for the foreign-born population - Senegal (%)
Place of birth for the foreign-born population - Sierra Leone (%)
Place of birth for the foreign-born population - Other Western Africa (%)
Place of birth for the foreign-born population - Australia (%)
Place of birth for the foreign-born population - New Zealand (%)
Place of birth for the foreign-born population - Fiji (%)
Place of birth for the foreign-born population - Micronesia (%)
Place of birth for the foreign-born population - Bahamas (%)
Place of birth for the foreign-born population - Barbados (%)
Place of birth for the foreign-born population - Cuba (%)
Place of birth for the foreign-born population - Dominica (%)
Place of birth for the foreign-born population - Dominican Republic (%)
Place of birth for the foreign-born population - Grenada (%)
Place of birth for the foreign-born population - Haiti (%)
Place of birth for the foreign-born population - Jamaica (%)
Place of birth for the foreign-born population - St. Vincent and the Grenadines (%)
Place of birth for the foreign-born population - Trinidad and Tobago (%)
Place of birth for the foreign-born population - West Indies (%)
Place of birth for the foreign-born population - Other Caribbean (%)
Place of birth for the foreign-born population - Belize (%)
Place of birth for the foreign-born population - Costa Rica (%)
Place of birth for the foreign-born population - El Salvador (%)
Place of birth for the foreign-born population - Guatemala (%)
Place of birth for the foreign-born population - Honduras (%)
Place of birth for the foreign-born population - Mexico (%)
Place of birth for the foreign-born population - Nicaragua (%)
Place of birth for the foreign-born population - Panama (%)
Place of birth for the foreign-born population - Other Central America (%)
Place of birth for the foreign-born population - Argentina (%)
Place of birth for the foreign-born population - Bolivia (%)
Place of birth for the foreign-born population - Brazil (%)
Place of birth for the foreign-born population - Chile (%)
Place of birth for the foreign-born population - Colombia (%)
Place of birth for the foreign-born population - Ecuador (%)
Place of birth for the foreign-born population - Guyana (%)
Place of birth for the foreign-born population - Peru (%)
Place of birth for the foreign-born population - Uruguay (%)
Place of birth for the foreign-born population - Venezuela (%)
Place of birth for the foreign-born population - Other South America (%)
Place of birth for the foreign-born population - Canada (%)
Place of birth for the foreign-born population - Other Northern America (%)
Place of birth for the foreign-born population - Other (%)
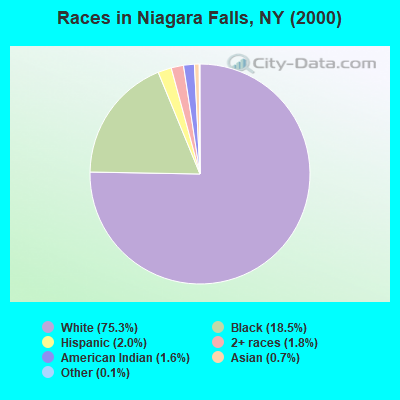
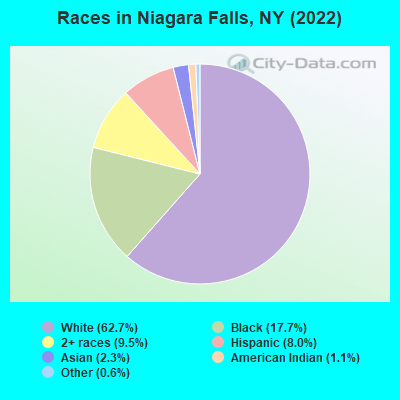
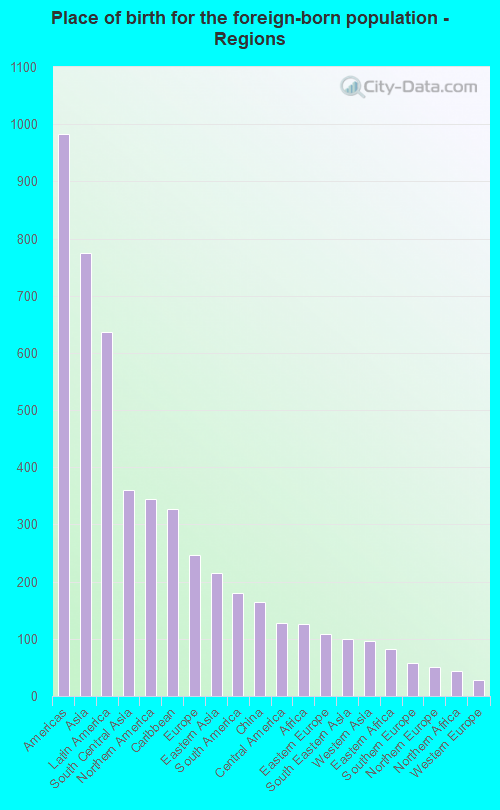
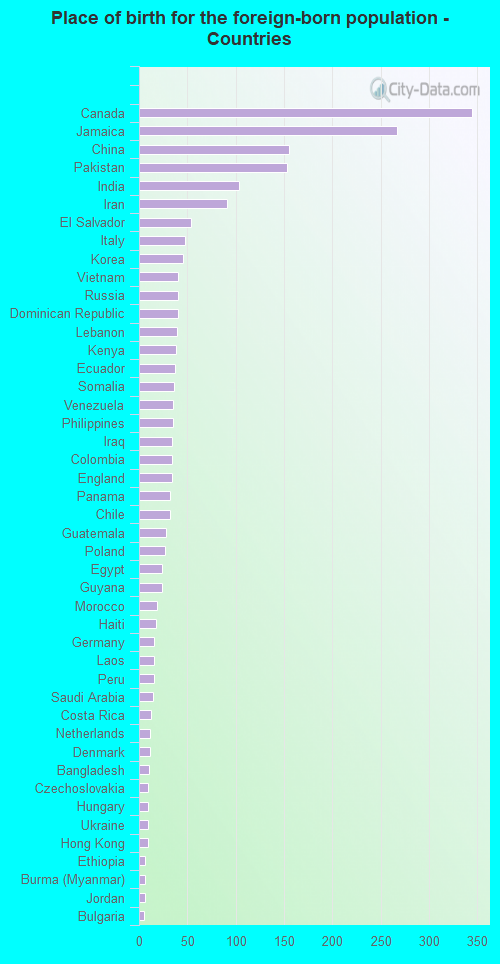
According to 2022 data, the most numerous races in Niagara Falls, NY are White alone (30,233 residents), Hispanic (3,841 residents), and Black alone (8,523 residents). 92.1% of Niagara Falls residents speak English at home. 4.4% of Niagara Falls, NY residents are foreign-born (1.6% born in Asia, 1.3% born in Latin America, 0.7% born in North America, 0.5% born in Europe), which is 397.5% less than the foreign-born rate of 22.0% across the entire state of New York.
Race distribution in Niagara Falls
2000 2022
11,760,981 62.0% White alone 2,867,583 15.1% Hispanic 2,812,623 14.8% Black alone 1,035,926 5.5% Asian alone 366,116 1.9% Two or more races 75,499 0.4% Other race alone 52,499 0.3% American Indian alone 5,230 0.03% Native Hawaiian and Other
10,408,933 52.9% White alone 3,867,299 19.7% Hispanic 2,633,840 13.4% Black alone 1,776,286 9.0% Asian alone 732,670 3.7% Two or more races 216,110 1.1% Other race alone 35,082 0.2% American Indian alone 6,931 0.04% Native Hawaiian and Other
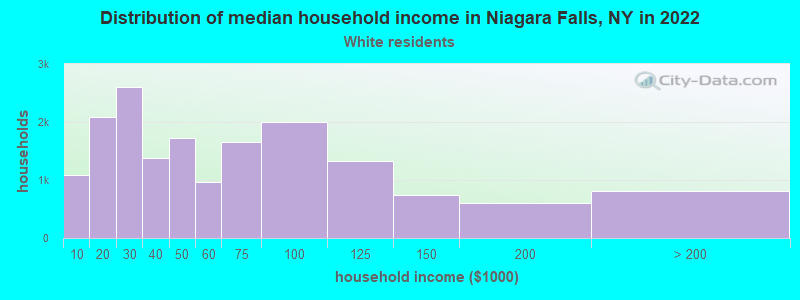
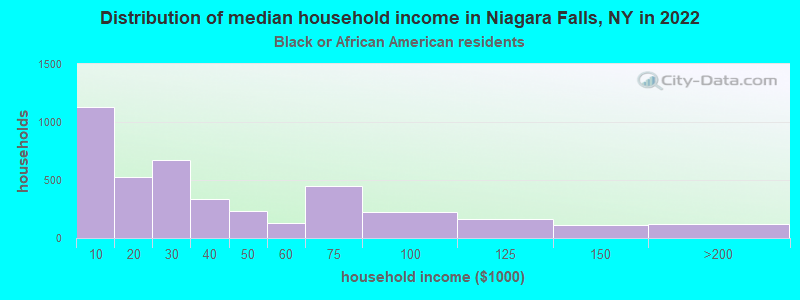
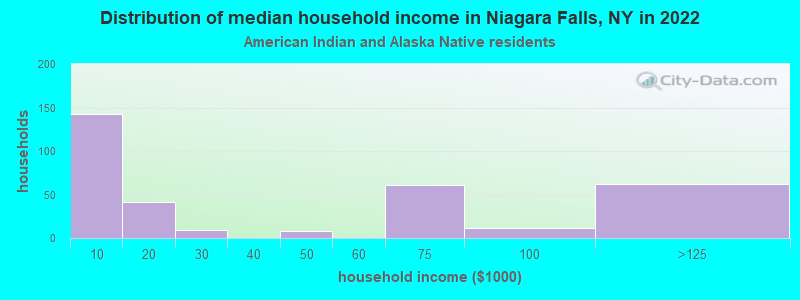
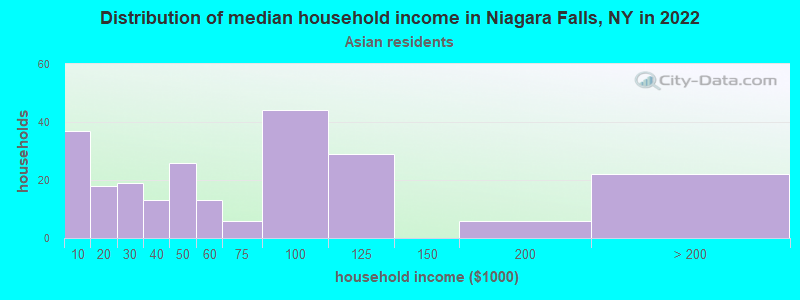
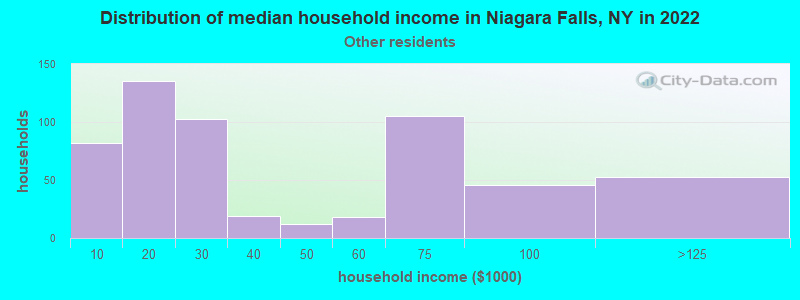
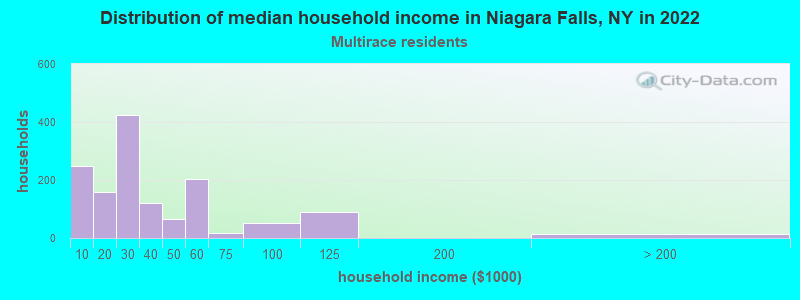
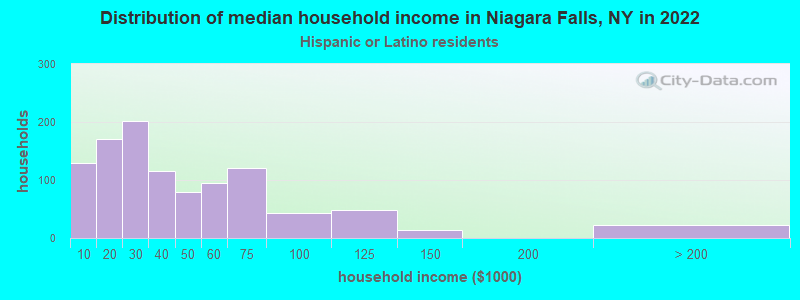
Income and house value in Niagara Falls Median household income in 2022 $50,504 White non-Hispanic householders$17,621 Black householders$45,045 Asian householders$25,229 Some other race householders$34,118 Two or more races householders$33,341 Hispanic or Latino race householdersMedian 2022 house value $117,706 White Non-Hispanic householders$89,183 Black or African American householders$110,671 American Indian or Alaska Native householders $180,648 Asian householders$51,152 Some other race householders$122,080 Two or more races householders$120,559 Hispanic or Latino householders
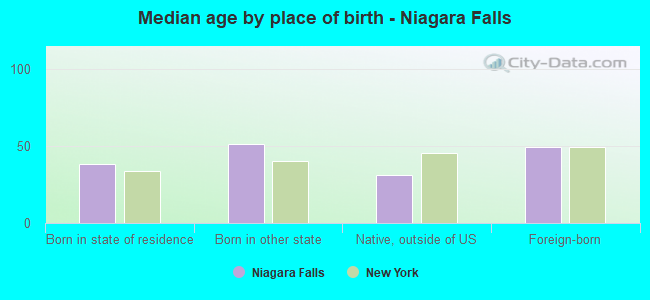
Median age by race in Niagara Falls
46.6 Median age for White residents46.9 46.8 36.6 Median age for Black or African American residents39.6 34.6 37.8 Median age for American Indian / Alaska Native residents34.0 58.5 42.0 Median age for Asian residents54.1 37.1 -487,992,314.6 Median age for Native Hawaiian / Pacific Islander residents-666,666,666.0 -666,666,666.0 27.0 Median age for Other race residents25.8 32.3 13.5 Median age for Two or more races residents13.5 12.6 48.2 Median age for White alone residents47.9 48.7 26.0 Median age for Hispanic or Latino residents27.9 25.6
Owner/renter occupied households by race in Niagara Falls
House owners and renters - White residents 10,530 61.8% Owner occupied6,506 38.2% Renter occupiedHouse owners and renters - Black or African American residents 1,186 27.4% Owner occupied3,148 72.6% Renter occupiedHouse owners and renters - American Indian / Alaska Native residents 118 56.9% Owner occupied90 43.1% Renter occupiedHouse owners and renters - Asian residents 225 79.5% Owner occupied58 20.5% Renter occupiedHouse owners and renters - Other race residents 229 31.5% Owner occupied497 68.5% Renter occupiedHouse owners and renters - Two or more races residents 309 24.4% Owner occupied957 75.6% Renter occupiedHouse owners and renters - White alone residents 10,444 62.4% Owner occupied6,280 37.6% Renter occupiedHouse owners and renters - Hispanic or Latino residents 235 18.8% Owner occupied1,013 81.2% Renter occupied
Language usage in Niagara Falls
English speakers - Total 92.1% of residents of Niagara Falls speak English at home.
3.4% of residents speak Spanish at home 1,109 71.8% Speak English very well435 28.2% Speak English less than very well4.7% of residents speak other language at home 1,048 48.9% Speak English very well1,096 51.1% Speak English less than very well
English speakers - Born in the United States 93.0% of residents of Niagara Falls speak English at home.
3.1% of residents speak Spanish at home 154 87.0% Speak English very well23 13.0% Speak English less than very well2.4% of residents speak other language at home 135 98.5% Speak English very well2 1.5% Speak English less than very well
English speakers - Native, born elsewhere 58.8% of residents of Niagara Falls speak English at home.
33.3% of residents speak Spanish at home 178 71.2% Speak English very well72 28.8% Speak English less than very well12.1% of residents speak other language at home 41 45.1% Speak English very well50 54.9% Speak English less than very well
English speakers - Foreign-born 32.2% of residents of Niagara Falls speak English at home.
13.8% of residents speak Spanish at home 134 33.9% Speak English very well261 66.1% Speak English less than very well54.3% of residents speak other language at home 573 36.8% Speak English very well982 63.2% Speak English less than very well
White (Caucasian) - Speak only English Native:
98.3% (28,762)Foreign-born:
43.2% (445)
White (Caucasian) - Speak another language Native:
1.5% (446)Foreign-born:
57.3% (590)
Black or African American - Speak only English Native:
96.4% (7,930)Foreign-born:
54.3% (342)
Black or African American - Speak another language Native:
2.3% (186)Foreign-born:
45.3% (286)
American Indian / Alaska Native - Speak only English Native:
90.8% (433)Foreign-born:
61.9% (56)
Asian - Speak only English Native:
27.0% (64)Foreign-born:
8.1% (60)
Asian - Speak another language Native:
75.1% (177)Foreign-born:
100.0% (745)
Other race - Speak only English Native:
53.6% (575)Foreign-born:
16.1% (37)
Other race - Speak another language Native:
49.4% (531)Foreign-born:
84.0% (193)
Two or more races - Speak only English Native:
86.1% (3,504)Foreign-born:
0.7% (1)
Two or more races - Speak another language Native:
12.1% (493)Foreign-born:
86.2% (160)
White alone - Speak only English Native:
98.5% (27,973)Foreign-born:
48.0% (445)
White alone - Speak another language Native:
1.4% (388)Foreign-born:
51.8% (480)
Hispanic or Latino - Speak only English Native:
59.3% (1,791)Foreign-born:
9.1% (35)
Hispanic or Latino - Speak another language Native:
39.2% (1,185)Foreign-born:
100.0% (386)
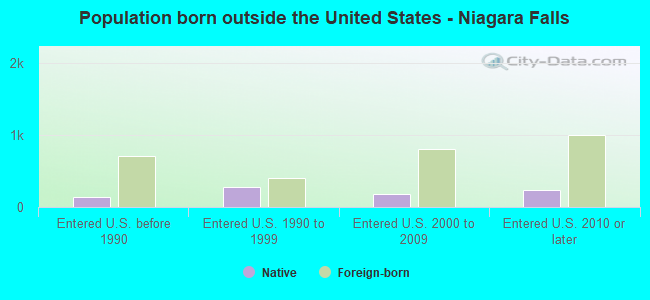
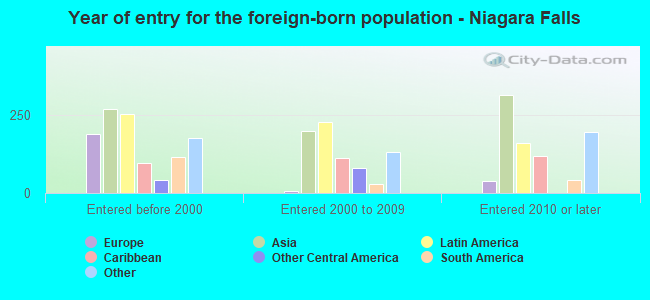
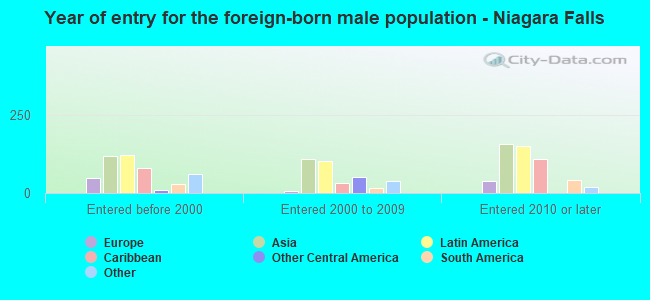
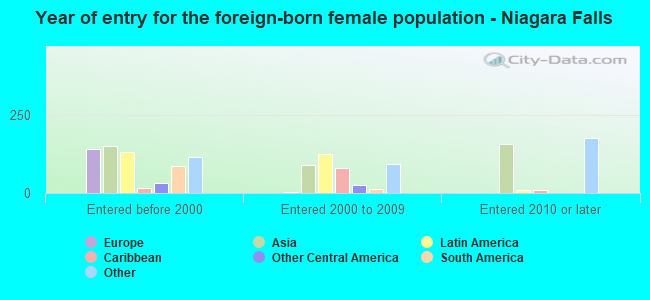
Foreign-born residents in Niagara Falls 2,131 residents are foreign born (1.6% Asia , 1.3% Latin America , 0.7% North America , 0.5% Europe ).
This city:
4.4%New York:
22.6%
Marital status for residents in Niagara Falls Marital status - White (Caucasian) population 15 years and over
Males 39.3% Never married41.2% Now married1.9% Separated4.5% Widowed13.2% DivorcedFemales 33.9% Never married37.5% Now married3.8% Separated10.9% Widowed13.8% DivorcedWomen who gave birth in the past 12 months Now married:
56.5% (154)Unmarried:
43.5% (118)
Women who did not give birth in the past 12 months Now married:
34.6% (2,408)Unmarried:
65.4% (4,549)
Marital status - Black or African American population 15 years and over
Males 61.0% Never married24.1% Now married0.9% Separated4.9% Widowed9.1% DivorcedFemales 61.4% Never married15.2% Now married0.7% Separated10.3% Widowed12.4% DivorcedWomen who gave birth in the past 12 months Now married:
4.7% (7)Unmarried:
95.3% (150)
Women who did not give birth in the past 12 months Now married:
10.1% (192)Unmarried:
89.9% (1,716)
Marital status - American Indian / Alaska Native population 15 years and over
Males 40.4% Never married43.3% Now married2.4% Separated0.0% Widowed13.9% DivorcedFemales 48.2% Never married21.1% Now married8.0% Separated3.0% Widowed19.6% DivorcedWomen who did not give birth in the past 12 months Now married:
24.4% (44)Unmarried:
75.6% (137)
Marital status - Asian population 15 years and over
Males 34.9% Never married55.0% Now married0.0% Separated2.3% Widowed7.8% DivorcedFemales 29.2% Never married50.8% Now married0.0% Separated8.0% Widowed12.0% DivorcedWomen who gave birth in the past 12 months Now married:
100.0% (12)Unmarried:
0.0% (0)
Women who did not give birth in the past 12 months Now married:
45.3% (124)Unmarried:
54.7% (150)
Marital status - Other race population 15 years and over
Males 71.1% Never married15.6% Now married0.0% Separated11.8% Widowed1.5% DivorcedFemales 39.7% Never married31.0% Now married0.2% Separated8.6% Widowed20.5% DivorcedWomen who did not give birth in the past 12 months Now married:
25.8% (74)Unmarried:
74.2% (213)
Marital status - Two or more races population 15 years and over
Males 63.2% Never married22.5% Now married0.0% Separated2.1% Widowed12.2% DivorcedFemales 58.6% Never married22.0% Now married10.0% Separated1.2% Widowed8.2% DivorcedWomen who gave birth in the past 12 months Now married:
8.8% (13)Unmarried:
91.2% (132)
Women who did not give birth in the past 12 months Now married:
34.5% (249)Unmarried:
65.5% (473)
Marital status - White alone, not Hispanic / Latino population 15 years and over
Males 38.2% Never married42.0% Now married1.9% Separated4.6% Widowed13.3% DivorcedFemales 33.3% Never married37.7% Now married3.9% Separated11.1% Widowed14.0% DivorcedWomen who gave birth in the past 12 months Now married:
56.5% (154)Unmarried:
43.5% (119)
Women who did not give birth in the past 12 months Now married:
35.1% (2,363)Unmarried:
64.9% (4,367)
Marital status - Hispanic or Latino population 15 years and over
Males 77.2% Never married10.1% Now married0.0% Separated5.9% Widowed6.8% DivorcedFemales 51.7% Never married29.0% Now married1.9% Separated3.2% Widowed14.1% DivorcedWomen who gave birth in the past 12 months Now married:
0.0% (0)Unmarried:
100.0% (22)
Women who did not give birth in the past 12 months Now married:
27.3% (176)Unmarried:
72.7% (468)
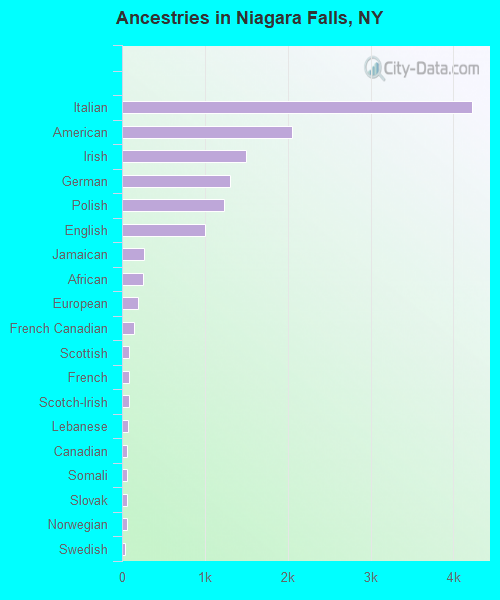
Ancestries in Niagara Falls
4,219 19.0% Italian2,054 9.3% American1,493 6.7% Irish1,306 5.9% German1,229 5.5% Polish997 4.5% English261 1.2% Jamaican249 1.1% African195 0.9% European145 0.7% French Canadian90 0.4% Scottish84 0.4% French81 0.4% Scotch-Irish68 0.3% Lebanese65 0.3% Canadian57 0.3% Somali57 0.3% Slovak55 0.2% Norwegian41 0.2% Swedish38 0.2% Eastern European37 0.2% Greek33 0.1% Iraqi31 0.1% Ukrainian30 0.1% Egyptian30 0.1% Turkish29 0.1% Lithuanian29 0.1% Danish26 0.1% Ghanaian24 0.1% Iranian20 0.09% Moroccan20 0.09% Northern European20 0.09% Nigerian20 0.09% Yugoslavian19 0.09% Croatian18 0.08% Arab17 0.08% Dutch17 0.08% Haitian14 0.06% Armenian12 0.05% Pennsylvania German12 0.05% Welsh11 0.05% Hungarian8 0.04% Ethiopian8 0.04% British7 0.03% Israeli7 0.03% Bulgarian6 0.03% Guyanese4 0.02% Russian3 0.01% Austrian2 0.01% Jordanian
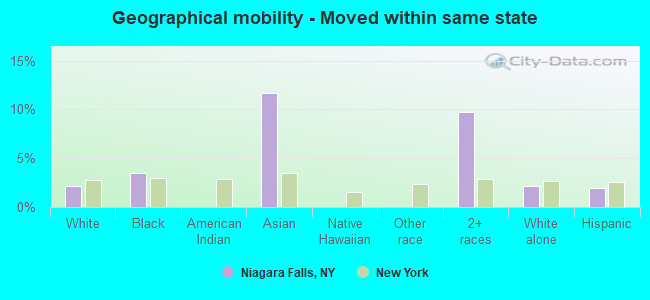
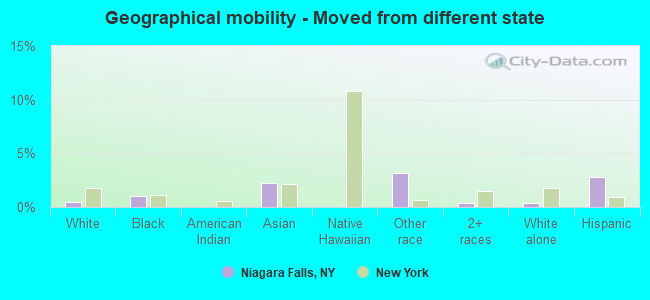
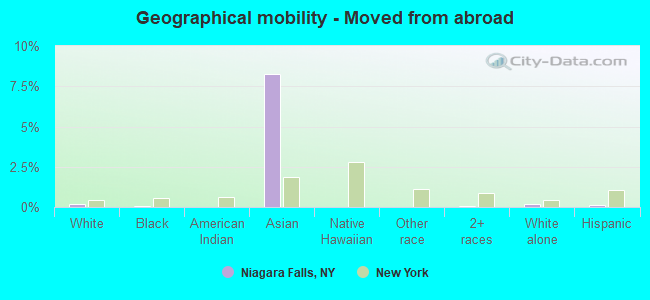
Geographical mobility in Niagara Falls Same house 1 year ago 28,627 92.0% White (Caucasian)7,560 82.5% Black or African American593 95.3% American Indian / Alaska Native630 59.4% Asian11 89.7% Native Hawaiian / Pacific Islander1,221 94.1% Other race5,085 83.3% Two or more races27,592 92.0% White alone, not Hispanic / Latino3,197 91.1% Hispanic or LatinoMoved within same county 1,564 5.0% White / Caucasian679 7.4% Black or African American33 5.3% American Indian / Alaska Native210 19.9% Asian36 2.8% Other race392 6.4% Two or more races1,521 5.1% White alone, not Hispanic / Latino133 3.8% Hispanic or LatinoMoved within same state 668 2.1% White / Caucasian318 3.5% Black or African American124 11.7% Asian597 9.8% Two or more races650 2.2% White alone, not Hispanic / Latino69 2.0% Hispanic or LatinoMoved from different state 137 0.4% White / Caucasian95 1.0% Black or African American24 2.3% Asian41 3.1% Other race25 0.4% Two or more races122 0.4% White alone, not Hispanic / Latino99 2.8% Hispanic or LatinoMoved from abroad 52 0.2% White7 0.1% Black or African American87 8.2% Asian5 0.1% Two or more races52 0.2% White alone, not Hispanic / Latino4 0.1% Hispanic or Latino
Children Nativity (place of birth) in Niagara Falls
Children under 6 years - Living with two parents Both parents native 1,236 100.0% Native0 0.0% Foreign-bornBoth parents foreign-born 27 78.0% Native8 22.0% Foreign-bornOne native, one foreign-born parent 39 100.0% NativeChildren under 6 years - Living with one parent Native parent 1,920 100.0% NativeForeign-born parent 19 100.0% NativeChildren 6 to 17 years - Living with two parents Both parents native 2,141 99.2% Native17 0.8% Foreign-bornBoth parents foreign-born 185 76.9% Native56 23.1% Foreign-bornOne native, one foreign-born parent 74 83.9% Native14 16.1% Foreign-bornChildren 6 to 17 years - Living with one parent Native parent 3,640 100.0% NativeForeign-born parent 103 55.9% Native81 44.1% Foreign-born
Grandparents responsible for own grandchildren in Niagara Falls
Grandparents (30 to 59 years) White / Caucasian 29 35.0% Responsible for grandchildren54 65.0% Not responsible for grandchildrenBlack or African American 33 61.8% Responsible for grandchildren20 38.2% Not responsible for grandchildrenTwo or more races 70 82.6% Responsible for grandchildren15 17.4% Not responsible for grandchildrenWhite alone, not Hispanic / Latino 31 32.7% Responsible for grandchildren63 67.3% Not responsible for grandchildrenHispanic or Latino 32 100.0% Responsible for grandchildrenGrandparents (60 years and over) White / Caucasian 49 21.8% Responsible for grandchildren175 78.2% Not responsible for grandchildrenBlack or African American 25 33.6% Responsible for grandchildren49 66.4% Not responsible for grandchildrenWhite alone, not Hispanic / Latino 52 23.0% Responsible for grandchildren176 77.0% Not responsible for grandchildrenHispanic or Latino 12 100.0% Not responsible for grandchildren