Races in Niagara, New York (NY) Detailed Stats
Ancestries, Foreign-born residents, place of birth
3.6% of Niagara, NY residents are foreign-born (1.9% born in Europe, 1.4% born in North America), which is 519.2% less than the foreign-born rate of 22.0% across the entire state of New York.
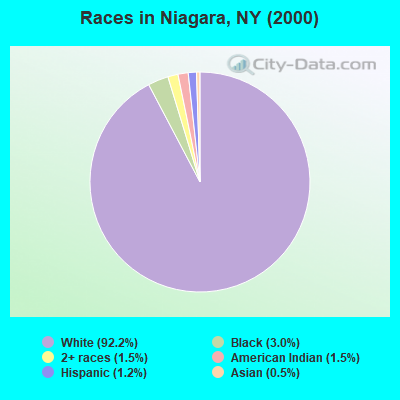
Race distribution in Niagara

- 8,28092.2%White alone
- 2693.0%Black alone
- 1351.5%Two or more races
- 1321.5%American Indian alone
- 1051.2%Hispanic
- 480.5%Asian alone
- 80.09%Other race alone
- 10.01%Native Hawaiian and Other
Pacific Islander alone
2000
2022
-
- 11,760,98162.0%White alone
- 2,867,58315.1%Hispanic
- 2,812,62314.8%Black alone
- 1,035,9265.5%Asian alone
- 366,1161.9%Two or more races
- 75,4990.4%Other race alone
- 52,4990.3%American Indian alone
- 5,2300.03%Native Hawaiian and Other
Pacific Islander alone

-
- 10,408,93352.9%White alone
- 3,867,29919.7%Hispanic
- 2,633,84013.4%Black alone
- 1,776,2869.0%Asian alone
- 732,6703.7%Two or more races
- 216,1101.1%Other race alone
- 35,0820.2%American Indian alone
- 6,9310.04%Native Hawaiian and Other
Pacific Islander alone

Income and house value in Niagara
- Median household income in 2022
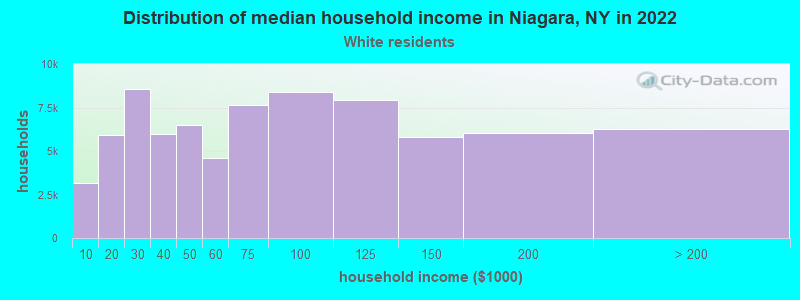
- $62,402White non-Hispanic householders
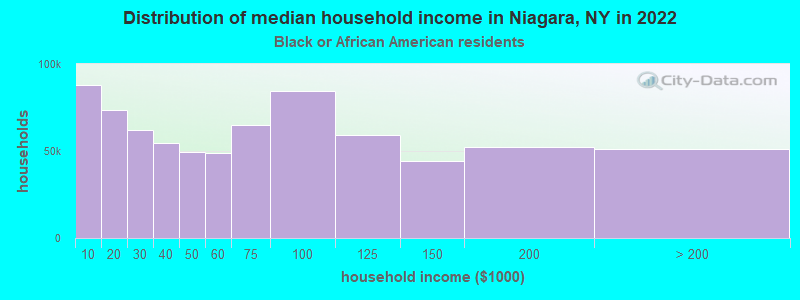
- $50,145Black householders
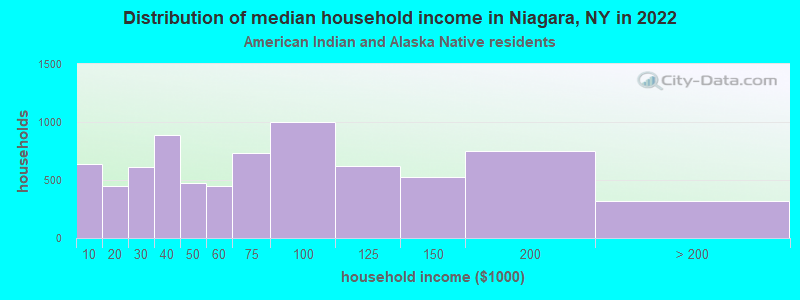
- $42,412American Indian and Alaska Native householders
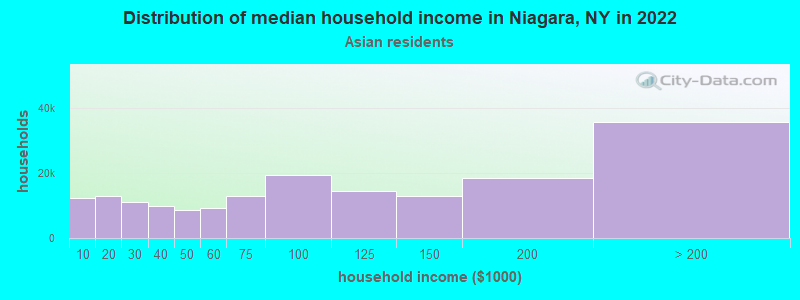
- $35,999Asian householders
- $24,234Some other race householders
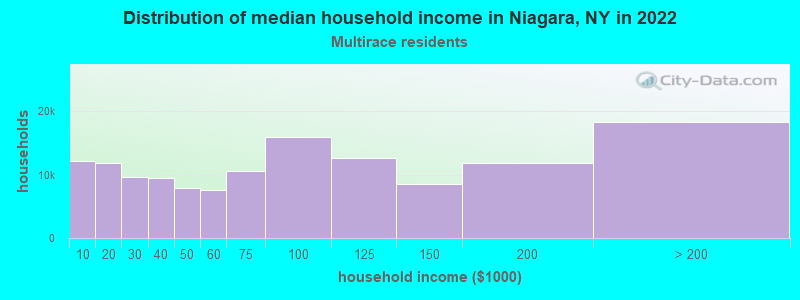
- $27,003Two or more races householders
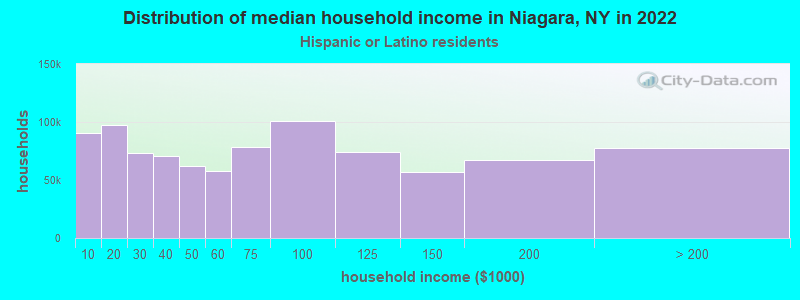
- $82,512Hispanic or Latino race householders
- Median 2022 house value
- $196,914White Non-Hispanic householders
- $176,791Black or African American householders
- $145,409American Indian or Alaska Native householders
- $89,833Some other race householders
- $203,621Two or more races householders
- $155,710Hispanic or Latino householders
Household income for White non-Hispanic householders
Household income for Black householders
Household income for American Indian and Alaska Native householders
Household income for Asian householders
Household income for Two or more races householders
Household income for Hispanic or Latino race householders
Foreign-born residents in Niagara
319 residents are foreign born (1.9% Europe, 1.4% North America).
| This city: | 3.6% |
| New York: | 20.4% |
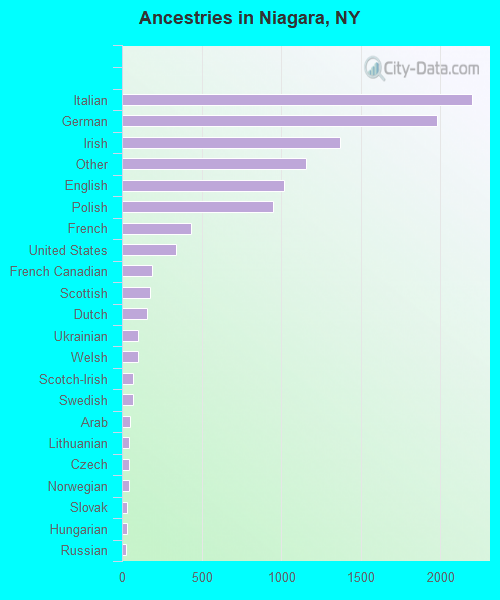
Ancestries in Niagara

- 2,19720.7%Italian
- 1,97818.6%German
- 1,36812.9%Irish
- 1,15610.9%Other
- 1,0209.6%English
- 9478.9%Polish
- 4334.1%French
- 3393.2%United States
- 1891.8%French Canadian
- 1761.7%Scottish
- 1561.5%Dutch
- 1011.0%Ukrainian
- 990.9%Welsh
- 720.7%Scotch-Irish
- 720.7%Swedish
- 480.5%Arab
- 460.4%Lithuanian
- 410.4%Czech
- 410.4%Norwegian
- 340.3%Slovak
- 290.3%Hungarian
- 250.2%Russian
- 130.1%Subsaharan African
- 110.1%Portuguese
- 100.09%Danish
- 80.08%Swiss
- 80.08%West Indian
Zip codes: 14304.