Races in Nibley, Utah (UT) Detailed Stats
Data:
Races - White alone (%)
Races - White alone (% change since 2000)
Races - Black alone (%)
Races - Black alone (% change since 2000)
Races - American Indian alone (%)
Races - American Indian alone (% change since 2000)
Races - Asian alone (%)
Races - Asian alone (% change since 2000)
Races - Hispanic (%)
Races - Hispanic (% change since 2000)
Races - Native Hawaiian and Other Pacific Islander alone (%)
Races - Native Hawaiian and Other Pacific Islander alone (% change since 2000)
Races - Two or more races(%)
Races - Two or more races(% change since 2000)
Races - Other race alone (%)
Races - Other race alone (% change since 2000)
Racial diversity
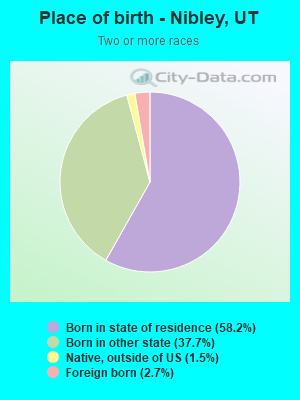
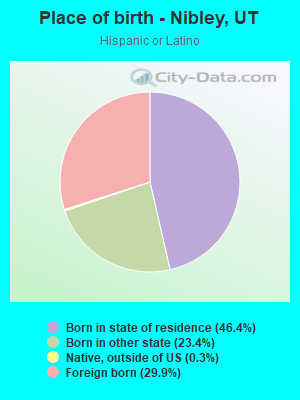
Place of birth - Born in state of residence (%)
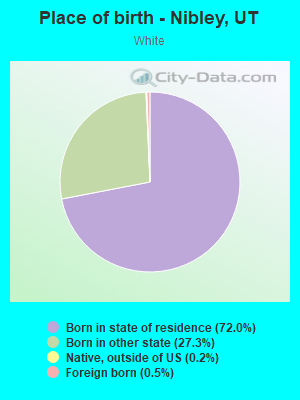
Place of birth - Born in state of residence (%) - White
Place of birth - Born in state of residence (%) - Black or African American
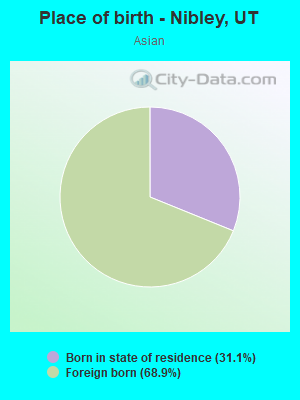
Place of birth - Born in state of residence (%) - Asian
Place of birth - Born in state of residence (%) - Hispanic or Latino
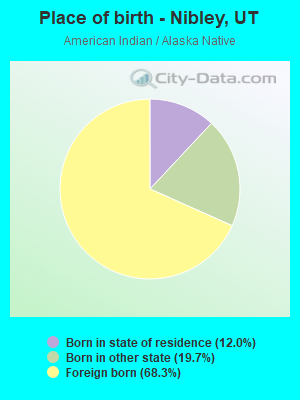
Place of birth - Born in state of residence (%) - American Indian and Alaska Native
Place of birth - Born in state of residence (%) - Multirace
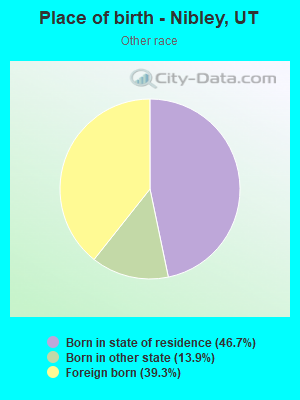
Place of birth - Born in state of residence (%) - Other Race
Place of birth - Born in other state (%)
Place of birth - Born in other state (%) - White
Place of birth - Born in other state (%) - Black or African American
Place of birth - Born in other state (%) - Asian
Place of birth - Born in other state (%) - Hispanic or Latino
Place of birth - Born in other state (%) - American Indian and Alaska Native
Place of birth - Born in other state (%) - Multirace
Place of birth - Born in other state (%) - Other Race
Place of birth - Native, outside of US (%)
Place of birth - Native, outside of US (%) - White
Place of birth - Native, outside of US (%) - Black or African American
Place of birth - Native, outside of US (%) - Asian
Place of birth - Native, outside of US (%) - Hispanic or Latino
Place of birth - Native, outside of US (%) - American Indian and Alaska Native
Place of birth - Native, outside of US (%) - Multirace
Place of birth - Native, outside of US (%) - Other Race
Place of birth - Foreign born (%)
Place of birth - Foreign born (%) - White
Place of birth - Foreign born (%) - Black or African American
Place of birth - Foreign born (%) - Asian
Place of birth - Foreign born (%) - Hispanic or Latino
Place of birth - Foreign born (%) - American Indian and Alaska Native
Place of birth - Foreign born (%) - Multirace
Place of birth - Foreign born (%) - Other Race
Residents speaking English at home (%)
Residents speaking English at home - Born in the United States (%)
Residents speaking English at home - Native, born elsewhere (%)
Residents speaking English at home - Foreign born (%)
Residents speaking Spanish at home (%)
Residents speaking Spanish at home - Born in the United States (%)
Residents speaking Spanish at home - Native, born elsewhere (%)
Residents speaking Spanish at home - Foreign born (%)
Residents speaking other language at home (%)
Residents speaking other language at home - Born in the United States (%)
Residents speaking other language at home - Native, born elsewhere (%)
Residents speaking other language at home - Foreign born (%)
Marital status - Never married (%)
Marital status - Now married (%)
Marital status - Separated (%)
Marital status - Widowed (%)
Marital status - Divorced (%)
Ancestries Reported - Arab (%)
Ancestries Reported - Czech (%)
Ancestries Reported - Danish (%)
Ancestries Reported - Dutch (%)
Ancestries Reported - English (%)
Ancestries Reported - French (%)
Ancestries Reported - French Canadian (%)
Ancestries Reported - German (%)
Ancestries Reported - Greek (%)
Ancestries Reported - Hungarian (%)
Ancestries Reported - Irish (%)
Ancestries Reported - Italian (%)
Ancestries Reported - Lithuanian (%)
Ancestries Reported - Norwegian (%)
Ancestries Reported - Polish (%)
Ancestries Reported - Portuguese (%)
Ancestries Reported - Russian (%)
Ancestries Reported - Scotch-Irish (%)
Ancestries Reported - Scottish (%)
Ancestries Reported - Slovak (%)
Ancestries Reported - Subsaharan African (%)
Ancestries Reported - Swedish (%)
Ancestries Reported - Swiss (%)
Ancestries Reported - Ukrainian (%)
Ancestries Reported - United States (%)
Ancestries Reported - Welsh (%)
Ancestries Reported - West Indian (%)
Ancestries Reported - Other (%)
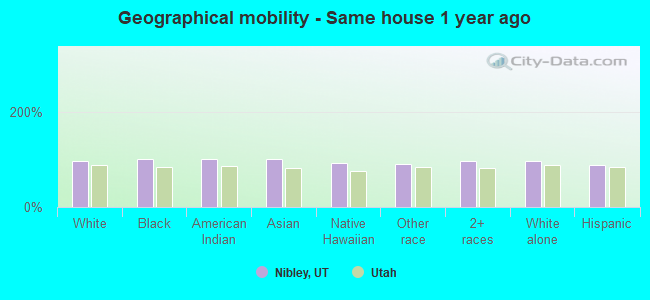
Geographical mobility - Same house 1 year ago (%)
Geographical mobility - Same house 1 year ago (%) - White
Geographical mobility - Same house 1 year ago (%) - Black or African American
Geographical mobility - Same house 1 year ago (%) - Asian
Geographical mobility - Same house 1 year ago (%) - Hispanic or Latino
Geographical mobility - Same house 1 year ago (%) - American Indian and Alaska Native
Geographical mobility - Same house 1 year ago (%) - Multirace
Geographical mobility - Same house 1 year ago (%) - Other Race
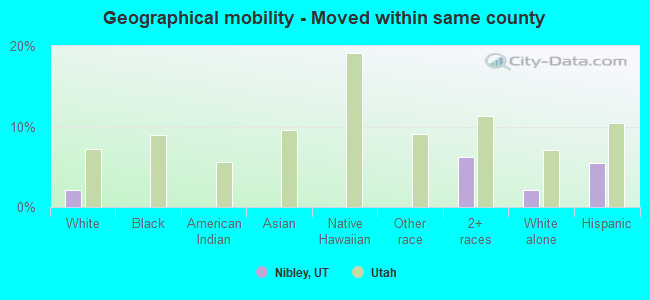
Geographical mobility - Moved within same county (%)
Geographical mobility - Moved within same county (%) - White
Geographical mobility - Moved within same county (%) - Black or African American
Geographical mobility - Moved within same county (%) - Asian
Geographical mobility - Moved within same county (%) - Hispanic or Latino
Geographical mobility - Moved within same county (%) - American Indian and Alaska Native
Geographical mobility - Moved within same county (%) - Multirace
Geographical mobility - Moved within same county (%) - Other Race
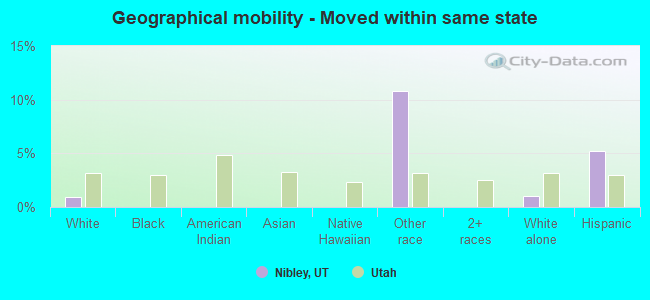
Geographical mobility - Moved from different county within same state (%)
Geographical mobility - Moved from different county within same state (%) - White
Geographical mobility - Moved from different county within same state (%) - Black or African American
Geographical mobility - Moved from different county within same state (%) - Asian
Geographical mobility - Moved from different county within same state (%) - Hispanic or Latino
Geographical mobility - Moved from different county within same state (%) - American Indian and Alaska Native
Geographical mobility - Moved from different county within same state (%) - Multirace
Geographical mobility - Moved from different county within same state (%) - Other Race
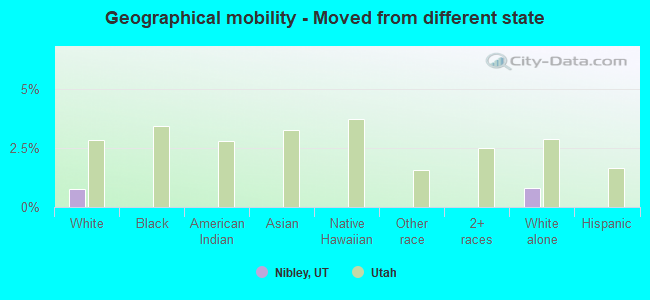
Geographical mobility - Moved from different state (%)
Geographical mobility - Moved from different state (%) - White
Geographical mobility - Moved from different state (%) - Black or African American
Geographical mobility - Moved from different state (%) - Asian
Geographical mobility - Moved from different state (%) - Hispanic or Latino
Geographical mobility - Moved from different state (%) - American Indian and Alaska Native
Geographical mobility - Moved from different state (%) - Multirace
Geographical mobility - Moved from different state (%) - Other Race
Geographical mobility - Moved from abroad (%)
Geographical mobility - Moved from abroad (%) - White
Geographical mobility - Moved from abroad (%) - Black or African American
Geographical mobility - Moved from abroad (%) - Asian
Geographical mobility - Moved from abroad (%) - Hispanic or Latino
Geographical mobility - Moved from abroad (%) - American Indian and Alaska Native
Geographical mobility - Moved from abroad (%) - Multirace
Geographical mobility - Moved from abroad (%) - Other Race
Place of birth for the foreign-born population - Ireland (%)
Place of birth for the foreign-born population - Denmark (%)
Place of birth for the foreign-born population - Norway (%)
Place of birth for the foreign-born population - Sweden (%)
Place of birth for the foreign-born population - United Kingdom (%)
Place of birth for the foreign-born population - England (%)
Place of birth for the foreign-born population - Scotland (%)
Place of birth for the foreign-born population - Other Northern Europe (%)
Place of birth for the foreign-born population - Austria (%)
Place of birth for the foreign-born population - Belgium (%)
Place of birth for the foreign-born population - France (%)
Place of birth for the foreign-born population - Germany (%)
Place of birth for the foreign-born population - Netherlands (%)
Place of birth for the foreign-born population - Switzerland (%)
Place of birth for the foreign-born population - Other Western Europe (%)
Place of birth for the foreign-born population - Greece (%)
Place of birth for the foreign-born population - Italy (%)
Place of birth for the foreign-born population - Portugal (%)
Place of birth for the foreign-born population - Spain (%)
Place of birth for the foreign-born population - Other Southern Europe (%)
Place of birth for the foreign-born population - Albania (%)
Place of birth for the foreign-born population - Belarus (%)
Place of birth for the foreign-born population - Bosnia and Herzegovina (%)
Place of birth for the foreign-born population - Bulgaria (%)
Place of birth for the foreign-born population - Croatia (%)
Place of birth for the foreign-born population - Czechoslovakia (%)
Place of birth for the foreign-born population - Hungary (%)
Place of birth for the foreign-born population - Latvia (%)
Place of birth for the foreign-born population - Lithuania (%)
Place of birth for the foreign-born population - North Macedonia (Macedonia) (%)
Place of birth for the foreign-born population - Moldova (%)
Place of birth for the foreign-born population - Poland (%)
Place of birth for the foreign-born population - Romania (%)
Place of birth for the foreign-born population - Russia (%)
Place of birth for the foreign-born population - Serbia (%)
Place of birth for the foreign-born population - Ukraine (%)
Place of birth for the foreign-born population - Other Eastern Europe (%)
Place of birth for the foreign-born population - China (%)
Place of birth for the foreign-born population - Hong Kong (%)
Place of birth for the foreign-born population - Taiwan (%)
Place of birth for the foreign-born population - Japan (%)
Place of birth for the foreign-born population - Korea (%)
Place of birth for the foreign-born population - Other Eastern Asia (%)
Place of birth for the foreign-born population - Afghanistan (%)
Place of birth for the foreign-born population - Bangladesh (%)
Place of birth for the foreign-born population - India (%)
Place of birth for the foreign-born population - Iran (%)
Place of birth for the foreign-born population - Kazakhstan (%)
Place of birth for the foreign-born population - Nepal (%)
Place of birth for the foreign-born population - Pakistan (%)
Place of birth for the foreign-born population - Sri Lanka (%)
Place of birth for the foreign-born population - Uzbekistan (%)
Place of birth for the foreign-born population - Other South Central Asia (%)
Place of birth for the foreign-born population - Burma (%)
Place of birth for the foreign-born population - Cambodia (%)
Place of birth for the foreign-born population - Indonesia (%)
Place of birth for the foreign-born population - Laos (%)
Place of birth for the foreign-born population - Malaysia (%)
Place of birth for the foreign-born population - Philippines (%)
Place of birth for the foreign-born population - Singapore (%)
Place of birth for the foreign-born population - Thailand (%)
Place of birth for the foreign-born population - Vietnam (%)
Place of birth for the foreign-born population - Other South Eastern Asia (%)
Place of birth for the foreign-born population - Armenia (%)
Place of birth for the foreign-born population - Iraq (%)
Place of birth for the foreign-born population - Israel (%)
Place of birth for the foreign-born population - Jordan (%)
Place of birth for the foreign-born population - Kuwait (%)
Place of birth for the foreign-born population - Lebanon (%)
Place of birth for the foreign-born population - Saudi Arabia (%)
Place of birth for the foreign-born population - Syria (%)
Place of birth for the foreign-born population - Turkey (%)
Place of birth for the foreign-born population - Yemen (%)
Place of birth for the foreign-born population - Other Western Asia (%)
Place of birth for the foreign-born population - Eritrea (%)
Place of birth for the foreign-born population - Ethiopia (%)
Place of birth for the foreign-born population - Kenya (%)
Place of birth for the foreign-born population - Somalia (%)
Place of birth for the foreign-born population - Uganda (%)
Place of birth for the foreign-born population - Zimbabwe (%)
Place of birth for the foreign-born population - Other Eastern Africa (%)
Place of birth for the foreign-born population - Cameroon (%)
Place of birth for the foreign-born population - Congo (%)
Place of birth for the foreign-born population - Democratic Republic of Congo (Zaire) (%)
Place of birth for the foreign-born population - Other Middle Africa (%)
Place of birth for the foreign-born population - Egypt (%)
Place of birth for the foreign-born population - Morocco (%)
Place of birth for the foreign-born population - Sudan (%)
Place of birth for the foreign-born population - Other Northern Africa (%)
Place of birth for the foreign-born population - South Africa (%)
Place of birth for the foreign-born population - Other Southern Africa (%)
Place of birth for the foreign-born population - Cabo Verde (%)
Place of birth for the foreign-born population - Ghana (%)
Place of birth for the foreign-born population - Liberia (%)
Place of birth for the foreign-born population - Nigeria (%)
Place of birth for the foreign-born population - Senegal (%)
Place of birth for the foreign-born population - Sierra Leone (%)
Place of birth for the foreign-born population - Other Western Africa (%)
Place of birth for the foreign-born population - Australia (%)
Place of birth for the foreign-born population - New Zealand (%)
Place of birth for the foreign-born population - Fiji (%)
Place of birth for the foreign-born population - Micronesia (%)
Place of birth for the foreign-born population - Bahamas (%)
Place of birth for the foreign-born population - Barbados (%)
Place of birth for the foreign-born population - Cuba (%)
Place of birth for the foreign-born population - Dominica (%)
Place of birth for the foreign-born population - Dominican Republic (%)
Place of birth for the foreign-born population - Grenada (%)
Place of birth for the foreign-born population - Haiti (%)
Place of birth for the foreign-born population - Jamaica (%)
Place of birth for the foreign-born population - St. Vincent and the Grenadines (%)
Place of birth for the foreign-born population - Trinidad and Tobago (%)
Place of birth for the foreign-born population - West Indies (%)
Place of birth for the foreign-born population - Other Caribbean (%)
Place of birth for the foreign-born population - Belize (%)
Place of birth for the foreign-born population - Costa Rica (%)
Place of birth for the foreign-born population - El Salvador (%)
Place of birth for the foreign-born population - Guatemala (%)
Place of birth for the foreign-born population - Honduras (%)
Place of birth for the foreign-born population - Mexico (%)
Place of birth for the foreign-born population - Nicaragua (%)
Place of birth for the foreign-born population - Panama (%)
Place of birth for the foreign-born population - Other Central America (%)
Place of birth for the foreign-born population - Argentina (%)
Place of birth for the foreign-born population - Bolivia (%)
Place of birth for the foreign-born population - Brazil (%)
Place of birth for the foreign-born population - Chile (%)
Place of birth for the foreign-born population - Colombia (%)
Place of birth for the foreign-born population - Ecuador (%)
Place of birth for the foreign-born population - Guyana (%)
Place of birth for the foreign-born population - Peru (%)
Place of birth for the foreign-born population - Uruguay (%)
Place of birth for the foreign-born population - Venezuela (%)
Place of birth for the foreign-born population - Other South America (%)
Place of birth for the foreign-born population - Canada (%)
Place of birth for the foreign-born population - Other Northern America (%)
Place of birth for the foreign-born population - Other (%)
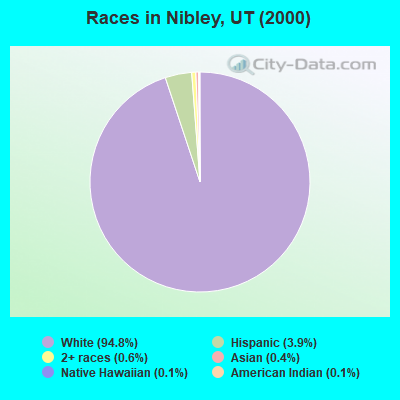
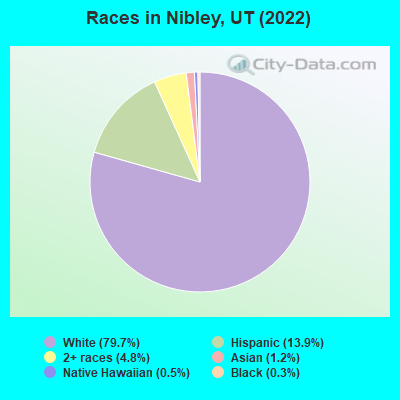
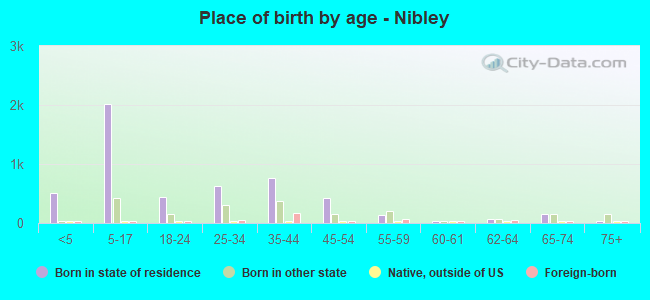
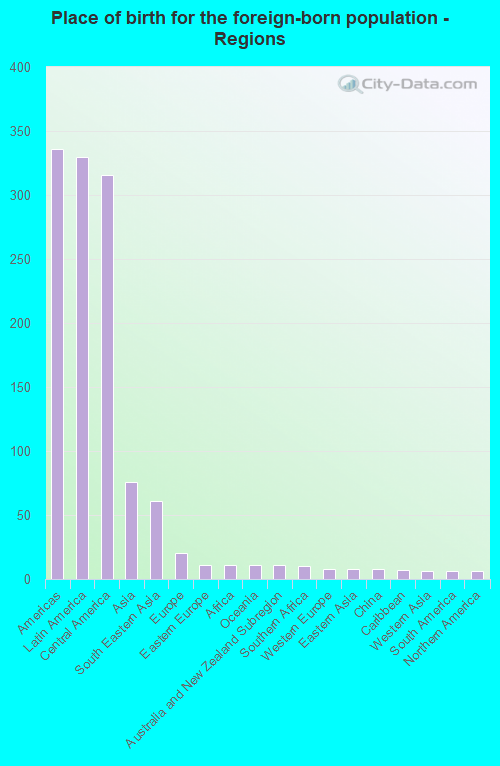
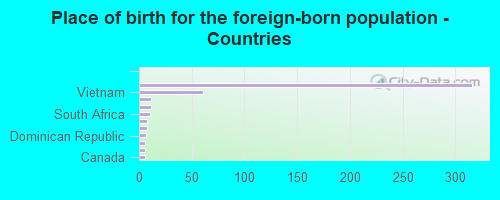
According to 2022 data, the most numerous races in Nibley, UT are White alone (6,131 residents), Hispanic (1,065 residents), and Two or more races (369 residents). 90.6% of Nibley residents speak English at home. 5.9% of Nibley, UT residents are foreign-born (4.2% born in Latin America, 1.0% born in Asia), which is 34.9% less than the foreign-born rate of 8.0% across the entire state of Utah.
Race distribution in Nibley
2000 2022
1,904,265 85.3% White alone 201,559 9.0% Hispanic 36,483 1.6% Asian alone 31,308 1.4% Two or more races 26,663 1.2% American Indian alone 14,806 0.7% Native Hawaiian and Other 16,137 0.7% Black alone 1,948 0.09% Other race alone
2,557,466 75.6% White alone 512,086 15.1% Hispanic 119,308 3.5% Two or more races 82,388 2.4% Asian alone 36,978 1.1% Native Hawaiian and Other 34,873 1.0% Black alone 22,803 0.7% American Indian alone 14,898 0.4% Other race alone
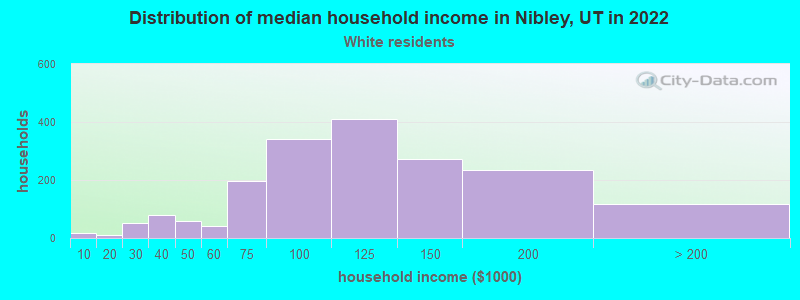
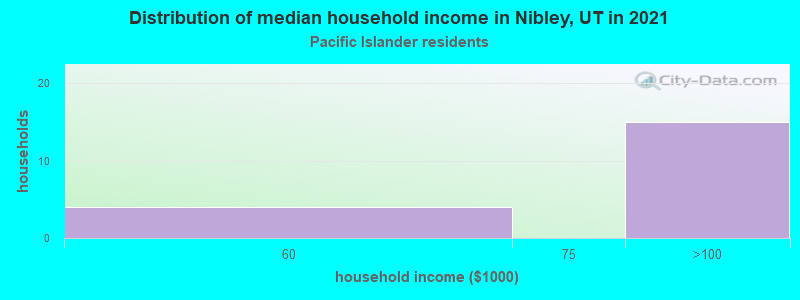
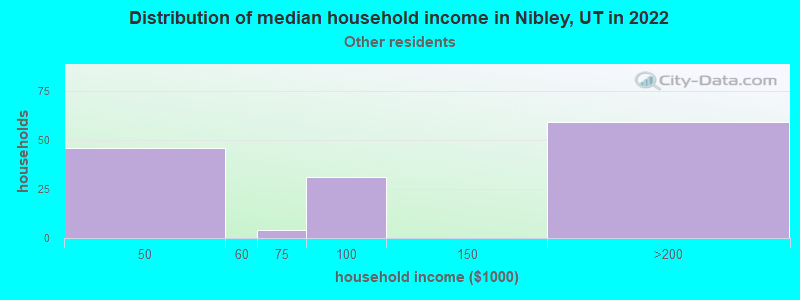
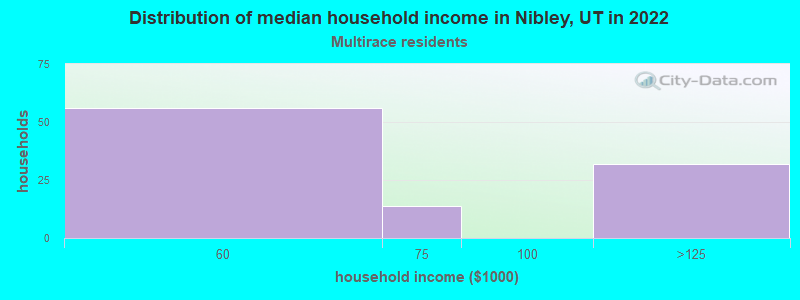
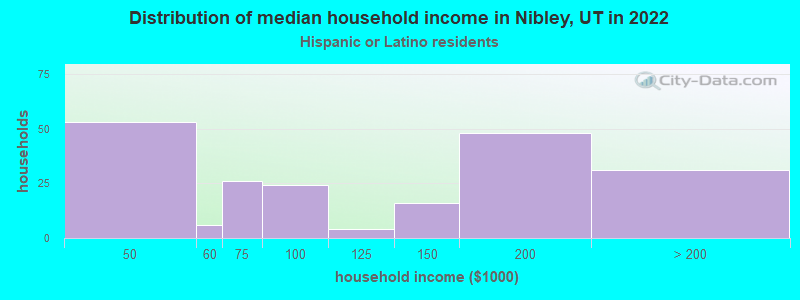
Income and house value in Nibley Median household income in 2022 $110,097 White non-Hispanic householders$52,104 Two or more races householdersMedian 2022 house value $497,211 White Non-Hispanic householders $463,816 Asian householders$442,902 Some other race householders$463,816 Hispanic or Latino householders
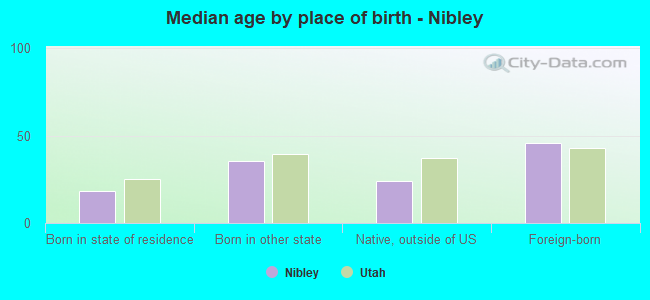
Median age by race in Nibley
28.3 Median age for White residents32.0 24.8 -503,105,589.6 Median age for Black or African American residents-656,596,172.6 -661,040,787.0 48.7 Median age for American Indian / Alaska Native residents-720,955,482.4 46.3 37.4 Median age for Asian residents55.5 30.1 28.4 Median age for Native Hawaiian / Pacific Islander residents-1,076,305,219.8 -664,285,713.6 21.7 Median age for Other race residents19.3 41.1 11.8 Median age for Two or more races residents11.6 15.5 28.8 Median age for White alone residents34.2 25.4 23.2 Median age for Hispanic or Latino residents18.5 24.8
Owner/renter occupied households by race in Nibley
House owners and renters - White residents 1,675 93.3% Owner occupied121 6.7% Renter occupiedHouse owners and renters - American Indian / Alaska Native residents 17 100.0% Owner occupiedHouse owners and renters - Asian residents 20 100.0% Owner occupiedHouse owners and renters - Native Hawaiian / Pacific Islander residents 26 100.0% Owner occupiedHouse owners and renters - Other race residents 77 49.8% Owner occupied78 50.2% Renter occupiedHouse owners and renters - Two or more races residents 123 100.0% Owner occupiedHouse owners and renters - White alone residents 1,680 94.2% Owner occupied103 5.8% Renter occupiedHouse owners and renters - Hispanic or Latino residents 102 52.1% Owner occupied93 47.9% Renter occupied
Language usage in Nibley
English speakers - Total 90.6% of residents of Nibley speak English at home.
6.6% of residents speak Spanish at home 332 70.6% Speak English very well138 29.4% Speak English less than very well2.9% of residents speak other language at home 186 90.3% Speak English very well20 9.7% Speak English less than very well
English speakers - Born in the United States 93.7% of residents of Nibley speak English at home.
5.1% of residents speak Spanish at home 105 100.0% Speak English very well1.4% of residents speak other language at home 28 100.0% Speak English very well
English speakers - Native, born elsewhere 84.6% of residents of Nibley speak English at home.
30.8% of residents speak Spanish at home 4 100.0% Speak English very well
English speakers - Foreign-born 31.5% of residents of Nibley speak English at home.
46.6% of residents speak Spanish at home 48 25.9% Speak English very well137 74.1% Speak English less than very well16.9% of residents speak other language at home 51 76.1% Speak English very well16 23.9% Speak English less than very well
White (Caucasian) - Speak only English Native:
94.7% (5,519)Foreign-born:
85.1% (30)
White (Caucasian) - Speak another language Native:
5.2% (303)Foreign-born:
47.2% (16)
American Indian / Alaska Native - Speak another language Native:
50.5% (12)Foreign-born:
96.1% (49)
Asian - Speak another language Native:
87.4% (31)Foreign-born:
88.0% (42)
Other race - Speak only English Native:
100.0% (357)Foreign-born:
62.6% (166)
Two or more races - Speak only English Native:
95.4% (393)Foreign-born:
9.1% (1)
Two or more races - Speak another language Native:
5.6% (23)Foreign-born:
89.6% (11)
White alone - Speak only English Native:
96.2% (5,443)Foreign-born:
75.2% (28)
White alone - Speak another language Native:
4.0% (224)Foreign-born:
21.2% (8)
Hispanic or Latino - Speak only English Native:
78.3% (517)Foreign-born:
30.5% (96)
Hispanic or Latino - Speak another language Native:
24.2% (160)Foreign-born:
64.4% (203)
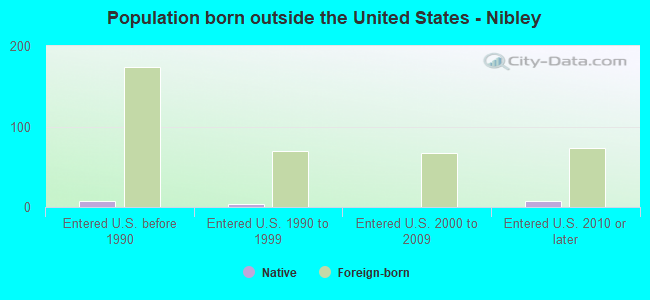
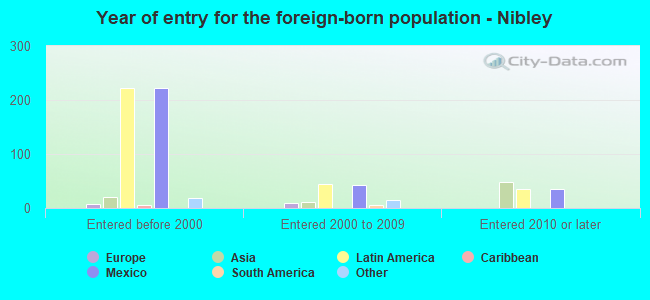
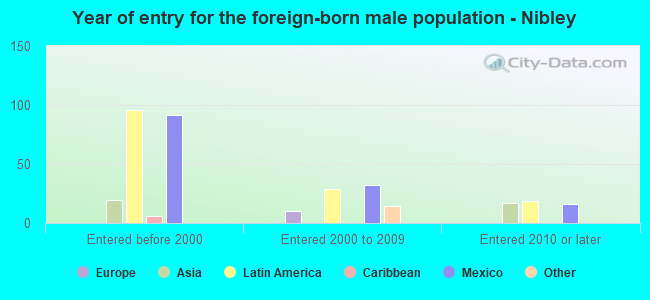
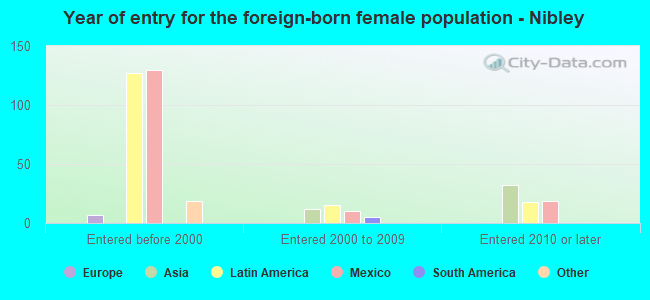
Foreign-born residents in Nibley 456 residents are foreign born (4.2% Latin America , 1.0% Asia ).
Marital status for residents in Nibley Marital status - White (Caucasian) population 15 years and over
Males 26.1% Never married65.7% Now married2.0% Separated2.5% Widowed3.8% DivorcedFemales 22.4% Never married66.1% Now married0.7% Separated3.1% Widowed7.7% DivorcedWomen who gave birth in the past 12 months Now married:
100.0% (86)Unmarried:
0.0% (0)
Women who did not give birth in the past 12 months Now married:
64.1% (936)Unmarried:
35.9% (525)
Marital status - American Indian / Alaska Native population 15 years and over
Males 100.0% Never married0.0% Now married0.0% Separated0.0% Widowed0.0% DivorcedFemales 60.6% Never married39.4% Now married0.0% Separated0.0% Widowed0.0% DivorcedWomen who did not give birth in the past 12 months Now married:
0.0% (0)Unmarried:
100.0% (22)
Marital status - Asian population 15 years and over
Males 0.0% Never married100.0% Now married0.0% Separated0.0% Widowed0.0% DivorcedFemales 0.0% Never married100.0% Now married0.0% Separated0.0% Widowed0.0% DivorcedWomen who gave birth in the past 12 months Now married:
100.0% (12)Unmarried:
0.0% (0)
Marital status - Native Hawaiian / Pacific Islander population 15 years and over
Males 42.1% Never married57.9% Now married0.0% Separated0.0% Widowed0.0% DivorcedFemales 53.3% Never married46.7% Now married0.0% Separated0.0% Widowed0.0% DivorcedWomen who gave birth in the past 12 months Now married:
100.0% (9)Unmarried:
0.0% (0)
Women who did not give birth in the past 12 months Now married:
0.0% (0)Unmarried:
100.0% (10)
Marital status - Other race population 15 years and over
Males 39.0% Never married61.0% Now married0.0% Separated0.0% Widowed0.0% DivorcedFemales 45.3% Never married43.7% Now married0.0% Separated11.0% Widowed0.0% DivorcedWomen who did not give birth in the past 12 months Now married:
33.7% (79)Unmarried:
66.3% (156)
Marital status - Two or more races population 15 years and over
Males 12.8% Never married87.2% Now married0.0% Separated0.0% Widowed0.0% DivorcedFemales 25.3% Never married55.7% Now married0.0% Separated0.0% Widowed19.0% DivorcedWomen who did not give birth in the past 12 months Now married:
68.8% (58)Unmarried:
31.2% (27)
Marital status - White alone, not Hispanic / Latino population 15 years and over
Males 25.2% Never married66.3% Now married2.1% Separated2.6% Widowed3.9% DivorcedFemales 23.3% Never married64.8% Now married0.8% Separated3.2% Widowed8.0% DivorcedWomen who gave birth in the past 12 months Now married:
100.0% (78)Unmarried:
0.0% (0)
Women who did not give birth in the past 12 months Now married:
62.8% (906)Unmarried:
37.2% (536)
Marital status - Hispanic or Latino population 15 years and over
Males 49.5% Never married50.5% Now married0.0% Separated0.0% Widowed0.0% DivorcedFemales 36.6% Never married54.2% Now married0.0% Separated7.7% Widowed1.4% DivorcedWomen who gave birth in the past 12 months Now married:
100.0% (11)Unmarried:
0.0% (0)
Women who did not give birth in the past 12 months Now married:
45.8% (140)Unmarried:
54.2% (165)
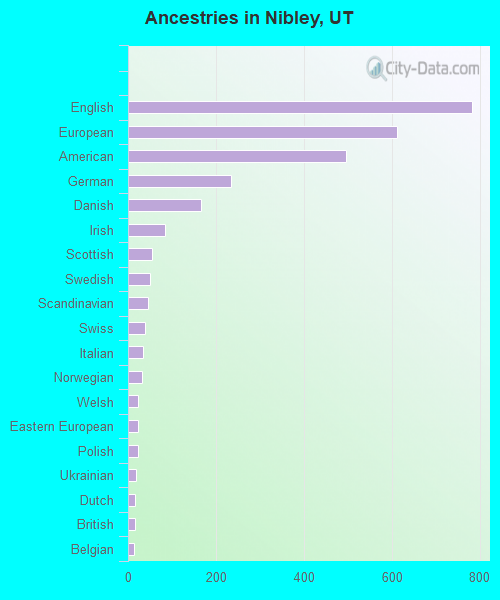
Ancestries in Nibley
781 22.6% English612 17.7% European495 14.3% American234 6.8% German166 4.8% Danish85 2.5% Irish54 1.6% Scottish51 1.5% Swedish45 1.3% Scandinavian38 1.1% Swiss35 1.0% Italian31 0.9% Norwegian23 0.7% Welsh22 0.6% Eastern European22 0.6% Polish19 0.6% Ukrainian16 0.5% Dutch15 0.4% British13 0.4% Belgian7 0.2% Armenian5 0.1% French Canadian4 0.1% Scotch-Irish3 0.09% Canadian
Children Nativity (place of birth) in Nibley
Children under 6 years - Living with two parents Both parents native 625 100.0% NativeBoth parents foreign-born 15 100.0% NativeOne native, one foreign-born parent 9 100.0% NativeChildren under 6 years - Living with one parent Native parent 18 100.0% NativeChildren 6 to 17 years - Living with two parents Both parents native 1,760 98.4% Native29 1.6% Foreign-bornBoth parents foreign-born 194 100.0% NativeOne native, one foreign-born parent 74 100.0% NativeChildren 6 to 17 years - Living with one parent Native parent 221 100.0% NativeForeign-born parent 26 50.7% Native25 49.3% Foreign-born
Grandparents responsible for own grandchildren in Nibley
Grandparents (30 to 59 years) White / Caucasian 8 100.0% Not responsible for grandchildrenWhite alone, not Hispanic / Latino 8 100.0% Not responsible for grandchildren
Grandparents (60 years and over) White / Caucasian 41 100.0% Not responsible for grandchildrenWhite alone, not Hispanic / Latino 42 100.0% Not responsible for grandchildren