Races in Nicholasville, Kentucky (KY) Detailed Stats
Data:
Races - White alone (%)
Races - White alone (% change since 2000)
Races - Black alone (%)
Races - Black alone (% change since 2000)
Races - American Indian alone (%)
Races - American Indian alone (% change since 2000)
Races - Asian alone (%)
Races - Asian alone (% change since 2000)
Races - Hispanic (%)
Races - Hispanic (% change since 2000)
Races - Native Hawaiian and Other Pacific Islander alone (%)
Races - Native Hawaiian and Other Pacific Islander alone (% change since 2000)
Races - Two or more races(%)
Races - Two or more races(% change since 2000)
Races - Other race alone (%)
Races - Other race alone (% change since 2000)
Racial diversity
Place of birth - Born in state of residence (%)
Place of birth - Born in state of residence (%) - White
Place of birth - Born in state of residence (%) - Black or African American
Place of birth - Born in state of residence (%) - Asian
Place of birth - Born in state of residence (%) - Hispanic or Latino
Place of birth - Born in state of residence (%) - American Indian and Alaska Native
Place of birth - Born in state of residence (%) - Multirace
Place of birth - Born in state of residence (%) - Other Race
Place of birth - Born in other state (%)
Place of birth - Born in other state (%) - White
Place of birth - Born in other state (%) - Black or African American
Place of birth - Born in other state (%) - Asian
Place of birth - Born in other state (%) - Hispanic or Latino
Place of birth - Born in other state (%) - American Indian and Alaska Native
Place of birth - Born in other state (%) - Multirace
Place of birth - Born in other state (%) - Other Race
Place of birth - Native, outside of US (%)
Place of birth - Native, outside of US (%) - White
Place of birth - Native, outside of US (%) - Black or African American
Place of birth - Native, outside of US (%) - Asian
Place of birth - Native, outside of US (%) - Hispanic or Latino
Place of birth - Native, outside of US (%) - American Indian and Alaska Native
Place of birth - Native, outside of US (%) - Multirace
Place of birth - Native, outside of US (%) - Other Race
Place of birth - Foreign born (%)
Place of birth - Foreign born (%) - White
Place of birth - Foreign born (%) - Black or African American
Place of birth - Foreign born (%) - Asian
Place of birth - Foreign born (%) - Hispanic or Latino
Place of birth - Foreign born (%) - American Indian and Alaska Native
Place of birth - Foreign born (%) - Multirace
Place of birth - Foreign born (%) - Other Race
Residents speaking English at home (%)
Residents speaking English at home - Born in the United States (%)
Residents speaking English at home - Native, born elsewhere (%)
Residents speaking English at home - Foreign born (%)
Residents speaking Spanish at home (%)
Residents speaking Spanish at home - Born in the United States (%)
Residents speaking Spanish at home - Native, born elsewhere (%)
Residents speaking Spanish at home - Foreign born (%)
Residents speaking other language at home (%)
Residents speaking other language at home - Born in the United States (%)
Residents speaking other language at home - Native, born elsewhere (%)
Residents speaking other language at home - Foreign born (%)
Marital status - Never married (%)
Marital status - Now married (%)
Marital status - Separated (%)
Marital status - Widowed (%)
Marital status - Divorced (%)
Ancestries Reported - Arab (%)
Ancestries Reported - Czech (%)
Ancestries Reported - Danish (%)
Ancestries Reported - Dutch (%)
Ancestries Reported - English (%)
Ancestries Reported - French (%)
Ancestries Reported - French Canadian (%)
Ancestries Reported - German (%)
Ancestries Reported - Greek (%)
Ancestries Reported - Hungarian (%)
Ancestries Reported - Irish (%)
Ancestries Reported - Italian (%)
Ancestries Reported - Lithuanian (%)
Ancestries Reported - Norwegian (%)
Ancestries Reported - Polish (%)
Ancestries Reported - Portuguese (%)
Ancestries Reported - Russian (%)
Ancestries Reported - Scotch-Irish (%)
Ancestries Reported - Scottish (%)
Ancestries Reported - Slovak (%)
Ancestries Reported - Subsaharan African (%)
Ancestries Reported - Swedish (%)
Ancestries Reported - Swiss (%)
Ancestries Reported - Ukrainian (%)
Ancestries Reported - United States (%)
Ancestries Reported - Welsh (%)
Ancestries Reported - West Indian (%)
Ancestries Reported - Other (%)
Geographical mobility - Same house 1 year ago (%)
Geographical mobility - Same house 1 year ago (%) - White
Geographical mobility - Same house 1 year ago (%) - Black or African American
Geographical mobility - Same house 1 year ago (%) - Asian
Geographical mobility - Same house 1 year ago (%) - Hispanic or Latino
Geographical mobility - Same house 1 year ago (%) - American Indian and Alaska Native
Geographical mobility - Same house 1 year ago (%) - Multirace
Geographical mobility - Same house 1 year ago (%) - Other Race
Geographical mobility - Moved within same county (%)
Geographical mobility - Moved within same county (%) - White
Geographical mobility - Moved within same county (%) - Black or African American
Geographical mobility - Moved within same county (%) - Asian
Geographical mobility - Moved within same county (%) - Hispanic or Latino
Geographical mobility - Moved within same county (%) - American Indian and Alaska Native
Geographical mobility - Moved within same county (%) - Multirace
Geographical mobility - Moved within same county (%) - Other Race
Geographical mobility - Moved from different county within same state (%)
Geographical mobility - Moved from different county within same state (%) - White
Geographical mobility - Moved from different county within same state (%) - Black or African American
Geographical mobility - Moved from different county within same state (%) - Asian
Geographical mobility - Moved from different county within same state (%) - Hispanic or Latino
Geographical mobility - Moved from different county within same state (%) - American Indian and Alaska Native
Geographical mobility - Moved from different county within same state (%) - Multirace
Geographical mobility - Moved from different county within same state (%) - Other Race
Geographical mobility - Moved from different state (%)
Geographical mobility - Moved from different state (%) - White
Geographical mobility - Moved from different state (%) - Black or African American
Geographical mobility - Moved from different state (%) - Asian
Geographical mobility - Moved from different state (%) - Hispanic or Latino
Geographical mobility - Moved from different state (%) - American Indian and Alaska Native
Geographical mobility - Moved from different state (%) - Multirace
Geographical mobility - Moved from different state (%) - Other Race
Geographical mobility - Moved from abroad (%)
Geographical mobility - Moved from abroad (%) - White
Geographical mobility - Moved from abroad (%) - Black or African American
Geographical mobility - Moved from abroad (%) - Asian
Geographical mobility - Moved from abroad (%) - Hispanic or Latino
Geographical mobility - Moved from abroad (%) - American Indian and Alaska Native
Geographical mobility - Moved from abroad (%) - Multirace
Geographical mobility - Moved from abroad (%) - Other Race
Place of birth for the foreign-born population - Ireland (%)
Place of birth for the foreign-born population - Denmark (%)
Place of birth for the foreign-born population - Norway (%)
Place of birth for the foreign-born population - Sweden (%)
Place of birth for the foreign-born population - United Kingdom (%)
Place of birth for the foreign-born population - England (%)
Place of birth for the foreign-born population - Scotland (%)
Place of birth for the foreign-born population - Other Northern Europe (%)
Place of birth for the foreign-born population - Austria (%)
Place of birth for the foreign-born population - Belgium (%)
Place of birth for the foreign-born population - France (%)
Place of birth for the foreign-born population - Germany (%)
Place of birth for the foreign-born population - Netherlands (%)
Place of birth for the foreign-born population - Switzerland (%)
Place of birth for the foreign-born population - Other Western Europe (%)
Place of birth for the foreign-born population - Greece (%)
Place of birth for the foreign-born population - Italy (%)
Place of birth for the foreign-born population - Portugal (%)
Place of birth for the foreign-born population - Spain (%)
Place of birth for the foreign-born population - Other Southern Europe (%)
Place of birth for the foreign-born population - Albania (%)
Place of birth for the foreign-born population - Belarus (%)
Place of birth for the foreign-born population - Bosnia and Herzegovina (%)
Place of birth for the foreign-born population - Bulgaria (%)
Place of birth for the foreign-born population - Croatia (%)
Place of birth for the foreign-born population - Czechoslovakia (%)
Place of birth for the foreign-born population - Hungary (%)
Place of birth for the foreign-born population - Latvia (%)
Place of birth for the foreign-born population - Lithuania (%)
Place of birth for the foreign-born population - North Macedonia (Macedonia) (%)
Place of birth for the foreign-born population - Moldova (%)
Place of birth for the foreign-born population - Poland (%)
Place of birth for the foreign-born population - Romania (%)
Place of birth for the foreign-born population - Russia (%)
Place of birth for the foreign-born population - Serbia (%)
Place of birth for the foreign-born population - Ukraine (%)
Place of birth for the foreign-born population - Other Eastern Europe (%)
Place of birth for the foreign-born population - China (%)
Place of birth for the foreign-born population - Hong Kong (%)
Place of birth for the foreign-born population - Taiwan (%)
Place of birth for the foreign-born population - Japan (%)
Place of birth for the foreign-born population - Korea (%)
Place of birth for the foreign-born population - Other Eastern Asia (%)
Place of birth for the foreign-born population - Afghanistan (%)
Place of birth for the foreign-born population - Bangladesh (%)
Place of birth for the foreign-born population - India (%)
Place of birth for the foreign-born population - Iran (%)
Place of birth for the foreign-born population - Kazakhstan (%)
Place of birth for the foreign-born population - Nepal (%)
Place of birth for the foreign-born population - Pakistan (%)
Place of birth for the foreign-born population - Sri Lanka (%)
Place of birth for the foreign-born population - Uzbekistan (%)
Place of birth for the foreign-born population - Other South Central Asia (%)
Place of birth for the foreign-born population - Burma (%)
Place of birth for the foreign-born population - Cambodia (%)
Place of birth for the foreign-born population - Indonesia (%)
Place of birth for the foreign-born population - Laos (%)
Place of birth for the foreign-born population - Malaysia (%)
Place of birth for the foreign-born population - Philippines (%)
Place of birth for the foreign-born population - Singapore (%)
Place of birth for the foreign-born population - Thailand (%)
Place of birth for the foreign-born population - Vietnam (%)
Place of birth for the foreign-born population - Other South Eastern Asia (%)
Place of birth for the foreign-born population - Armenia (%)
Place of birth for the foreign-born population - Iraq (%)
Place of birth for the foreign-born population - Israel (%)
Place of birth for the foreign-born population - Jordan (%)
Place of birth for the foreign-born population - Kuwait (%)
Place of birth for the foreign-born population - Lebanon (%)
Place of birth for the foreign-born population - Saudi Arabia (%)
Place of birth for the foreign-born population - Syria (%)
Place of birth for the foreign-born population - Turkey (%)
Place of birth for the foreign-born population - Yemen (%)
Place of birth for the foreign-born population - Other Western Asia (%)
Place of birth for the foreign-born population - Eritrea (%)
Place of birth for the foreign-born population - Ethiopia (%)
Place of birth for the foreign-born population - Kenya (%)
Place of birth for the foreign-born population - Somalia (%)
Place of birth for the foreign-born population - Uganda (%)
Place of birth for the foreign-born population - Zimbabwe (%)
Place of birth for the foreign-born population - Other Eastern Africa (%)
Place of birth for the foreign-born population - Cameroon (%)
Place of birth for the foreign-born population - Congo (%)
Place of birth for the foreign-born population - Democratic Republic of Congo (Zaire) (%)
Place of birth for the foreign-born population - Other Middle Africa (%)
Place of birth for the foreign-born population - Egypt (%)
Place of birth for the foreign-born population - Morocco (%)
Place of birth for the foreign-born population - Sudan (%)
Place of birth for the foreign-born population - Other Northern Africa (%)
Place of birth for the foreign-born population - South Africa (%)
Place of birth for the foreign-born population - Other Southern Africa (%)
Place of birth for the foreign-born population - Cabo Verde (%)
Place of birth for the foreign-born population - Ghana (%)
Place of birth for the foreign-born population - Liberia (%)
Place of birth for the foreign-born population - Nigeria (%)
Place of birth for the foreign-born population - Senegal (%)
Place of birth for the foreign-born population - Sierra Leone (%)
Place of birth for the foreign-born population - Other Western Africa (%)
Place of birth for the foreign-born population - Australia (%)
Place of birth for the foreign-born population - New Zealand (%)
Place of birth for the foreign-born population - Fiji (%)
Place of birth for the foreign-born population - Micronesia (%)
Place of birth for the foreign-born population - Bahamas (%)
Place of birth for the foreign-born population - Barbados (%)
Place of birth for the foreign-born population - Cuba (%)
Place of birth for the foreign-born population - Dominica (%)
Place of birth for the foreign-born population - Dominican Republic (%)
Place of birth for the foreign-born population - Grenada (%)
Place of birth for the foreign-born population - Haiti (%)
Place of birth for the foreign-born population - Jamaica (%)
Place of birth for the foreign-born population - St. Vincent and the Grenadines (%)
Place of birth for the foreign-born population - Trinidad and Tobago (%)
Place of birth for the foreign-born population - West Indies (%)
Place of birth for the foreign-born population - Other Caribbean (%)
Place of birth for the foreign-born population - Belize (%)
Place of birth for the foreign-born population - Costa Rica (%)
Place of birth for the foreign-born population - El Salvador (%)
Place of birth for the foreign-born population - Guatemala (%)
Place of birth for the foreign-born population - Honduras (%)
Place of birth for the foreign-born population - Mexico (%)
Place of birth for the foreign-born population - Nicaragua (%)
Place of birth for the foreign-born population - Panama (%)
Place of birth for the foreign-born population - Other Central America (%)
Place of birth for the foreign-born population - Argentina (%)
Place of birth for the foreign-born population - Bolivia (%)
Place of birth for the foreign-born population - Brazil (%)
Place of birth for the foreign-born population - Chile (%)
Place of birth for the foreign-born population - Colombia (%)
Place of birth for the foreign-born population - Ecuador (%)
Place of birth for the foreign-born population - Guyana (%)
Place of birth for the foreign-born population - Peru (%)
Place of birth for the foreign-born population - Uruguay (%)
Place of birth for the foreign-born population - Venezuela (%)
Place of birth for the foreign-born population - Other South America (%)
Place of birth for the foreign-born population - Canada (%)
Place of birth for the foreign-born population - Other Northern America (%)
Place of birth for the foreign-born population - Other (%)
Latest news about races in Nicholasville, KY collected exclusively by city-data.com from local newspapers, TV, and radio stations
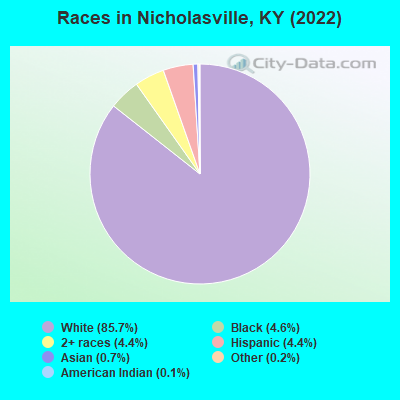
According to 2022 data, the most numerous races in Nicholasville, KY are White alone (26,933 residents), Black alone (1,440 residents), and Hispanic (1,382 residents). 93.3% of Nicholasville residents speak English at home. 3.6% of Nicholasville, KY residents are foreign-born (1.6% born in Latin America, 0.9% born in Europe, 0.8% born in Asia), which is 11.0% less than the foreign-born rate of 4.0% across the entire state of Kentucky.
Race distribution in Nicholasville
2000 2022
3,608,013 89.3% White alone 293,639 7.3% Black alone 59,939 1.5% Hispanic 37,750 0.9% Two or more races 29,368 0.7% Asian alone 7,939 0.2% American Indian alone 3,846 0.10% Other race alone 1,275 0.03% Native Hawaiian and Other
3,710,998 82.2% White alone 343,194 7.6% Black alone 187,483 4.2% Hispanic 187,394 4.2% Two or more races 62,240 1.4% Asian alone 13,529 0.3% Other race alone 4,302 0.10% American Indian alone 3,170 0.07% Native Hawaiian and Other
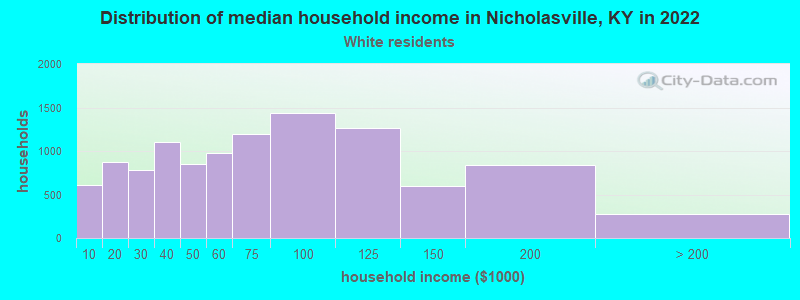
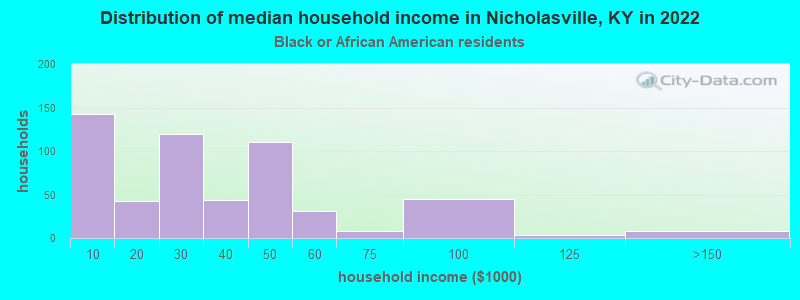
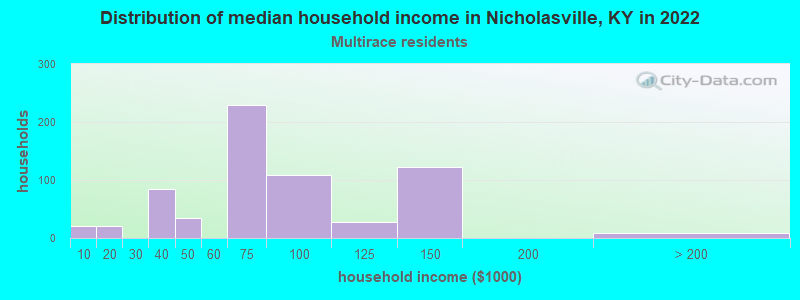
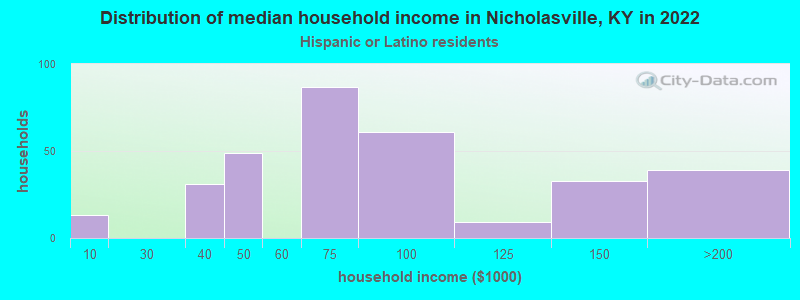
Income and house value in Nicholasville Median household income in 2022 $62,558 White non-Hispanic householders$26,863 Black householders$76,972 Two or more races householders$73,470 Hispanic or Latino race householdersMedian 2022 house value $211,320 White Non-Hispanic householders$162,945 Black or African American householders$260,389 American Indian or Alaska Native householders $282,146 Asian householders$231,457 Two or more races householders$68,279 Hispanic or Latino householders
Median age by race in Nicholasville
38.9 Median age for White residents38.1 39.9 40.6 Median age for Black or African American residents47.5 36.4 28.7 Median age for American Indian / Alaska Native residents-607,449,856.1 -630,065,358.8 36.1 Median age for Asian residents-688,492,062.8 -727,630,284.4 -755,186,721.2 Median age for Native Hawaiian / Pacific Islander residents-724,043,715.1 -853,801,168.7 27.1 Median age for Other race residents21.8 49.9 29.4 Median age for Two or more races residents33.7 20.0 39.1 Median age for White alone residents38.4 40.2 28.4 Median age for Hispanic or Latino residents28.6 25.8
Owner/renter occupied households by race in Nicholasville
House owners and renters - White residents 7,133 66.1% Owner occupied3,657 33.9% Renter occupiedHouse owners and renters - Black or African American residents 55 10.1% Owner occupied490 89.9% Renter occupiedHouse owners and renters - American Indian / Alaska Native residents 8 100.0% Renter occupiedHouse owners and renters - Asian residents 24 100.0% Owner occupiedHouse owners and renters - Other race residents 47 100.0% Renter occupiedHouse owners and renters - Two or more races residents 290 48.6% Owner occupied307 51.4% Renter occupiedHouse owners and renters - White alone residents 7,088 65.9% Owner occupied3,669 34.1% Renter occupiedHouse owners and renters - Hispanic or Latino residents 155 49.9% Owner occupied156 50.1% Renter occupied
Language usage in Nicholasville
English speakers - Total 93.3% of residents of Nicholasville speak English at home.
3.4% of residents speak Spanish at home 385 38.3% Speak English very well620 61.7% Speak English less than very well3.3% of residents speak other language at home 765 79.9% Speak English very well193 20.1% Speak English less than very well
English speakers - Born in the United States 95.1% of residents of Nicholasville speak English at home.
3.5% of residents speak Spanish at home 75 31.2% Speak English very well165 68.8% Speak English less than very well1.3% of residents speak other language at home 90 100.0% Speak English very well
English speakers - Native, born elsewhere 69.1% of residents of Nicholasville speak English at home.
5.6% of residents speak Spanish at home 10 100.0% Speak English less than very well27.0% of residents speak other language at home 6 12.5% Speak English very well42 87.5% Speak English less than very well
English speakers - Foreign-born 7.3% of residents of Nicholasville speak English at home.
42.9% of residents speak Spanish at home 111 24.1% Speak English very well350 75.9% Speak English less than very well49.2% of residents speak other language at home 392 74.1% Speak English very well137 25.9% Speak English less than very well
White (Caucasian) - Speak only English Native:
96.7% (24,419)Foreign-born:
8.0% (24)
White (Caucasian) - Speak another language Native:
3.3% (821)Foreign-born:
84.1% (254)
Other race - Speak only English Native:
77.1% (92)Foreign-born:
14.1% (23)
Other race - Speak another language Native:
27.1% (32)Foreign-born:
86.3% (140)
Two or more races - Speak only English Native:
98.2% (1,356)Foreign-born:
3.6% (14)
Two or more races - Speak another language Native:
0.9% (13)Foreign-born:
95.6% (386)
White alone - Speak only English Native:
96.6% (24,041)Foreign-born:
3.5% (10)
White alone - Speak another language Native:
3.6% (888)Foreign-born:
91.6% (271)
Hispanic or Latino - Speak only English Native:
91.8% (705)Foreign-born:
4.4% (21)
Hispanic or Latino - Speak another language Native:
9.9% (76)Foreign-born:
95.7% (456)
Foreign-born residents in Nicholasville 1,132 residents are foreign born (1.6% Latin America , 0.9% Europe , 0.8% Asia ).
This city:
3.6%Kentucky:
4.1%
Marital status for residents in Nicholasville Marital status - White (Caucasian) population 15 years and over
Males 28.5% Never married56.2% Now married0.9% Separated4.2% Widowed10.2% DivorcedFemales 26.0% Never married45.8% Now married1.6% Separated9.2% Widowed17.5% DivorcedWomen who gave birth in the past 12 months Now married:
51.7% (152)Unmarried:
48.3% (142)
Women who did not give birth in the past 12 months Now married:
48.1% (3,007)Unmarried:
51.9% (3,239)
Marital status - Black or African American population 15 years and over
Males 21.3% Never married41.1% Now married34.9% Separated0.9% Widowed1.8% DivorcedFemales 49.7% Never married22.8% Now married9.2% Separated3.5% Widowed14.8% DivorcedWomen who did not give birth in the past 12 months Now married:
38.3% (142)Unmarried:
61.7% (229)
Marital status - American Indian / Alaska Native population 15 years and over
Males 0.0% Never married100.0% Now married0.0% Separated0.0% Widowed0.0% DivorcedFemales 100.0% Never married0.0% Now married0.0% Separated0.0% Widowed0.0% DivorcedWomen who did not give birth in the past 12 months Now married:
0.0% (0)Unmarried:
100.0% (14)
Marital status - Asian population 15 years and over
Males 0.0% Never married45.0% Now married0.0% Separated55.0% Widowed0.0% DivorcedFemales 0.0% Never married100.0% Now married0.0% Separated0.0% Widowed0.0% DivorcedWomen who did not give birth in the past 12 months Now married:
100.0% (190)Unmarried:
0.0% (0)
Marital status - Other race population 15 years and over
Males 86.1% Never married13.9% Now married0.0% Separated0.0% Widowed0.0% DivorcedFemales 0.0% Never married23.2% Now married0.0% Separated0.0% Widowed76.8% DivorcedWomen who did not give birth in the past 12 months Now married:
23.2% (29)Unmarried:
76.8% (96)
Marital status - Two or more races population 15 years and over
Males 45.0% Never married46.5% Now married0.0% Separated2.5% Widowed6.0% DivorcedFemales 42.5% Never married44.7% Now married0.0% Separated2.7% Widowed10.1% DivorcedWomen who gave birth in the past 12 months Now married:
0.0% (0)Unmarried:
100.0% (27)
Women who did not give birth in the past 12 months Now married:
46.6% (233)Unmarried:
53.4% (267)
Marital status - White alone, not Hispanic / Latino population 15 years and over
Males 28.5% Never married56.0% Now married0.9% Separated4.2% Widowed10.4% DivorcedFemales 25.8% Never married45.9% Now married1.6% Separated9.3% Widowed17.4% DivorcedWomen who gave birth in the past 12 months Now married:
51.7% (154)Unmarried:
48.3% (144)
Women who did not give birth in the past 12 months Now married:
48.2% (2,984)Unmarried:
51.8% (3,211)
Marital status - Hispanic or Latino population 15 years and over
Males 44.9% Never married52.2% Now married0.0% Separated2.3% Widowed0.6% DivorcedFemales 27.6% Never married47.8% Now married2.4% Separated0.0% Widowed22.2% DivorcedWomen who did not give birth in the past 12 months Now married:
52.7% (168)Unmarried:
47.3% (151)
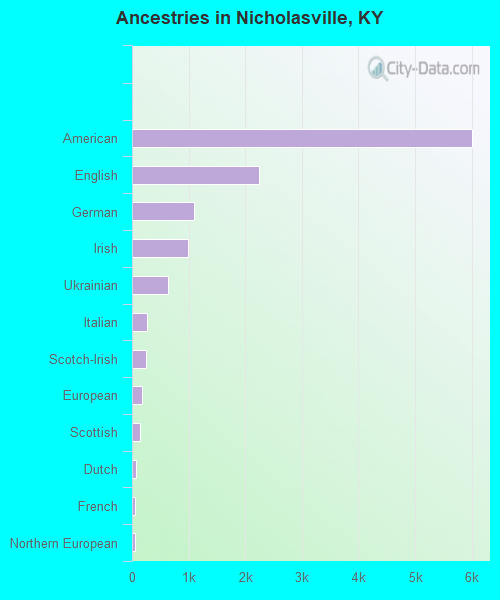
Ancestries in Nicholasville
6,005 37.1% American2,248 13.9% English1,090 6.7% German991 6.1% Irish639 3.9% Ukrainian267 1.6% Italian249 1.5% Scotch-Irish183 1.1% European150 0.9% Scottish64 0.4% Dutch60 0.4% French56 0.3% Northern European47 0.3% Palestinian41 0.3% Eastern European36 0.2% British34 0.2% Polish34 0.2% Swiss28 0.2% Welsh17 0.1% Bulgarian17 0.1% African15 0.09% Swedish14 0.09% Syrian13 0.08% Norwegian5 0.03% Hungarian5 0.03% Scandinavian
Geographical mobility in Nicholasville Same house 1 year ago 23,018 84.9% White (Caucasian)1,240 84.4% Black or African American34 91.6% American Indian / Alaska Native225 97.9% Asian247 88.2% Other race1,854 91.3% Two or more races22,597 84.7% White alone, not Hispanic / Latino1,191 88.6% Hispanic or LatinoMoved within same county 1,754 6.5% White / Caucasian98 6.7% Black or African American6 94.6% Native Hawaiian / Pacific Islander3 1.0% Other race29 1.4% Two or more races1,749 6.6% White alone, not Hispanic / Latino40 2.9% Hispanic or LatinoMoved within same state 1,348 5.0% White / Caucasian165 11.2% Black or African American9 3.1% Other race45 2.2% Two or more races1,360 5.1% White alone, not Hispanic / Latino12 0.9% Hispanic or LatinoMoved from different state 954 3.5% White / Caucasian28 10.1% Other race66 3.2% Two or more races957 3.6% White alone, not Hispanic / Latino88 6.5% Hispanic or LatinoMoved from abroad 1 0.1% Black or African American53 2.6% Two or more races30 2.2% Hispanic or Latino
Children Nativity (place of birth) in Nicholasville
Children under 6 years - Living with two parents Both parents native 1,450 100.0% NativeBoth parents foreign-born 122 100.0% NativeOne native, one foreign-born parent 60 100.0% NativeChildren under 6 years - Living with one parent Native parent 487 100.0% NativeForeign-born parent 22 60.4% Native14 39.6% Foreign-bornChildren 6 to 17 years - Living with two parents Both parents native 2,645 100.0% NativeBoth parents foreign-born 303 100.0% NativeOne native, one foreign-born parent 171 100.0% NativeChildren 6 to 17 years - Living with one parent Native parent 1,456 100.0% NativeForeign-born parent 68 57.0% Native51 43.0% Foreign-born
Grandparents responsible for own grandchildren in Nicholasville
Grandparents (30 to 59 years) White / Caucasian 147 85.5% Responsible for grandchildren25 14.5% Not responsible for grandchildrenTwo or more races 15 100.0% Not responsible for grandchildrenWhite alone, not Hispanic / Latino 147 85.3% Responsible for grandchildren25 14.7% Not responsible for grandchildrenGrandparents (60 years and over) White / Caucasian 637 83.7% Responsible for grandchildren124 16.3% Not responsible for grandchildrenTwo or more races 15 86.1% Responsible for grandchildren2 13.9% Not responsible for grandchildrenWhite alone, not Hispanic / Latino 639 83.6% Responsible for grandchildren126 16.4% Not responsible for grandchildren