Races in North Beach, Washington (WA) Detailed Stats
Ancestries, Foreign-born residents, place of birth
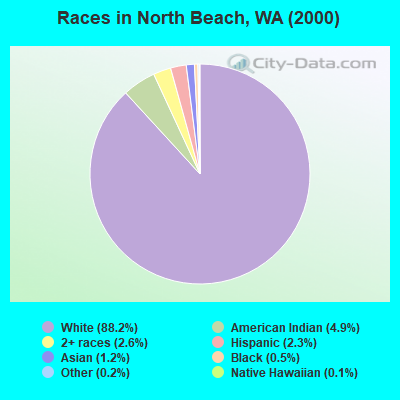
Race distribution in North Beach

- 5,29188.2%White alone
- 2934.9%American Indian alone
- 1572.6%Two or more races
- 1362.3%Hispanic
- 741.2%Asian alone
- 270.5%Black alone
- 120.2%Other race alone
- 70.1%Native Hawaiian and Other
Pacific Islander alone
2000
2022
-
- 4,652,49078.9%White alone
- 441,5097.5%Hispanic
- 319,4015.4%Asian alone
- 184,6313.1%Black alone
- 175,9263.0%Two or more races
- 85,3961.4%American Indian alone
- 22,7790.4%Native Hawaiian and Other
Pacific Islander alone - 11,9890.2%Other race alone

-
- 4,941,45663.5%White alone
- 1,093,31314.0%Hispanic
- 755,8329.7%Asian alone
- 523,4486.7%Two or more races
- 299,5373.8%Black alone
- 69,0240.9%American Indian alone
- 52,2310.7%Native Hawaiian and Other
Pacific Islander alone - 50,9450.7%Other race alone

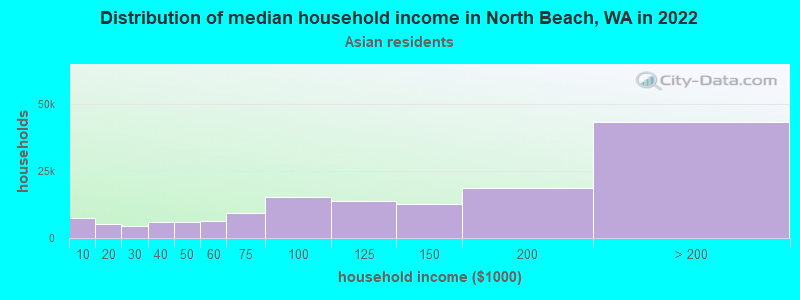
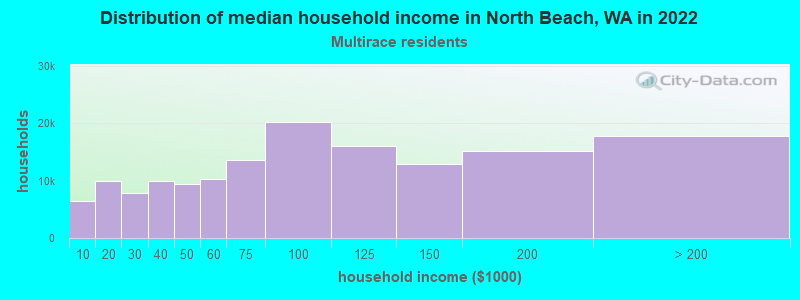
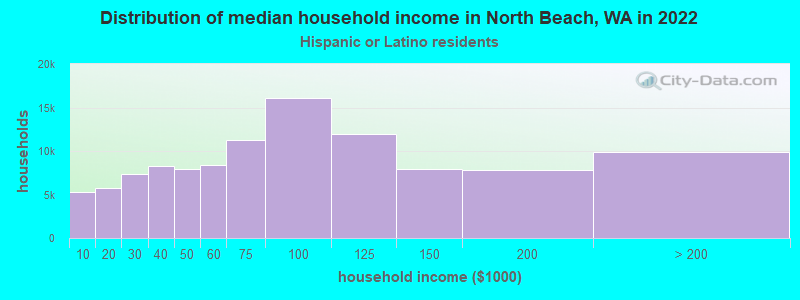
Income and house value in North Beach
- Median household income in 2022
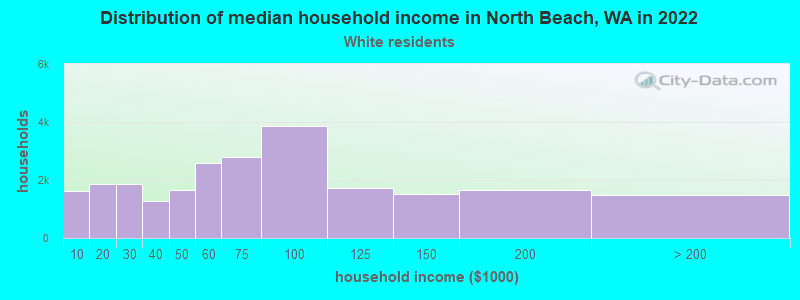
- $58,049White non-Hispanic householders
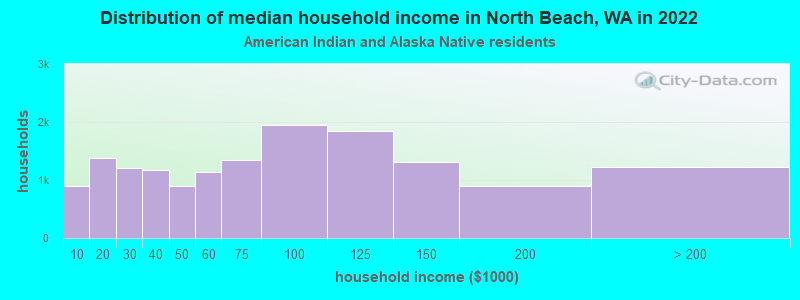
- $58,106American Indian and Alaska Native householders
- $100,402Asian householders
- $34,929Some other race householders
- $70,993Two or more races householders
- $46,647Hispanic or Latino race householders
- Median 2022 house value
- $431,449White Non-Hispanic householders
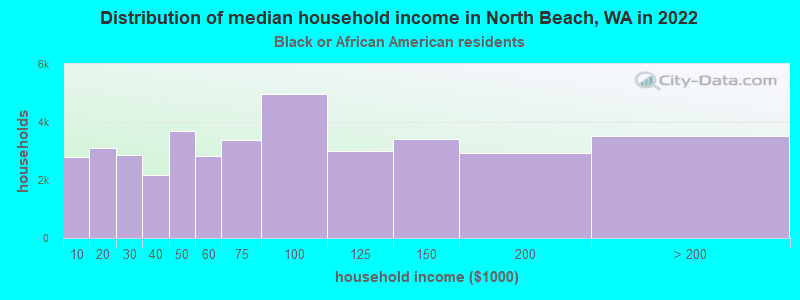
- $208,973Black or African American householders
- $261,377American Indian or Alaska Native householders
- $385,796Asian householders
- $442,058Some other race householders
- $450,096Two or more races householders
- $490,283Hispanic or Latino householders
Household income for White non-Hispanic householders
Household income for Black householders
Household income for American Indian and Alaska Native householders
Household income for Asian householders
Household income for Two or more races householders
Household income for Hispanic or Latino race householders
Zip code: 98550