Races in North Bellmore, New York (NY) Detailed Stats
Data:
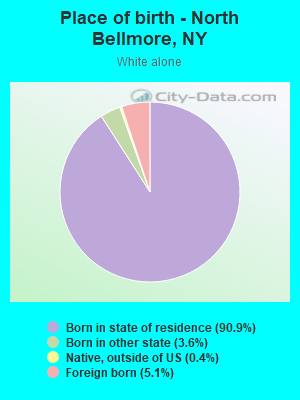
Races - White alone (%)
Races - White alone (% change since 2000)
Races - Black alone (%)
Races - Black alone (% change since 2000)
Races - American Indian alone (%)
Races - American Indian alone (% change since 2000)
Races - Asian alone (%)
Races - Asian alone (% change since 2000)
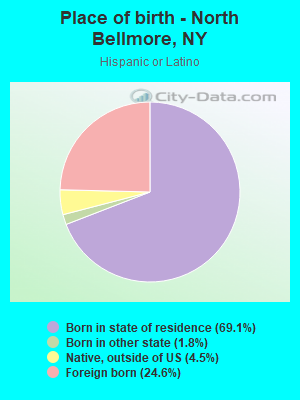
Races - Hispanic (%)
Races - Hispanic (% change since 2000)
Races - Native Hawaiian and Other Pacific Islander alone (%)
Races - Native Hawaiian and Other Pacific Islander alone (% change since 2000)
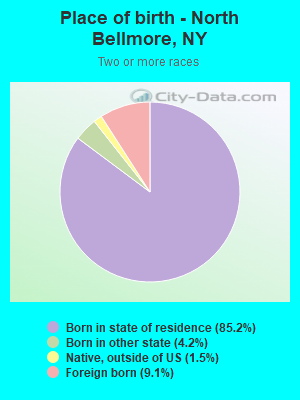
Races - Two or more races(%)
Races - Two or more races(% change since 2000)
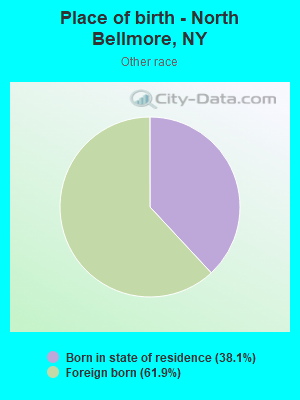
Races - Other race alone (%)
Races - Other race alone (% change since 2000)
Racial diversity
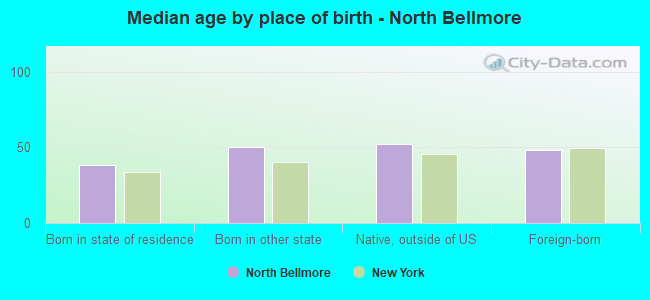
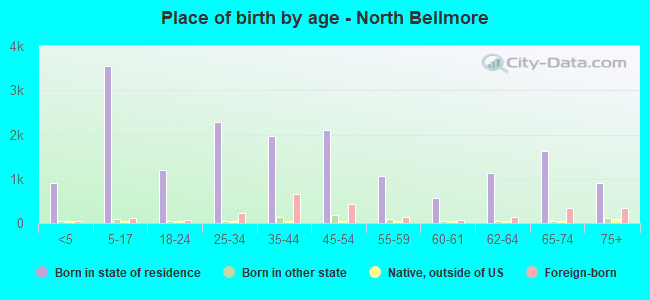
Place of birth - Born in state of residence (%)
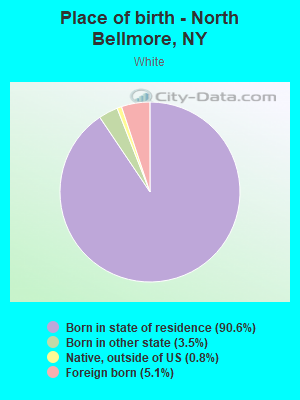
Place of birth - Born in state of residence (%) - White
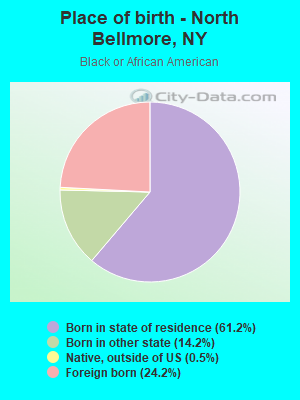
Place of birth - Born in state of residence (%) - Black or African American
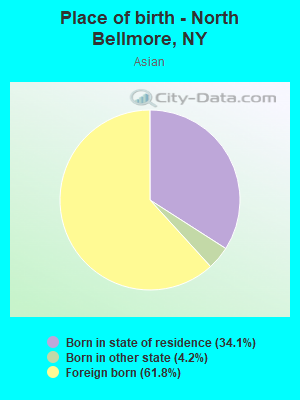
Place of birth - Born in state of residence (%) - Asian
Place of birth - Born in state of residence (%) - Hispanic or Latino
Place of birth - Born in state of residence (%) - American Indian and Alaska Native
Place of birth - Born in state of residence (%) - Multirace
Place of birth - Born in state of residence (%) - Other Race
Place of birth - Born in other state (%)
Place of birth - Born in other state (%) - White
Place of birth - Born in other state (%) - Black or African American
Place of birth - Born in other state (%) - Asian
Place of birth - Born in other state (%) - Hispanic or Latino
Place of birth - Born in other state (%) - American Indian and Alaska Native
Place of birth - Born in other state (%) - Multirace
Place of birth - Born in other state (%) - Other Race
Place of birth - Native, outside of US (%)
Place of birth - Native, outside of US (%) - White
Place of birth - Native, outside of US (%) - Black or African American
Place of birth - Native, outside of US (%) - Asian
Place of birth - Native, outside of US (%) - Hispanic or Latino
Place of birth - Native, outside of US (%) - American Indian and Alaska Native
Place of birth - Native, outside of US (%) - Multirace
Place of birth - Native, outside of US (%) - Other Race
Place of birth - Foreign born (%)
Place of birth - Foreign born (%) - White
Place of birth - Foreign born (%) - Black or African American
Place of birth - Foreign born (%) - Asian
Place of birth - Foreign born (%) - Hispanic or Latino
Place of birth - Foreign born (%) - American Indian and Alaska Native
Place of birth - Foreign born (%) - Multirace
Place of birth - Foreign born (%) - Other Race
Residents speaking English at home (%)
Residents speaking English at home - Born in the United States (%)
Residents speaking English at home - Native, born elsewhere (%)
Residents speaking English at home - Foreign born (%)
Residents speaking Spanish at home (%)
Residents speaking Spanish at home - Born in the United States (%)
Residents speaking Spanish at home - Native, born elsewhere (%)
Residents speaking Spanish at home - Foreign born (%)
Residents speaking other language at home (%)
Residents speaking other language at home - Born in the United States (%)
Residents speaking other language at home - Native, born elsewhere (%)
Residents speaking other language at home - Foreign born (%)
Marital status - Never married (%)
Marital status - Now married (%)
Marital status - Separated (%)
Marital status - Widowed (%)
Marital status - Divorced (%)
Ancestries Reported - Arab (%)
Ancestries Reported - Czech (%)
Ancestries Reported - Danish (%)
Ancestries Reported - Dutch (%)
Ancestries Reported - English (%)
Ancestries Reported - French (%)
Ancestries Reported - French Canadian (%)
Ancestries Reported - German (%)
Ancestries Reported - Greek (%)
Ancestries Reported - Hungarian (%)
Ancestries Reported - Irish (%)
Ancestries Reported - Italian (%)
Ancestries Reported - Lithuanian (%)
Ancestries Reported - Norwegian (%)
Ancestries Reported - Polish (%)
Ancestries Reported - Portuguese (%)
Ancestries Reported - Russian (%)
Ancestries Reported - Scotch-Irish (%)
Ancestries Reported - Scottish (%)
Ancestries Reported - Slovak (%)
Ancestries Reported - Subsaharan African (%)
Ancestries Reported - Swedish (%)
Ancestries Reported - Swiss (%)
Ancestries Reported - Ukrainian (%)
Ancestries Reported - United States (%)
Ancestries Reported - Welsh (%)
Ancestries Reported - West Indian (%)
Ancestries Reported - Other (%)
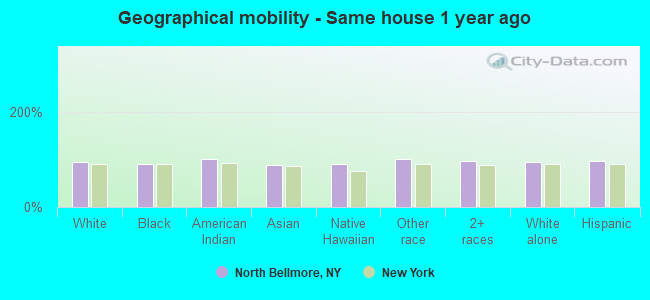
Geographical mobility - Same house 1 year ago (%)
Geographical mobility - Same house 1 year ago (%) - White
Geographical mobility - Same house 1 year ago (%) - Black or African American
Geographical mobility - Same house 1 year ago (%) - Asian
Geographical mobility - Same house 1 year ago (%) - Hispanic or Latino
Geographical mobility - Same house 1 year ago (%) - American Indian and Alaska Native
Geographical mobility - Same house 1 year ago (%) - Multirace
Geographical mobility - Same house 1 year ago (%) - Other Race
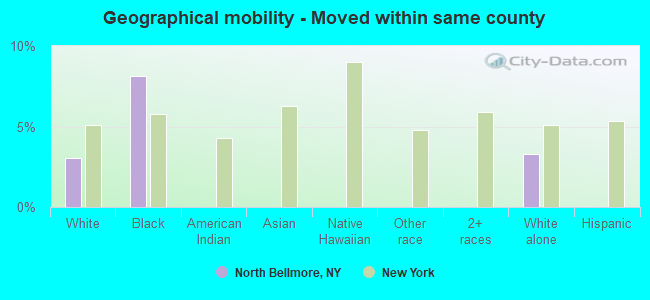
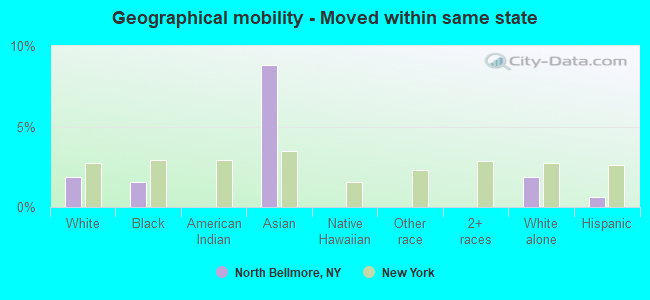
Geographical mobility - Moved within same county (%)
Geographical mobility - Moved within same county (%) - White
Geographical mobility - Moved within same county (%) - Black or African American
Geographical mobility - Moved within same county (%) - Asian
Geographical mobility - Moved within same county (%) - Hispanic or Latino
Geographical mobility - Moved within same county (%) - American Indian and Alaska Native
Geographical mobility - Moved within same county (%) - Multirace
Geographical mobility - Moved within same county (%) - Other Race
Geographical mobility - Moved from different county within same state (%)
Geographical mobility - Moved from different county within same state (%) - White
Geographical mobility - Moved from different county within same state (%) - Black or African American
Geographical mobility - Moved from different county within same state (%) - Asian
Geographical mobility - Moved from different county within same state (%) - Hispanic or Latino
Geographical mobility - Moved from different county within same state (%) - American Indian and Alaska Native
Geographical mobility - Moved from different county within same state (%) - Multirace
Geographical mobility - Moved from different county within same state (%) - Other Race
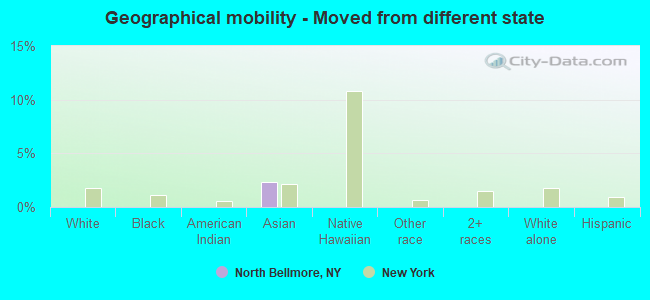
Geographical mobility - Moved from different state (%)
Geographical mobility - Moved from different state (%) - White
Geographical mobility - Moved from different state (%) - Black or African American
Geographical mobility - Moved from different state (%) - Asian
Geographical mobility - Moved from different state (%) - Hispanic or Latino
Geographical mobility - Moved from different state (%) - American Indian and Alaska Native
Geographical mobility - Moved from different state (%) - Multirace
Geographical mobility - Moved from different state (%) - Other Race
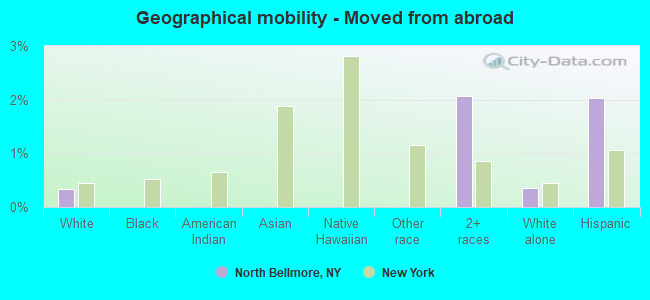
Geographical mobility - Moved from abroad (%)
Geographical mobility - Moved from abroad (%) - White
Geographical mobility - Moved from abroad (%) - Black or African American
Geographical mobility - Moved from abroad (%) - Asian
Geographical mobility - Moved from abroad (%) - Hispanic or Latino
Geographical mobility - Moved from abroad (%) - American Indian and Alaska Native
Geographical mobility - Moved from abroad (%) - Multirace
Geographical mobility - Moved from abroad (%) - Other Race
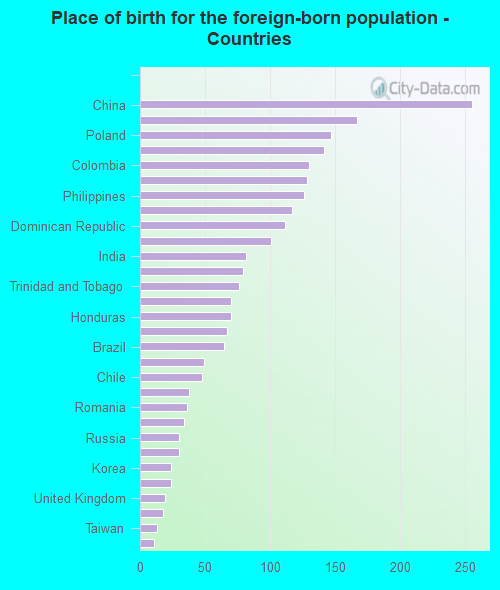
Place of birth for the foreign-born population - Ireland (%)
Place of birth for the foreign-born population - Denmark (%)
Place of birth for the foreign-born population - Norway (%)
Place of birth for the foreign-born population - Sweden (%)
Place of birth for the foreign-born population - United Kingdom (%)
Place of birth for the foreign-born population - England (%)
Place of birth for the foreign-born population - Scotland (%)
Place of birth for the foreign-born population - Other Northern Europe (%)
Place of birth for the foreign-born population - Austria (%)
Place of birth for the foreign-born population - Belgium (%)
Place of birth for the foreign-born population - France (%)
Place of birth for the foreign-born population - Germany (%)
Place of birth for the foreign-born population - Netherlands (%)
Place of birth for the foreign-born population - Switzerland (%)
Place of birth for the foreign-born population - Other Western Europe (%)
Place of birth for the foreign-born population - Greece (%)
Place of birth for the foreign-born population - Italy (%)
Place of birth for the foreign-born population - Portugal (%)
Place of birth for the foreign-born population - Spain (%)
Place of birth for the foreign-born population - Other Southern Europe (%)
Place of birth for the foreign-born population - Albania (%)
Place of birth for the foreign-born population - Belarus (%)
Place of birth for the foreign-born population - Bosnia and Herzegovina (%)
Place of birth for the foreign-born population - Bulgaria (%)
Place of birth for the foreign-born population - Croatia (%)
Place of birth for the foreign-born population - Czechoslovakia (%)
Place of birth for the foreign-born population - Hungary (%)
Place of birth for the foreign-born population - Latvia (%)
Place of birth for the foreign-born population - Lithuania (%)
Place of birth for the foreign-born population - North Macedonia (Macedonia) (%)
Place of birth for the foreign-born population - Moldova (%)
Place of birth for the foreign-born population - Poland (%)
Place of birth for the foreign-born population - Romania (%)
Place of birth for the foreign-born population - Russia (%)
Place of birth for the foreign-born population - Serbia (%)
Place of birth for the foreign-born population - Ukraine (%)
Place of birth for the foreign-born population - Other Eastern Europe (%)
Place of birth for the foreign-born population - China (%)
Place of birth for the foreign-born population - Hong Kong (%)
Place of birth for the foreign-born population - Taiwan (%)
Place of birth for the foreign-born population - Japan (%)
Place of birth for the foreign-born population - Korea (%)
Place of birth for the foreign-born population - Other Eastern Asia (%)
Place of birth for the foreign-born population - Afghanistan (%)
Place of birth for the foreign-born population - Bangladesh (%)
Place of birth for the foreign-born population - India (%)
Place of birth for the foreign-born population - Iran (%)
Place of birth for the foreign-born population - Kazakhstan (%)
Place of birth for the foreign-born population - Nepal (%)
Place of birth for the foreign-born population - Pakistan (%)
Place of birth for the foreign-born population - Sri Lanka (%)
Place of birth for the foreign-born population - Uzbekistan (%)
Place of birth for the foreign-born population - Other South Central Asia (%)
Place of birth for the foreign-born population - Burma (%)
Place of birth for the foreign-born population - Cambodia (%)
Place of birth for the foreign-born population - Indonesia (%)
Place of birth for the foreign-born population - Laos (%)
Place of birth for the foreign-born population - Malaysia (%)
Place of birth for the foreign-born population - Philippines (%)
Place of birth for the foreign-born population - Singapore (%)
Place of birth for the foreign-born population - Thailand (%)
Place of birth for the foreign-born population - Vietnam (%)
Place of birth for the foreign-born population - Other South Eastern Asia (%)
Place of birth for the foreign-born population - Armenia (%)
Place of birth for the foreign-born population - Iraq (%)
Place of birth for the foreign-born population - Israel (%)
Place of birth for the foreign-born population - Jordan (%)
Place of birth for the foreign-born population - Kuwait (%)
Place of birth for the foreign-born population - Lebanon (%)
Place of birth for the foreign-born population - Saudi Arabia (%)
Place of birth for the foreign-born population - Syria (%)
Place of birth for the foreign-born population - Turkey (%)
Place of birth for the foreign-born population - Yemen (%)
Place of birth for the foreign-born population - Other Western Asia (%)
Place of birth for the foreign-born population - Eritrea (%)
Place of birth for the foreign-born population - Ethiopia (%)
Place of birth for the foreign-born population - Kenya (%)
Place of birth for the foreign-born population - Somalia (%)
Place of birth for the foreign-born population - Uganda (%)
Place of birth for the foreign-born population - Zimbabwe (%)
Place of birth for the foreign-born population - Other Eastern Africa (%)
Place of birth for the foreign-born population - Cameroon (%)
Place of birth for the foreign-born population - Congo (%)
Place of birth for the foreign-born population - Democratic Republic of Congo (Zaire) (%)
Place of birth for the foreign-born population - Other Middle Africa (%)
Place of birth for the foreign-born population - Egypt (%)
Place of birth for the foreign-born population - Morocco (%)
Place of birth for the foreign-born population - Sudan (%)
Place of birth for the foreign-born population - Other Northern Africa (%)
Place of birth for the foreign-born population - South Africa (%)
Place of birth for the foreign-born population - Other Southern Africa (%)
Place of birth for the foreign-born population - Cabo Verde (%)
Place of birth for the foreign-born population - Ghana (%)
Place of birth for the foreign-born population - Liberia (%)
Place of birth for the foreign-born population - Nigeria (%)
Place of birth for the foreign-born population - Senegal (%)
Place of birth for the foreign-born population - Sierra Leone (%)
Place of birth for the foreign-born population - Other Western Africa (%)
Place of birth for the foreign-born population - Australia (%)
Place of birth for the foreign-born population - New Zealand (%)
Place of birth for the foreign-born population - Fiji (%)
Place of birth for the foreign-born population - Micronesia (%)
Place of birth for the foreign-born population - Bahamas (%)
Place of birth for the foreign-born population - Barbados (%)
Place of birth for the foreign-born population - Cuba (%)
Place of birth for the foreign-born population - Dominica (%)
Place of birth for the foreign-born population - Dominican Republic (%)
Place of birth for the foreign-born population - Grenada (%)
Place of birth for the foreign-born population - Haiti (%)
Place of birth for the foreign-born population - Jamaica (%)
Place of birth for the foreign-born population - St. Vincent and the Grenadines (%)
Place of birth for the foreign-born population - Trinidad and Tobago (%)
Place of birth for the foreign-born population - West Indies (%)
Place of birth for the foreign-born population - Other Caribbean (%)
Place of birth for the foreign-born population - Belize (%)
Place of birth for the foreign-born population - Costa Rica (%)
Place of birth for the foreign-born population - El Salvador (%)
Place of birth for the foreign-born population - Guatemala (%)
Place of birth for the foreign-born population - Honduras (%)
Place of birth for the foreign-born population - Mexico (%)
Place of birth for the foreign-born population - Nicaragua (%)
Place of birth for the foreign-born population - Panama (%)
Place of birth for the foreign-born population - Other Central America (%)
Place of birth for the foreign-born population - Argentina (%)
Place of birth for the foreign-born population - Bolivia (%)
Place of birth for the foreign-born population - Brazil (%)
Place of birth for the foreign-born population - Chile (%)
Place of birth for the foreign-born population - Colombia (%)
Place of birth for the foreign-born population - Ecuador (%)
Place of birth for the foreign-born population - Guyana (%)
Place of birth for the foreign-born population - Peru (%)
Place of birth for the foreign-born population - Uruguay (%)
Place of birth for the foreign-born population - Venezuela (%)
Place of birth for the foreign-born population - Other South America (%)
Place of birth for the foreign-born population - Canada (%)
Place of birth for the foreign-born population - Other Northern America (%)
Place of birth for the foreign-born population - Other (%)
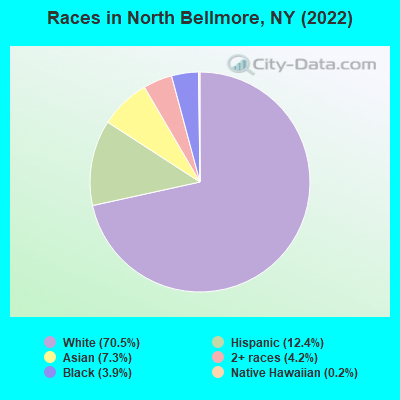
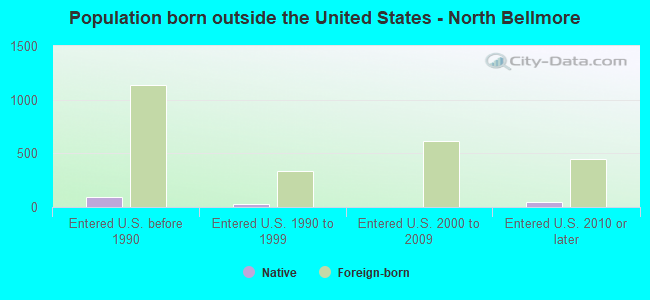
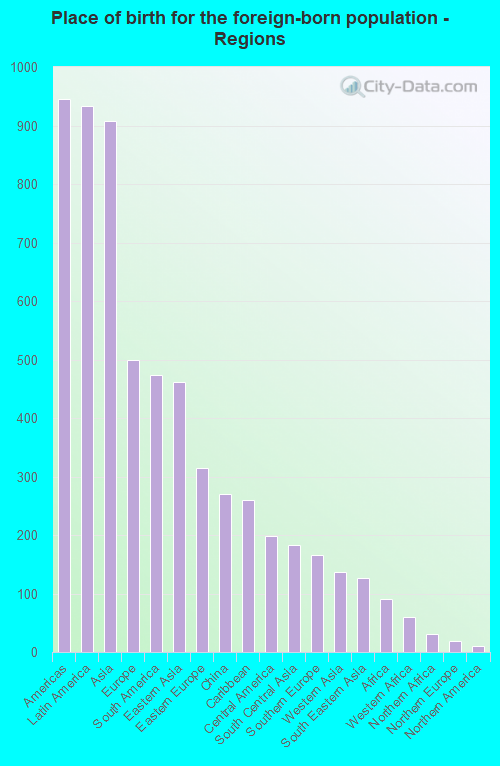
According to 2022 data, the most numerous races in North Bellmore, NY are White alone (14,788 residents), Hispanic (2,600 residents), and Black alone (809 residents). 80.7% of North Bellmore residents speak English at home. 11.6% of North Bellmore, NY residents are foreign-born (4.5% born in Latin America, 4.4% born in Asia, 2.4% born in Europe), which is 88.9% less than the foreign-born rate of 22.0% across the entire state of New York.
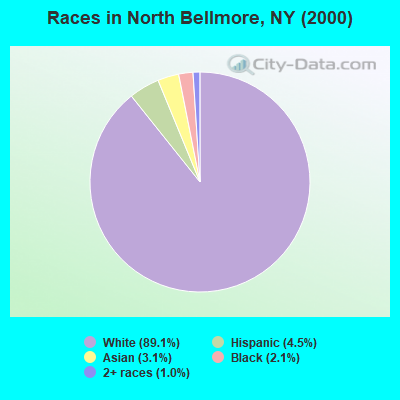
Race distribution in North Bellmore
2000 2022
11,760,981 62.0% White alone 2,867,583 15.1% Hispanic 2,812,623 14.8% Black alone 1,035,926 5.5% Asian alone 366,116 1.9% Two or more races 75,499 0.4% Other race alone 52,499 0.3% American Indian alone 5,230 0.03% Native Hawaiian and Other
10,408,933 52.9% White alone 3,867,299 19.7% Hispanic 2,633,840 13.4% Black alone 1,776,286 9.0% Asian alone 732,670 3.7% Two or more races 216,110 1.1% Other race alone 35,082 0.2% American Indian alone 6,931 0.04% Native Hawaiian and Other
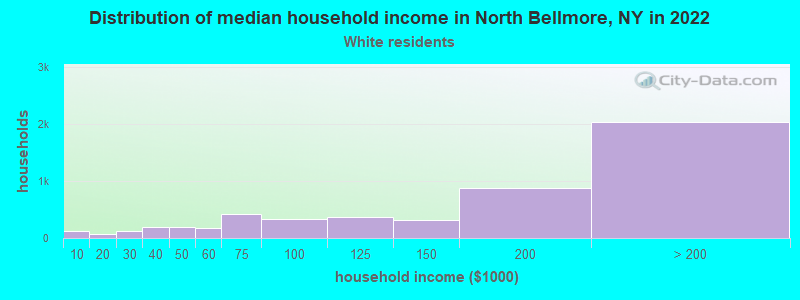
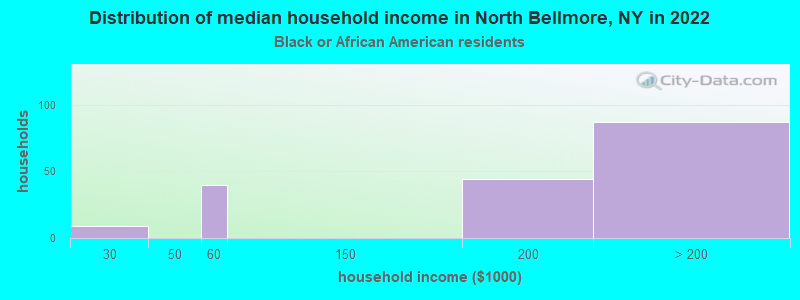
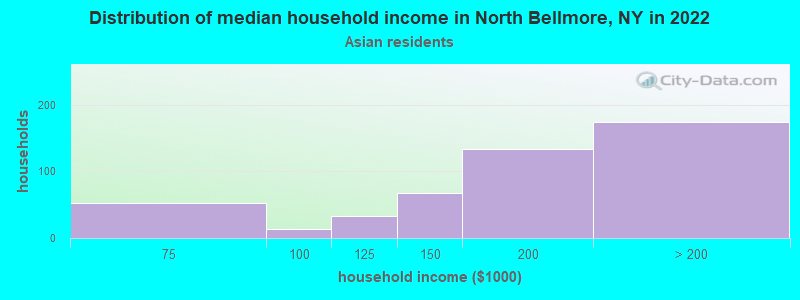
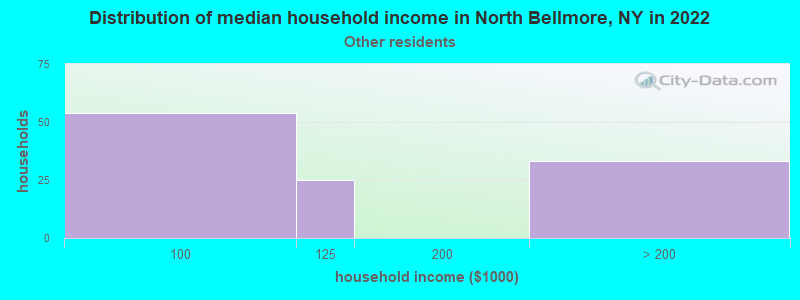
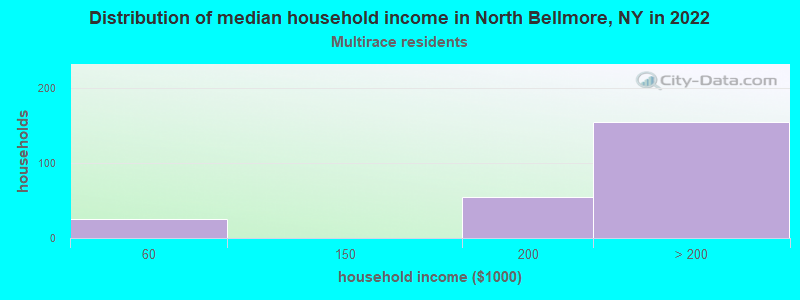
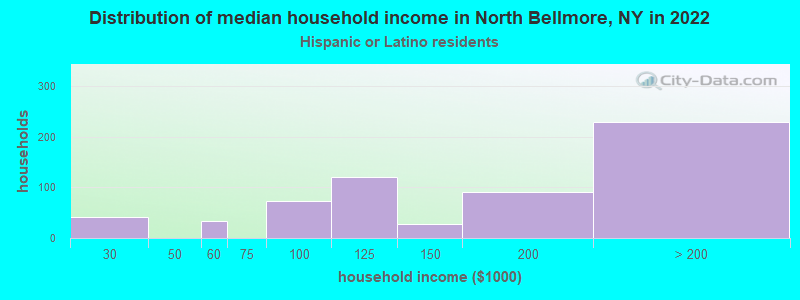
Income and house value in North Bellmore Median household income in 2022 $164,959 White non-Hispanic householdersover $200,000 Black householders$194,718 Asian householdersover $200,000 Two or more races householders$167,168 Hispanic or Latino race householdersMedian 2022 house value $634,510 White Non-Hispanic householders$576,828 Black or African American householders$461,746 American Indian or Alaska Native householders $753,286 Asian householders$540,172 Some other race householders$608,368 Two or more races householders$637,068 Hispanic or Latino householders
Median age by race in North Bellmore
46.2 Median age for White residents43.1 48.7 45.4 Median age for Black or African American residents44.5 59.1 -855,158,729.3 Median age for American Indian / Alaska Native residents-607,543,322.5 -837,121,211.3 37.0 Median age for Asian residents35.4 37.0 -487,992,314.6 Median age for Native Hawaiian / Pacific Islander residents-477,502,295.2 -497,387,669.3 32.0 Median age for Other race residents43.1 25.3 12.1 Median age for Two or more races residents11.9 11.6 46.2 Median age for White alone residents44.0 49.9 28.3 Median age for Hispanic or Latino residents31.4 24.2
Owner/renter occupied households by race in North Bellmore
House owners and renters - White residents 4,828 91.7% Owner occupied435 8.3% Renter occupiedHouse owners and renters - Black or African American residents 175 95.0% Owner occupied9 5.0% Renter occupiedHouse owners and renters - American Indian / Alaska Native residents 34 100.0% Owner occupiedHouse owners and renters - Asian residents 498 100.0% Owner occupiedHouse owners and renters - Native Hawaiian / Pacific Islander residents 37 100.0% Owner occupiedHouse owners and renters - Other race residents 31 27.9% Owner occupied79 72.1% Renter occupiedHouse owners and renters - Two or more races residents 236 100.0% Owner occupiedHouse owners and renters - White alone residents 4,713 92.4% Owner occupied385 7.6% Renter occupiedHouse owners and renters - Hispanic or Latino residents 486 76.4% Owner occupied150 23.6% Renter occupied
Language usage in North Bellmore
English speakers - Total 80.7% of residents of North Bellmore speak English at home.
6.2% of residents speak Spanish at home 922 73.8% Speak English very well327 26.2% Speak English less than very well12.6% of residents speak other language at home 1,982 78.2% Speak English very well554 21.8% Speak English less than very well
English speakers - Born in the United States 88.4% of residents of North Bellmore speak English at home.
9.3% of residents speak other language at home 74 100.0% Speak English very well
English speakers - Native, born elsewhere 65.5% of residents of North Bellmore speak English at home.
14.9% of residents speak Spanish at home 25 100.0% Speak English very well17.3% of residents speak other language at home 29 100.0% Speak English very well
English speakers - Foreign-born 17.0% of residents of North Bellmore speak English at home.
21.2% of residents speak Spanish at home 353 65.9% Speak English very well183 34.1% Speak English less than very well62.5% of residents speak other language at home 1,171 74.3% Speak English very well406 25.7% Speak English less than very well
White (Caucasian) - Speak only English Native:
96.0% (13,444)Foreign-born:
15.6% (122)
White (Caucasian) - Speak another language Native:
4.6% (639)Foreign-born:
81.4% (639)
Black or African American - Speak only English Native:
98.4% (548)Foreign-born:
63.3% (121)
Black or African American - Speak another language Native:
0.8% (4)Foreign-born:
36.6% (70)
Asian - Speak only English Native:
37.8% (190)Foreign-born:
14.5% (138)
Asian - Speak another language Native:
61.4% (309)Foreign-born:
84.9% (807)
Other race - Speak only English Native:
59.0% (91)Foreign-born:
12.5% (30)
Other race - Speak another language Native:
43.9% (68)Foreign-born:
85.9% (209)
Two or more races - Speak only English Native:
67.0% (1,406)Foreign-born:
6.0% (13)
Two or more races - Speak another language Native:
32.8% (688)Foreign-born:
95.8% (207)
White alone - Speak only English Native:
96.3% (13,084)Foreign-born:
16.7% (125)
White alone - Speak another language Native:
3.9% (526)Foreign-born:
83.7% (626)
Hispanic or Latino - Speak only English Native:
66.5% (1,096)Foreign-born:
6.2% (40)
Hispanic or Latino - Speak another language Native:
33.0% (543)Foreign-born:
93.8% (604)
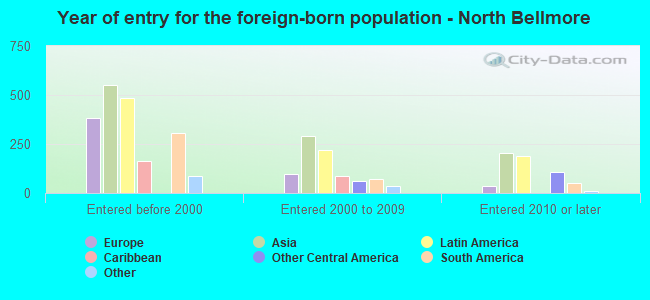
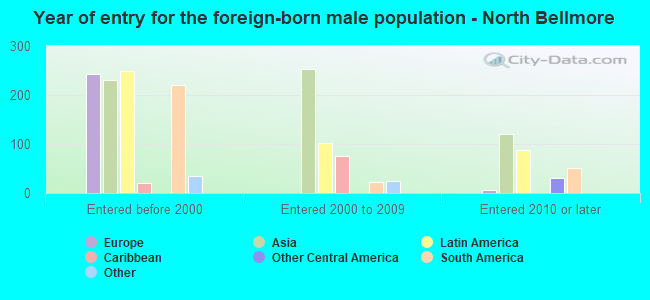
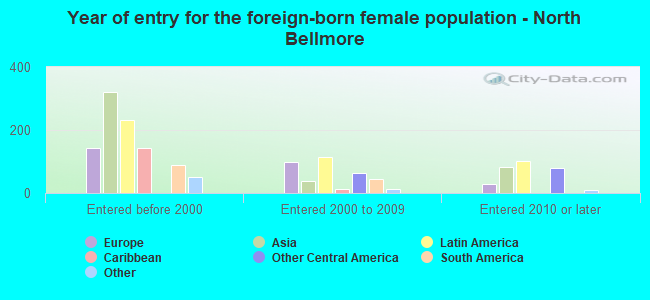
Foreign-born residents in North Bellmore 2,444 residents are foreign born (4.5% Latin America , 4.4% Asia , 2.4% Europe ).
This city:
11.6%New York:
22.6%
Marital status for residents in North Bellmore Marital status - White (Caucasian) population 15 years and over
Males 33.8% Never married60.8% Now married0.1% Separated2.6% Widowed2.7% DivorcedFemales 19.5% Never married64.9% Now married1.8% Separated8.7% Widowed5.2% DivorcedWomen who gave birth in the past 12 months Now married:
100.0% (153)Unmarried:
0.0% (0)
Women who did not give birth in the past 12 months Now married:
64.9% (1,717)Unmarried:
35.1% (927)
Marital status - Black or African American population 15 years and over
Males 15.1% Never married76.4% Now married0.0% Separated1.0% Widowed7.5% DivorcedFemales 25.5% Never married47.4% Now married0.0% Separated27.1% Widowed0.0% DivorcedWomen who did not give birth in the past 12 months Now married:
48.1% (58)Unmarried:
51.9% (63)
Marital status - American Indian / Alaska Native population 15 years and over
Males 0.0% Never married100.0% Now married0.0% Separated0.0% Widowed0.0% DivorcedFemales 0.0% Never married100.0% Now married0.0% Separated0.0% Widowed0.0% DivorcedWomen who did not give birth in the past 12 months Now married:
100.0% (27)Unmarried:
0.0% (0)
Marital status - Asian population 15 years and over
Males 27.2% Never married72.8% Now married0.0% Separated0.0% Widowed0.0% DivorcedFemales 20.8% Never married79.0% Now married0.0% Separated0.2% Widowed0.0% DivorcedWomen who gave birth in the past 12 months Now married:
100.0% (36)Unmarried:
0.0% (0)
Women who did not give birth in the past 12 months Now married:
63.2% (221)Unmarried:
36.8% (129)
Marital status - Other race population 15 years and over
Males 51.0% Never married49.0% Now married0.0% Separated0.0% Widowed0.0% DivorcedFemales 61.9% Never married34.3% Now married0.0% Separated0.0% Widowed3.8% DivorcedWomen who did not give birth in the past 12 months Now married:
20.7% (20)Unmarried:
79.3% (78)
Marital status - Two or more races population 15 years and over
Males 46.2% Never married53.8% Now married0.0% Separated0.0% Widowed0.0% DivorcedFemales 41.4% Never married58.6% Now married0.0% Separated0.0% Widowed0.0% DivorcedWomen who gave birth in the past 12 months Now married:
0.0% (0)Unmarried:
100.0% (29)
Women who did not give birth in the past 12 months Now married:
52.8% (228)Unmarried:
47.2% (204)
Marital status - White alone, not Hispanic / Latino population 15 years and over
Males 34.8% Never married59.5% Now married0.1% Separated2.8% Widowed2.8% DivorcedFemales 19.0% Never married64.7% Now married1.9% Separated9.0% Widowed5.4% DivorcedWomen who gave birth in the past 12 months Now married:
100.0% (112)Unmarried:
0.0% (0)
Women who did not give birth in the past 12 months Now married:
65.0% (1,715)Unmarried:
35.0% (922)
Marital status - Hispanic or Latino population 15 years and over
Males 33.4% Never married66.5% Now married0.0% Separated0.0% Widowed0.2% DivorcedFemales 40.0% Never married58.6% Now married0.0% Separated0.8% Widowed0.6% DivorcedWomen who gave birth in the past 12 months Now married:
74.0% (54)Unmarried:
26.0% (19)
Women who did not give birth in the past 12 months Now married:
54.4% (270)Unmarried:
45.6% (226)
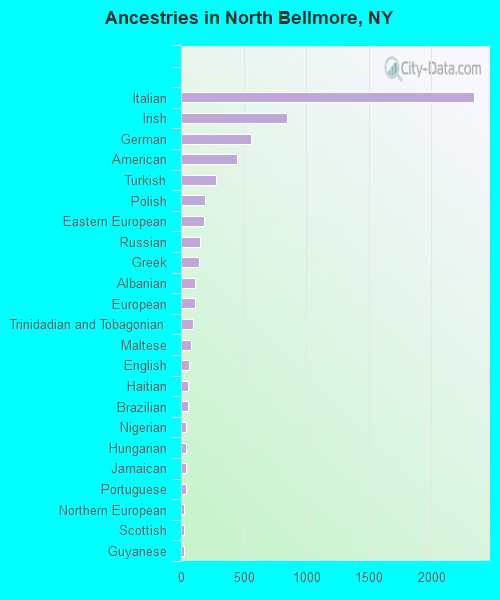
Ancestries in North Bellmore
2,343 27.2% Italian846 9.8% Irish557 6.5% German444 5.1% American280 3.2% Turkish192 2.2% Polish186 2.2% Eastern European151 1.8% Russian143 1.7% Greek115 1.3% Albanian109 1.3% European92 1.1% Trinidadian and Tobagonian78 0.9% Maltese60 0.7% English56 0.6% Haitian52 0.6% Brazilian42 0.5% Nigerian40 0.5% Hungarian40 0.5% Jamaican39 0.5% Portuguese26 0.3% Northern European26 0.3% Scottish23 0.3% Guyanese20 0.2% Lithuanian20 0.2% Scotch-Irish19 0.2% Syrian18 0.2% Egyptian17 0.2% Ghanaian11 0.1% Finnish9 0.1% Swedish8 0.09% Canadian
Geographical mobility in North Bellmore Same house 1 year ago 14,263 94.5% White (Caucasian)733 91.3% Black or African American59 100.0% American Indian / Alaska Native1,344 89.5% Asian31 89.7% Native Hawaiian / Pacific Islander402 99.9% Other race2,325 97.4% Two or more races13,830 94.3% White alone, not Hispanic / Latino2,459 97.5% Hispanic or LatinoMoved within same county 457 3.0% White / Caucasian65 8.1% Black or African American486 3.3% White alone, not Hispanic / LatinoMoved within same state 285 1.9% White / Caucasian13 1.6% Black or African American132 8.8% Asian272 1.9% White alone, not Hispanic / Latino15 0.6% Hispanic or LatinoMoved from different state 6 0.0% White / Caucasian35 2.3% Asian6 0.0% White alone, not Hispanic / LatinoMoved from abroad 51 0.3% White49 2.1% Two or more races53 0.4% White alone, not Hispanic / Latino51 2.0% Hispanic or Latino
Children Nativity (place of birth) in North Bellmore
Children under 6 years - Living with two parents Both parents native 920 100.0% NativeBoth parents foreign-born 190 100.0% NativeOne native, one foreign-born parent 120 100.0% NativeChildren under 6 years - Living with one parent Native parent 111 100.0% NativeChildren 6 to 17 years - Living with two parents Both parents native 1,943 98.8% Native24 1.2% Foreign-bornBoth parents foreign-born 653 94.7% Native36 5.3% Foreign-bornOne native, one foreign-born parent 358 100.0% NativeChildren 6 to 17 years - Living with one parent Native parent 177 85.3% Native30 14.7% Foreign-born
Grandparents responsible for own grandchildren in North Bellmore
Grandparents (30 to 59 years) Asian 13 100.0% Not responsible for grandchildren
Grandparents (60 years and over) Asian 1 94.9% Not responsible for grandchildren