Races in North Canton, Ohio (OH) Detailed Stats
Data:
Races - White alone (%)
Races - White alone (% change since 2000)
Races - Black alone (%)
Races - Black alone (% change since 2000)
Races - American Indian alone (%)
Races - American Indian alone (% change since 2000)
Races - Asian alone (%)
Races - Asian alone (% change since 2000)
Races - Hispanic (%)
Races - Hispanic (% change since 2000)
Races - Native Hawaiian and Other Pacific Islander alone (%)
Races - Native Hawaiian and Other Pacific Islander alone (% change since 2000)
Races - Two or more races(%)
Races - Two or more races(% change since 2000)
Races - Other race alone (%)
Races - Other race alone (% change since 2000)
Racial diversity
Place of birth - Born in state of residence (%)
Place of birth - Born in state of residence (%) - White
Place of birth - Born in state of residence (%) - Black or African American
Place of birth - Born in state of residence (%) - Asian
Place of birth - Born in state of residence (%) - Hispanic or Latino
Place of birth - Born in state of residence (%) - American Indian and Alaska Native
Place of birth - Born in state of residence (%) - Multirace
Place of birth - Born in state of residence (%) - Other Race
Place of birth - Born in other state (%)
Place of birth - Born in other state (%) - White
Place of birth - Born in other state (%) - Black or African American
Place of birth - Born in other state (%) - Asian
Place of birth - Born in other state (%) - Hispanic or Latino
Place of birth - Born in other state (%) - American Indian and Alaska Native
Place of birth - Born in other state (%) - Multirace
Place of birth - Born in other state (%) - Other Race
Place of birth - Native, outside of US (%)
Place of birth - Native, outside of US (%) - White
Place of birth - Native, outside of US (%) - Black or African American
Place of birth - Native, outside of US (%) - Asian
Place of birth - Native, outside of US (%) - Hispanic or Latino
Place of birth - Native, outside of US (%) - American Indian and Alaska Native
Place of birth - Native, outside of US (%) - Multirace
Place of birth - Native, outside of US (%) - Other Race
Place of birth - Foreign born (%)
Place of birth - Foreign born (%) - White
Place of birth - Foreign born (%) - Black or African American
Place of birth - Foreign born (%) - Asian
Place of birth - Foreign born (%) - Hispanic or Latino
Place of birth - Foreign born (%) - American Indian and Alaska Native
Place of birth - Foreign born (%) - Multirace
Place of birth - Foreign born (%) - Other Race
Residents speaking English at home (%)
Residents speaking English at home - Born in the United States (%)
Residents speaking English at home - Native, born elsewhere (%)
Residents speaking English at home - Foreign born (%)
Residents speaking Spanish at home (%)
Residents speaking Spanish at home - Born in the United States (%)
Residents speaking Spanish at home - Native, born elsewhere (%)
Residents speaking Spanish at home - Foreign born (%)
Residents speaking other language at home (%)
Residents speaking other language at home - Born in the United States (%)
Residents speaking other language at home - Native, born elsewhere (%)
Residents speaking other language at home - Foreign born (%)
Marital status - Never married (%)
Marital status - Now married (%)
Marital status - Separated (%)
Marital status - Widowed (%)
Marital status - Divorced (%)
Ancestries Reported - Arab (%)
Ancestries Reported - Czech (%)
Ancestries Reported - Danish (%)
Ancestries Reported - Dutch (%)
Ancestries Reported - English (%)
Ancestries Reported - French (%)
Ancestries Reported - French Canadian (%)
Ancestries Reported - German (%)
Ancestries Reported - Greek (%)
Ancestries Reported - Hungarian (%)
Ancestries Reported - Irish (%)
Ancestries Reported - Italian (%)
Ancestries Reported - Lithuanian (%)
Ancestries Reported - Norwegian (%)
Ancestries Reported - Polish (%)
Ancestries Reported - Portuguese (%)
Ancestries Reported - Russian (%)
Ancestries Reported - Scotch-Irish (%)
Ancestries Reported - Scottish (%)
Ancestries Reported - Slovak (%)
Ancestries Reported - Subsaharan African (%)
Ancestries Reported - Swedish (%)
Ancestries Reported - Swiss (%)
Ancestries Reported - Ukrainian (%)
Ancestries Reported - United States (%)
Ancestries Reported - Welsh (%)
Ancestries Reported - West Indian (%)
Ancestries Reported - Other (%)
Geographical mobility - Same house 1 year ago (%)
Geographical mobility - Same house 1 year ago (%) - White
Geographical mobility - Same house 1 year ago (%) - Black or African American
Geographical mobility - Same house 1 year ago (%) - Asian
Geographical mobility - Same house 1 year ago (%) - Hispanic or Latino
Geographical mobility - Same house 1 year ago (%) - American Indian and Alaska Native
Geographical mobility - Same house 1 year ago (%) - Multirace
Geographical mobility - Same house 1 year ago (%) - Other Race
Geographical mobility - Moved within same county (%)
Geographical mobility - Moved within same county (%) - White
Geographical mobility - Moved within same county (%) - Black or African American
Geographical mobility - Moved within same county (%) - Asian
Geographical mobility - Moved within same county (%) - Hispanic or Latino
Geographical mobility - Moved within same county (%) - American Indian and Alaska Native
Geographical mobility - Moved within same county (%) - Multirace
Geographical mobility - Moved within same county (%) - Other Race
Geographical mobility - Moved from different county within same state (%)
Geographical mobility - Moved from different county within same state (%) - White
Geographical mobility - Moved from different county within same state (%) - Black or African American
Geographical mobility - Moved from different county within same state (%) - Asian
Geographical mobility - Moved from different county within same state (%) - Hispanic or Latino
Geographical mobility - Moved from different county within same state (%) - American Indian and Alaska Native
Geographical mobility - Moved from different county within same state (%) - Multirace
Geographical mobility - Moved from different county within same state (%) - Other Race
Geographical mobility - Moved from different state (%)
Geographical mobility - Moved from different state (%) - White
Geographical mobility - Moved from different state (%) - Black or African American
Geographical mobility - Moved from different state (%) - Asian
Geographical mobility - Moved from different state (%) - Hispanic or Latino
Geographical mobility - Moved from different state (%) - American Indian and Alaska Native
Geographical mobility - Moved from different state (%) - Multirace
Geographical mobility - Moved from different state (%) - Other Race
Geographical mobility - Moved from abroad (%)
Geographical mobility - Moved from abroad (%) - White
Geographical mobility - Moved from abroad (%) - Black or African American
Geographical mobility - Moved from abroad (%) - Asian
Geographical mobility - Moved from abroad (%) - Hispanic or Latino
Geographical mobility - Moved from abroad (%) - American Indian and Alaska Native
Geographical mobility - Moved from abroad (%) - Multirace
Geographical mobility - Moved from abroad (%) - Other Race
Place of birth for the foreign-born population - Ireland (%)
Place of birth for the foreign-born population - Denmark (%)
Place of birth for the foreign-born population - Norway (%)
Place of birth for the foreign-born population - Sweden (%)
Place of birth for the foreign-born population - United Kingdom (%)
Place of birth for the foreign-born population - England (%)
Place of birth for the foreign-born population - Scotland (%)
Place of birth for the foreign-born population - Other Northern Europe (%)
Place of birth for the foreign-born population - Austria (%)
Place of birth for the foreign-born population - Belgium (%)
Place of birth for the foreign-born population - France (%)
Place of birth for the foreign-born population - Germany (%)
Place of birth for the foreign-born population - Netherlands (%)
Place of birth for the foreign-born population - Switzerland (%)
Place of birth for the foreign-born population - Other Western Europe (%)
Place of birth for the foreign-born population - Greece (%)
Place of birth for the foreign-born population - Italy (%)
Place of birth for the foreign-born population - Portugal (%)
Place of birth for the foreign-born population - Spain (%)
Place of birth for the foreign-born population - Other Southern Europe (%)
Place of birth for the foreign-born population - Albania (%)
Place of birth for the foreign-born population - Belarus (%)
Place of birth for the foreign-born population - Bosnia and Herzegovina (%)
Place of birth for the foreign-born population - Bulgaria (%)
Place of birth for the foreign-born population - Croatia (%)
Place of birth for the foreign-born population - Czechoslovakia (%)
Place of birth for the foreign-born population - Hungary (%)
Place of birth for the foreign-born population - Latvia (%)
Place of birth for the foreign-born population - Lithuania (%)
Place of birth for the foreign-born population - North Macedonia (Macedonia) (%)
Place of birth for the foreign-born population - Moldova (%)
Place of birth for the foreign-born population - Poland (%)
Place of birth for the foreign-born population - Romania (%)
Place of birth for the foreign-born population - Russia (%)
Place of birth for the foreign-born population - Serbia (%)
Place of birth for the foreign-born population - Ukraine (%)
Place of birth for the foreign-born population - Other Eastern Europe (%)
Place of birth for the foreign-born population - China (%)
Place of birth for the foreign-born population - Hong Kong (%)
Place of birth for the foreign-born population - Taiwan (%)
Place of birth for the foreign-born population - Japan (%)
Place of birth for the foreign-born population - Korea (%)
Place of birth for the foreign-born population - Other Eastern Asia (%)
Place of birth for the foreign-born population - Afghanistan (%)
Place of birth for the foreign-born population - Bangladesh (%)
Place of birth for the foreign-born population - India (%)
Place of birth for the foreign-born population - Iran (%)
Place of birth for the foreign-born population - Kazakhstan (%)
Place of birth for the foreign-born population - Nepal (%)
Place of birth for the foreign-born population - Pakistan (%)
Place of birth for the foreign-born population - Sri Lanka (%)
Place of birth for the foreign-born population - Uzbekistan (%)
Place of birth for the foreign-born population - Other South Central Asia (%)
Place of birth for the foreign-born population - Burma (%)
Place of birth for the foreign-born population - Cambodia (%)
Place of birth for the foreign-born population - Indonesia (%)
Place of birth for the foreign-born population - Laos (%)
Place of birth for the foreign-born population - Malaysia (%)
Place of birth for the foreign-born population - Philippines (%)
Place of birth for the foreign-born population - Singapore (%)
Place of birth for the foreign-born population - Thailand (%)
Place of birth for the foreign-born population - Vietnam (%)
Place of birth for the foreign-born population - Other South Eastern Asia (%)
Place of birth for the foreign-born population - Armenia (%)
Place of birth for the foreign-born population - Iraq (%)
Place of birth for the foreign-born population - Israel (%)
Place of birth for the foreign-born population - Jordan (%)
Place of birth for the foreign-born population - Kuwait (%)
Place of birth for the foreign-born population - Lebanon (%)
Place of birth for the foreign-born population - Saudi Arabia (%)
Place of birth for the foreign-born population - Syria (%)
Place of birth for the foreign-born population - Turkey (%)
Place of birth for the foreign-born population - Yemen (%)
Place of birth for the foreign-born population - Other Western Asia (%)
Place of birth for the foreign-born population - Eritrea (%)
Place of birth for the foreign-born population - Ethiopia (%)
Place of birth for the foreign-born population - Kenya (%)
Place of birth for the foreign-born population - Somalia (%)
Place of birth for the foreign-born population - Uganda (%)
Place of birth for the foreign-born population - Zimbabwe (%)
Place of birth for the foreign-born population - Other Eastern Africa (%)
Place of birth for the foreign-born population - Cameroon (%)
Place of birth for the foreign-born population - Congo (%)
Place of birth for the foreign-born population - Democratic Republic of Congo (Zaire) (%)
Place of birth for the foreign-born population - Other Middle Africa (%)
Place of birth for the foreign-born population - Egypt (%)
Place of birth for the foreign-born population - Morocco (%)
Place of birth for the foreign-born population - Sudan (%)
Place of birth for the foreign-born population - Other Northern Africa (%)
Place of birth for the foreign-born population - South Africa (%)
Place of birth for the foreign-born population - Other Southern Africa (%)
Place of birth for the foreign-born population - Cabo Verde (%)
Place of birth for the foreign-born population - Ghana (%)
Place of birth for the foreign-born population - Liberia (%)
Place of birth for the foreign-born population - Nigeria (%)
Place of birth for the foreign-born population - Senegal (%)
Place of birth for the foreign-born population - Sierra Leone (%)
Place of birth for the foreign-born population - Other Western Africa (%)
Place of birth for the foreign-born population - Australia (%)
Place of birth for the foreign-born population - New Zealand (%)
Place of birth for the foreign-born population - Fiji (%)
Place of birth for the foreign-born population - Micronesia (%)
Place of birth for the foreign-born population - Bahamas (%)
Place of birth for the foreign-born population - Barbados (%)
Place of birth for the foreign-born population - Cuba (%)
Place of birth for the foreign-born population - Dominica (%)
Place of birth for the foreign-born population - Dominican Republic (%)
Place of birth for the foreign-born population - Grenada (%)
Place of birth for the foreign-born population - Haiti (%)
Place of birth for the foreign-born population - Jamaica (%)
Place of birth for the foreign-born population - St. Vincent and the Grenadines (%)
Place of birth for the foreign-born population - Trinidad and Tobago (%)
Place of birth for the foreign-born population - West Indies (%)
Place of birth for the foreign-born population - Other Caribbean (%)
Place of birth for the foreign-born population - Belize (%)
Place of birth for the foreign-born population - Costa Rica (%)
Place of birth for the foreign-born population - El Salvador (%)
Place of birth for the foreign-born population - Guatemala (%)
Place of birth for the foreign-born population - Honduras (%)
Place of birth for the foreign-born population - Mexico (%)
Place of birth for the foreign-born population - Nicaragua (%)
Place of birth for the foreign-born population - Panama (%)
Place of birth for the foreign-born population - Other Central America (%)
Place of birth for the foreign-born population - Argentina (%)
Place of birth for the foreign-born population - Bolivia (%)
Place of birth for the foreign-born population - Brazil (%)
Place of birth for the foreign-born population - Chile (%)
Place of birth for the foreign-born population - Colombia (%)
Place of birth for the foreign-born population - Ecuador (%)
Place of birth for the foreign-born population - Guyana (%)
Place of birth for the foreign-born population - Peru (%)
Place of birth for the foreign-born population - Uruguay (%)
Place of birth for the foreign-born population - Venezuela (%)
Place of birth for the foreign-born population - Other South America (%)
Place of birth for the foreign-born population - Canada (%)
Place of birth for the foreign-born population - Other Northern America (%)
Place of birth for the foreign-born population - Other (%)
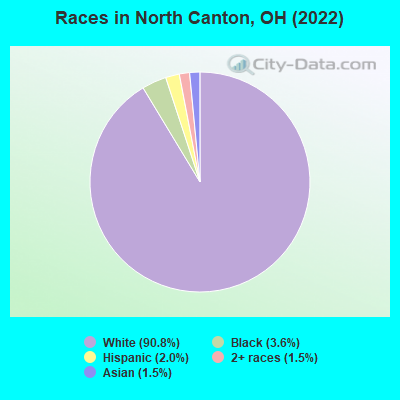
According to 2022 data, the most numerous races in North Canton, OH are White alone (16,079 residents), Black alone (637 residents), and Two or more races (269 residents). 96.8% of North Canton residents speak English at home. 2.0% of North Canton, OH residents are foreign-born , which is 102.9% less than the foreign-born rate of 4.0% across the entire state of Ohio.
Race distribution in North Canton
2000 2022
9,538,111 84.0% White alone 1,290,662 11.4% Black alone 217,123 1.9% Hispanic 137,770 1.2% Two or more races 131,670 1.2% Asian alone 21,985 0.2% American Indian alone 13,483 0.1% Other race alone 2,336 0.02% Native Hawaiian and Other
8,948,793 76.1% White alone 1,401,403 11.9% Black alone 529,291 4.5% Two or more races 517,232 4.4% Hispanic 293,387 2.5% Asian alone 52,805 0.4% Other race alone 9,785 0.08% American Indian alone 3,362 0.03% Native Hawaiian and Other
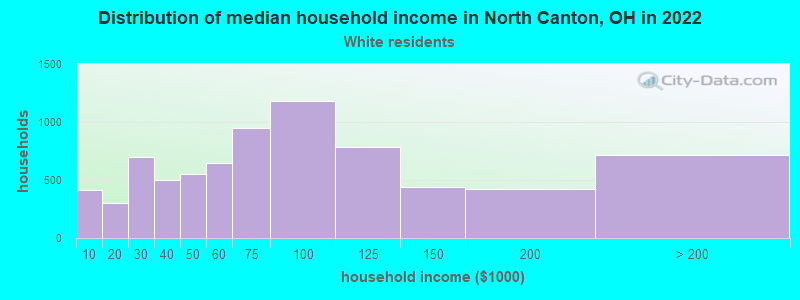
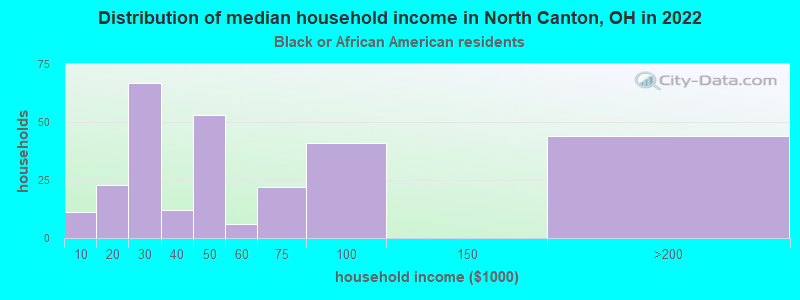
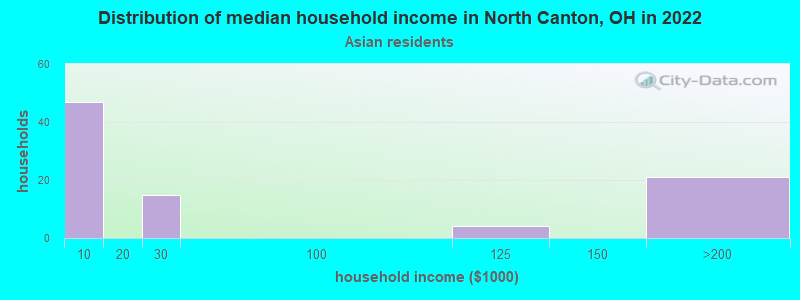
Income and house value in North Canton Median household income in 2022 $69,765 White non-Hispanic householders$56,735 Black householders$142,051 Some other race householders$113,900 Hispanic or Latino race householdersMedian 2022 house value $196,288 White Non-Hispanic householders$66,135 Black or African American householders $267,799 Asian householders$61,085 Some other race householders$178,696 Two or more races householders$207,039 Hispanic or Latino householders
Median age by race in North Canton
46.1 Median age for White residents44.4 47.0 26.2 Median age for Black or African American residents22.5 30.9 -644,832,604.9 Median age for American Indian / Alaska Native residents-864,561,402.6 -465,047,828.8 22.3 Median age for Asian residents20.4 25.7 -666,666,666.0 Median age for Native Hawaiian / Pacific Islander residents-666,666,666.0 -666,666,666.0 52.2 Median age for Other race residents20.5 66.0 25.1 Median age for Two or more races residents16.5 31.9 46.2 Median age for White alone residents44.3 47.2 29.2 Median age for Hispanic or Latino residents20.3 55.5
Owner/renter occupied households by race in North Canton
House owners and renters - White residents 5,261 68.7% Owner occupied2,393 31.3% Renter occupiedHouse owners and renters - Black or African American residents 23 12.1% Owner occupied167 87.9% Renter occupiedHouse owners and renters - Asian residents 102 94.7% Owner occupied6 5.3% Renter occupiedHouse owners and renters - Other race residents 48 100.0% Owner occupiedHouse owners and renters - Two or more races residents 63 66.3% Owner occupied32 33.7% Renter occupiedHouse owners and renters - White alone residents 5,245 68.6% Owner occupied2,405 31.4% Renter occupiedHouse owners and renters - Hispanic or Latino residents 95 82.9% Owner occupied20 17.1% Renter occupied
Language usage in North Canton
English speakers - Total 96.8% of residents of North Canton speak English at home.
0.5% of residents speak Spanish at home 47 56.0% Speak English very well37 44.0% Speak English less than very well2.8% of residents speak other language at home 348 73.6% Speak English very well125 26.4% Speak English less than very well
English speakers - Born in the United States 97.9% of residents of North Canton speak English at home.
1.5% of residents speak Spanish at home 45 100.0% Speak English less than very well1.1% of residents speak other language at home 32 100.0% Speak English very well
All residents speak only English at home
English speakers - Foreign-born 43.0% of residents of North Canton speak English at home.
1.6% of residents speak Spanish at home 5 100.0% Speak English very well55.1% of residents speak other language at home 46 26.0% Speak English very well131 74.0% Speak English less than very well
White (Caucasian) - Speak only English Native:
98.3% (15,060)Foreign-born:
56.0% (114)
White (Caucasian) - Speak another language Native:
1.7% (258)Foreign-born:
39.4% (80)
Black or African American - Speak only English Native:
99.8% (586)Foreign-born:
100.0% (10)
Asian - Speak only English Native:
22.0% (31)Foreign-born:
11.1% (14)
Asian - Speak another language Native:
41.7% (59)Foreign-born:
85.6% (107)
Other race - Speak only English Native:
94.4% (175)Foreign-born:
41.4% (10)
Other race - Speak another language Native:
2.8% (5)Foreign-born:
48.6% (11)
White alone - Speak only English Native:
98.3% (15,003)Foreign-born:
50.5% (107)
White alone - Speak another language Native:
1.7% (264)Foreign-born:
45.1% (95)
Hispanic or Latino - Speak only English Native:
100.0% (387)Foreign-born:
100.0% (17)
Hispanic or Latino - Speak another language Native:
3.0% (12)Foreign-born:
33.1% (6)
Foreign-born residents in North Canton 349 residents are foreign born
Marital status for residents in North Canton Marital status - White (Caucasian) population 15 years and over
Males 30.6% Never married53.0% Now married1.2% Separated3.9% Widowed11.3% DivorcedFemales 27.3% Never married44.0% Now married0.4% Separated16.1% Widowed12.3% DivorcedWomen who gave birth in the past 12 months Now married:
82.3% (132)Unmarried:
17.7% (28)
Women who did not give birth in the past 12 months Now married:
33.6% (1,147)Unmarried:
66.4% (2,263)
Marital status - Black or African American population 15 years and over
Males 70.4% Never married13.8% Now married0.0% Separated3.2% Widowed12.6% DivorcedFemales 45.2% Never married17.6% Now married21.8% Separated6.9% Widowed8.4% DivorcedWomen who did not give birth in the past 12 months Now married:
40.7% (79)Unmarried:
59.3% (115)
Marital status - Asian population 15 years and over
Males 39.5% Never married60.5% Now married0.0% Separated0.0% Widowed0.0% DivorcedFemales 51.2% Never married48.8% Now married0.0% Separated0.0% Widowed0.0% DivorcedWomen who did not give birth in the past 12 months Now married:
38.1% (40)Unmarried:
61.9% (65)
Marital status - Other race population 15 years and over
Males 100.0% Never married0.0% Now married0.0% Separated0.0% Widowed0.0% DivorcedFemales 60.2% Never married4.5% Now married0.0% Separated25.0% Widowed10.2% DivorcedWomen who did not give birth in the past 12 months Now married:
0.0% (0)Unmarried:
100.0% (70)
Marital status - Two or more races population 15 years and over
Males 59.6% Never married34.6% Now married0.0% Separated0.0% Widowed5.8% DivorcedFemales 46.0% Never married29.0% Now married0.0% Separated25.0% Widowed0.0% DivorcedWomen who did not give birth in the past 12 months Now married:
18.6% (15)Unmarried:
81.4% (66)
Marital status - White alone, not Hispanic / Latino population 15 years and over
Males 30.6% Never married53.0% Now married1.2% Separated3.9% Widowed11.3% DivorcedFemales 27.0% Never married44.2% Now married0.4% Separated16.1% Widowed12.3% DivorcedWomen who gave birth in the past 12 months Now married:
82.3% (132)Unmarried:
17.7% (28)
Women who did not give birth in the past 12 months Now married:
33.9% (1,145)Unmarried:
66.1% (2,228)
Marital status - Hispanic or Latino population 15 years and over
Males 75.9% Never married24.1% Now married0.0% Separated0.0% Widowed0.0% DivorcedFemales 57.4% Never married8.6% Now married0.0% Separated29.4% Widowed4.6% DivorcedWomen who did not give birth in the past 12 months Now married:
10.3% (14)Unmarried:
89.7% (120)
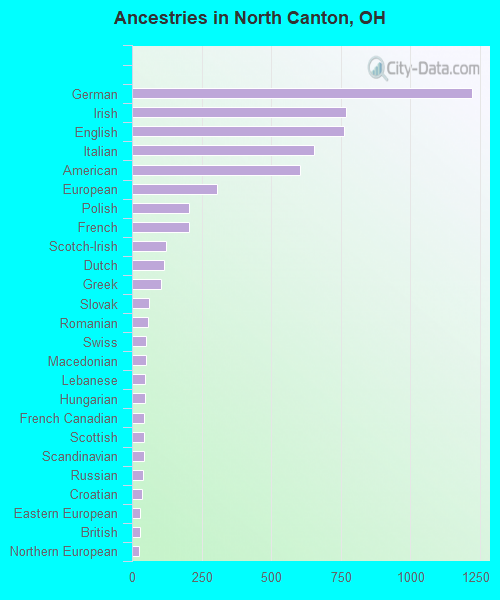
Ancestries in North Canton
1,221 17.7% German768 11.2% Irish761 11.1% English653 9.5% Italian602 8.7% American306 4.4% European206 3.0% Polish203 2.9% French122 1.8% Scotch-Irish116 1.7% Dutch103 1.5% Greek61 0.9% Slovak59 0.9% Romanian52 0.8% Swiss49 0.7% Macedonian47 0.7% Lebanese45 0.7% Hungarian44 0.6% French Canadian44 0.6% Scottish43 0.6% Scandinavian41 0.6% Russian37 0.5% Croatian28 0.4% Eastern European27 0.4% British25 0.4% Northern European24 0.3% Swedish15 0.2% Jordanian15 0.2% Czechoslovakian14 0.2% Nigerian11 0.2% Slavic11 0.2% Syrian9 0.1% Austrian8 0.1% Pennsylvania German6 0.09% Welsh2 0.03% Finnish
Children Nativity (place of birth) in North Canton
Children under 6 years - Living with two parents Both parents native 601 100.0% NativeBoth parents foreign-born 9 100.0% NativeChildren under 6 years - Living with one parent Native parent 159 100.0% NativeChildren 6 to 17 years - Living with two parents Both parents native 1,315 100.0% NativeBoth parents foreign-born 25 100.0% NativeOne native, one foreign-born parent 21 100.0% NativeChildren 6 to 17 years - Living with one parent Native parent 675 100.0% NativeForeign-born parent 77 50.4% Native76 49.6% Foreign-born