Races in North Castle, New York (NY) Detailed Stats
Ancestries, Foreign-born residents, place of birth
12.7% of North Castle, NY residents are foreign-born (6.9% born in Europe, 2.9% born in Asia, 2.1% born in Latin America), which is 72.6% less than the foreign-born rate of 22.0% across the entire state of New York.
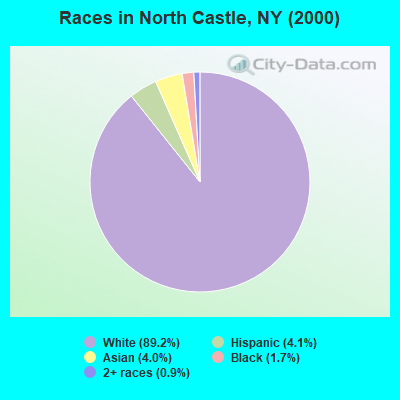
Race distribution in North Castle

- 9,68289.2%White alone
- 4494.1%Hispanic
- 4304.0%Asian alone
- 1821.7%Black alone
- 940.9%Two or more races
- 70.06%Other race alone
- 30.03%Native Hawaiian and Other
Pacific Islander alone - 20.02%American Indian alone
2000
2022
-
- 11,760,98162.0%White alone
- 2,867,58315.1%Hispanic
- 2,812,62314.8%Black alone
- 1,035,9265.5%Asian alone
- 366,1161.9%Two or more races
- 75,4990.4%Other race alone
- 52,4990.3%American Indian alone
- 5,2300.03%Native Hawaiian and Other
Pacific Islander alone

-
- 10,408,93352.9%White alone
- 3,867,29919.7%Hispanic
- 2,633,84013.4%Black alone
- 1,776,2869.0%Asian alone
- 732,6703.7%Two or more races
- 216,1101.1%Other race alone
- 35,0820.2%American Indian alone
- 6,9310.04%Native Hawaiian and Other
Pacific Islander alone

Income and house value in North Castle
- Median household income in 2022
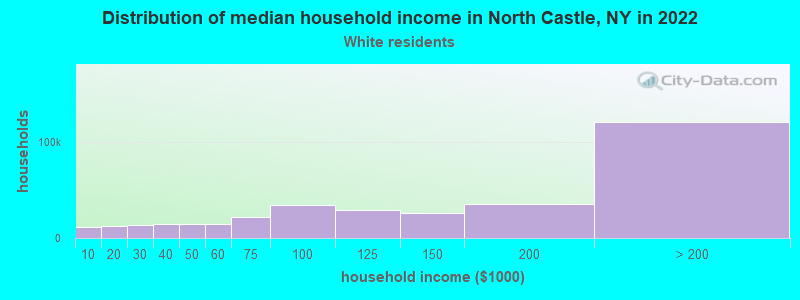
- over $200,000White non-Hispanic householders
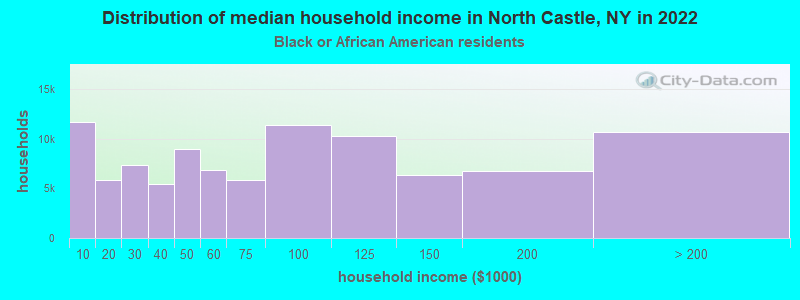
- $117,628Black householders
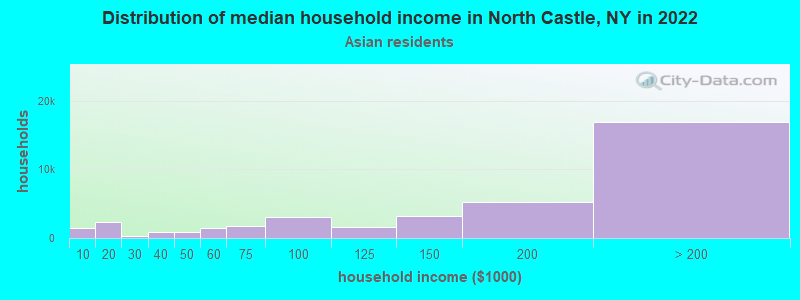
- over $200,000Asian householders
- $71,831Some other race householders
- $136,092Two or more races householders
- $123,601Hispanic or Latino race householders
- Median 2022 house value
- over $1,000,000White Non-Hispanic householders
- over $1,000,000Black or African American householders
- over $1,000,000Asian householders
- $606,813Two or more races householders
- $690,106Hispanic or Latino householders
Household income for White non-Hispanic householders
Household income for Black householders
Household income for Asian householders
Household income for Two or more races householders
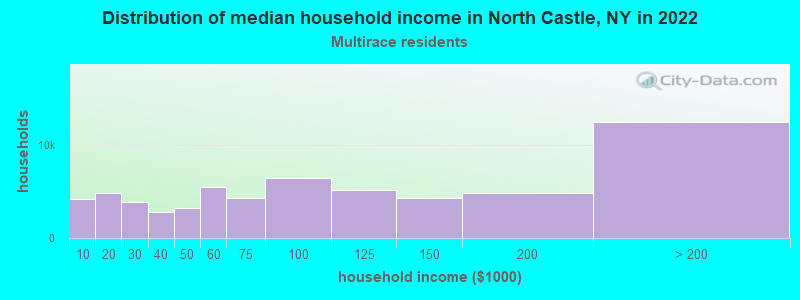
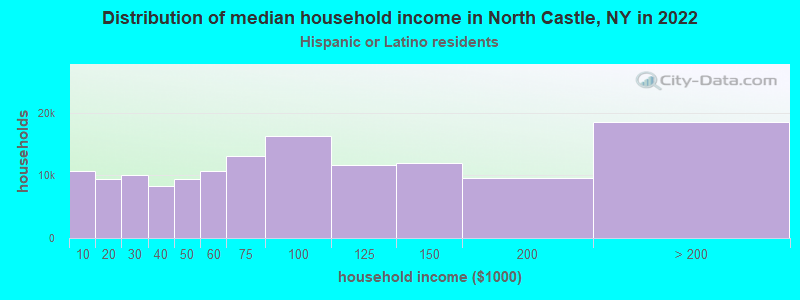
Household income for Hispanic or Latino race householders
Foreign-born residents in North Castle
1,383 residents are foreign born (6.9% Europe, 2.9% Asia, 2.1% Latin America).
| This city: | 12.7% |
| New York: | 20.4% |
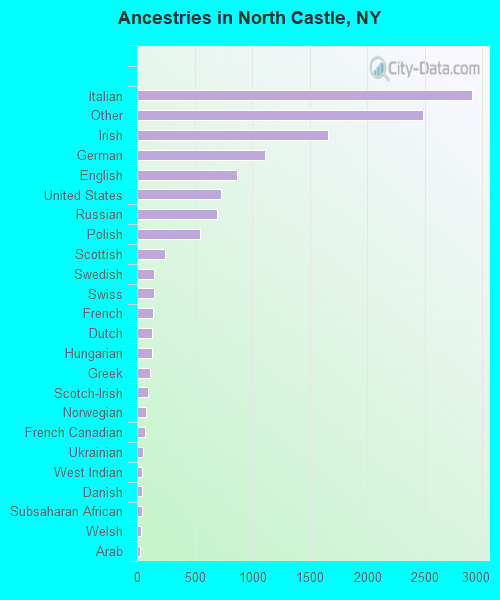
Ancestries in North Castle

- 2,91523.1%Italian
- 2,48919.7%Other
- 1,66213.2%Irish
- 1,1098.8%German
- 8716.9%English
- 7315.8%United States
- 6955.5%Russian
- 5444.3%Polish
- 2472.0%Scottish
- 1461.2%Swedish
- 1441.1%Swiss
- 1431.1%French
- 1321.0%Dutch
- 1311.0%Hungarian
- 1120.9%Greek
- 970.8%Scotch-Irish
- 810.6%Norwegian
- 710.6%French Canadian
- 560.4%Ukrainian
- 460.4%West Indian
- 420.3%Danish
- 410.3%Subsaharan African
- 320.3%Welsh
- 270.2%Arab
- 250.2%Czech
- 200.2%Slovak
- 70.06%Portuguese
Zip codes: 10504.