Races in North Chicago, Illinois (IL) Detailed Stats
Data:
Races - White alone (%)
Races - White alone (% change since 2000)
Races - Black alone (%)
Races - Black alone (% change since 2000)
Races - American Indian alone (%)
Races - American Indian alone (% change since 2000)
Races - Asian alone (%)
Races - Asian alone (% change since 2000)
Races - Hispanic (%)
Races - Hispanic (% change since 2000)
Races - Native Hawaiian and Other Pacific Islander alone (%)
Races - Native Hawaiian and Other Pacific Islander alone (% change since 2000)
Races - Two or more races(%)
Races - Two or more races(% change since 2000)
Races - Other race alone (%)
Races - Other race alone (% change since 2000)
Racial diversity
Place of birth - Born in state of residence (%)
Place of birth - Born in state of residence (%) - White
Place of birth - Born in state of residence (%) - Black or African American
Place of birth - Born in state of residence (%) - Asian
Place of birth - Born in state of residence (%) - Hispanic or Latino
Place of birth - Born in state of residence (%) - American Indian and Alaska Native
Place of birth - Born in state of residence (%) - Multirace
Place of birth - Born in state of residence (%) - Other Race
Place of birth - Born in other state (%)
Place of birth - Born in other state (%) - White
Place of birth - Born in other state (%) - Black or African American
Place of birth - Born in other state (%) - Asian
Place of birth - Born in other state (%) - Hispanic or Latino
Place of birth - Born in other state (%) - American Indian and Alaska Native
Place of birth - Born in other state (%) - Multirace
Place of birth - Born in other state (%) - Other Race
Place of birth - Native, outside of US (%)
Place of birth - Native, outside of US (%) - White
Place of birth - Native, outside of US (%) - Black or African American
Place of birth - Native, outside of US (%) - Asian
Place of birth - Native, outside of US (%) - Hispanic or Latino
Place of birth - Native, outside of US (%) - American Indian and Alaska Native
Place of birth - Native, outside of US (%) - Multirace
Place of birth - Native, outside of US (%) - Other Race
Place of birth - Foreign born (%)
Place of birth - Foreign born (%) - White
Place of birth - Foreign born (%) - Black or African American
Place of birth - Foreign born (%) - Asian
Place of birth - Foreign born (%) - Hispanic or Latino
Place of birth - Foreign born (%) - American Indian and Alaska Native
Place of birth - Foreign born (%) - Multirace
Place of birth - Foreign born (%) - Other Race
Residents speaking English at home (%)
Residents speaking English at home - Born in the United States (%)
Residents speaking English at home - Native, born elsewhere (%)
Residents speaking English at home - Foreign born (%)
Residents speaking Spanish at home (%)
Residents speaking Spanish at home - Born in the United States (%)
Residents speaking Spanish at home - Native, born elsewhere (%)
Residents speaking Spanish at home - Foreign born (%)
Residents speaking other language at home (%)
Residents speaking other language at home - Born in the United States (%)
Residents speaking other language at home - Native, born elsewhere (%)
Residents speaking other language at home - Foreign born (%)
Marital status - Never married (%)
Marital status - Now married (%)
Marital status - Separated (%)
Marital status - Widowed (%)
Marital status - Divorced (%)
Ancestries Reported - Arab (%)
Ancestries Reported - Czech (%)
Ancestries Reported - Danish (%)
Ancestries Reported - Dutch (%)
Ancestries Reported - English (%)
Ancestries Reported - French (%)
Ancestries Reported - French Canadian (%)
Ancestries Reported - German (%)
Ancestries Reported - Greek (%)
Ancestries Reported - Hungarian (%)
Ancestries Reported - Irish (%)
Ancestries Reported - Italian (%)
Ancestries Reported - Lithuanian (%)
Ancestries Reported - Norwegian (%)
Ancestries Reported - Polish (%)
Ancestries Reported - Portuguese (%)
Ancestries Reported - Russian (%)
Ancestries Reported - Scotch-Irish (%)
Ancestries Reported - Scottish (%)
Ancestries Reported - Slovak (%)
Ancestries Reported - Subsaharan African (%)
Ancestries Reported - Swedish (%)
Ancestries Reported - Swiss (%)
Ancestries Reported - Ukrainian (%)
Ancestries Reported - United States (%)
Ancestries Reported - Welsh (%)
Ancestries Reported - West Indian (%)
Ancestries Reported - Other (%)
Geographical mobility - Same house 1 year ago (%)
Geographical mobility - Same house 1 year ago (%) - White
Geographical mobility - Same house 1 year ago (%) - Black or African American
Geographical mobility - Same house 1 year ago (%) - Asian
Geographical mobility - Same house 1 year ago (%) - Hispanic or Latino
Geographical mobility - Same house 1 year ago (%) - American Indian and Alaska Native
Geographical mobility - Same house 1 year ago (%) - Multirace
Geographical mobility - Same house 1 year ago (%) - Other Race
Geographical mobility - Moved within same county (%)
Geographical mobility - Moved within same county (%) - White
Geographical mobility - Moved within same county (%) - Black or African American
Geographical mobility - Moved within same county (%) - Asian
Geographical mobility - Moved within same county (%) - Hispanic or Latino
Geographical mobility - Moved within same county (%) - American Indian and Alaska Native
Geographical mobility - Moved within same county (%) - Multirace
Geographical mobility - Moved within same county (%) - Other Race
Geographical mobility - Moved from different county within same state (%)
Geographical mobility - Moved from different county within same state (%) - White
Geographical mobility - Moved from different county within same state (%) - Black or African American
Geographical mobility - Moved from different county within same state (%) - Asian
Geographical mobility - Moved from different county within same state (%) - Hispanic or Latino
Geographical mobility - Moved from different county within same state (%) - American Indian and Alaska Native
Geographical mobility - Moved from different county within same state (%) - Multirace
Geographical mobility - Moved from different county within same state (%) - Other Race
Geographical mobility - Moved from different state (%)
Geographical mobility - Moved from different state (%) - White
Geographical mobility - Moved from different state (%) - Black or African American
Geographical mobility - Moved from different state (%) - Asian
Geographical mobility - Moved from different state (%) - Hispanic or Latino
Geographical mobility - Moved from different state (%) - American Indian and Alaska Native
Geographical mobility - Moved from different state (%) - Multirace
Geographical mobility - Moved from different state (%) - Other Race
Geographical mobility - Moved from abroad (%)
Geographical mobility - Moved from abroad (%) - White
Geographical mobility - Moved from abroad (%) - Black or African American
Geographical mobility - Moved from abroad (%) - Asian
Geographical mobility - Moved from abroad (%) - Hispanic or Latino
Geographical mobility - Moved from abroad (%) - American Indian and Alaska Native
Geographical mobility - Moved from abroad (%) - Multirace
Geographical mobility - Moved from abroad (%) - Other Race
Place of birth for the foreign-born population - Ireland (%)
Place of birth for the foreign-born population - Denmark (%)
Place of birth for the foreign-born population - Norway (%)
Place of birth for the foreign-born population - Sweden (%)
Place of birth for the foreign-born population - United Kingdom (%)
Place of birth for the foreign-born population - England (%)
Place of birth for the foreign-born population - Scotland (%)
Place of birth for the foreign-born population - Other Northern Europe (%)
Place of birth for the foreign-born population - Austria (%)
Place of birth for the foreign-born population - Belgium (%)
Place of birth for the foreign-born population - France (%)
Place of birth for the foreign-born population - Germany (%)
Place of birth for the foreign-born population - Netherlands (%)
Place of birth for the foreign-born population - Switzerland (%)
Place of birth for the foreign-born population - Other Western Europe (%)
Place of birth for the foreign-born population - Greece (%)
Place of birth for the foreign-born population - Italy (%)
Place of birth for the foreign-born population - Portugal (%)
Place of birth for the foreign-born population - Spain (%)
Place of birth for the foreign-born population - Other Southern Europe (%)
Place of birth for the foreign-born population - Albania (%)
Place of birth for the foreign-born population - Belarus (%)
Place of birth for the foreign-born population - Bosnia and Herzegovina (%)
Place of birth for the foreign-born population - Bulgaria (%)
Place of birth for the foreign-born population - Croatia (%)
Place of birth for the foreign-born population - Czechoslovakia (%)
Place of birth for the foreign-born population - Hungary (%)
Place of birth for the foreign-born population - Latvia (%)
Place of birth for the foreign-born population - Lithuania (%)
Place of birth for the foreign-born population - North Macedonia (Macedonia) (%)
Place of birth for the foreign-born population - Moldova (%)
Place of birth for the foreign-born population - Poland (%)
Place of birth for the foreign-born population - Romania (%)
Place of birth for the foreign-born population - Russia (%)
Place of birth for the foreign-born population - Serbia (%)
Place of birth for the foreign-born population - Ukraine (%)
Place of birth for the foreign-born population - Other Eastern Europe (%)
Place of birth for the foreign-born population - China (%)
Place of birth for the foreign-born population - Hong Kong (%)
Place of birth for the foreign-born population - Taiwan (%)
Place of birth for the foreign-born population - Japan (%)
Place of birth for the foreign-born population - Korea (%)
Place of birth for the foreign-born population - Other Eastern Asia (%)
Place of birth for the foreign-born population - Afghanistan (%)
Place of birth for the foreign-born population - Bangladesh (%)
Place of birth for the foreign-born population - India (%)
Place of birth for the foreign-born population - Iran (%)
Place of birth for the foreign-born population - Kazakhstan (%)
Place of birth for the foreign-born population - Nepal (%)
Place of birth for the foreign-born population - Pakistan (%)
Place of birth for the foreign-born population - Sri Lanka (%)
Place of birth for the foreign-born population - Uzbekistan (%)
Place of birth for the foreign-born population - Other South Central Asia (%)
Place of birth for the foreign-born population - Burma (%)
Place of birth for the foreign-born population - Cambodia (%)
Place of birth for the foreign-born population - Indonesia (%)
Place of birth for the foreign-born population - Laos (%)
Place of birth for the foreign-born population - Malaysia (%)
Place of birth for the foreign-born population - Philippines (%)
Place of birth for the foreign-born population - Singapore (%)
Place of birth for the foreign-born population - Thailand (%)
Place of birth for the foreign-born population - Vietnam (%)
Place of birth for the foreign-born population - Other South Eastern Asia (%)
Place of birth for the foreign-born population - Armenia (%)
Place of birth for the foreign-born population - Iraq (%)
Place of birth for the foreign-born population - Israel (%)
Place of birth for the foreign-born population - Jordan (%)
Place of birth for the foreign-born population - Kuwait (%)
Place of birth for the foreign-born population - Lebanon (%)
Place of birth for the foreign-born population - Saudi Arabia (%)
Place of birth for the foreign-born population - Syria (%)
Place of birth for the foreign-born population - Turkey (%)
Place of birth for the foreign-born population - Yemen (%)
Place of birth for the foreign-born population - Other Western Asia (%)
Place of birth for the foreign-born population - Eritrea (%)
Place of birth for the foreign-born population - Ethiopia (%)
Place of birth for the foreign-born population - Kenya (%)
Place of birth for the foreign-born population - Somalia (%)
Place of birth for the foreign-born population - Uganda (%)
Place of birth for the foreign-born population - Zimbabwe (%)
Place of birth for the foreign-born population - Other Eastern Africa (%)
Place of birth for the foreign-born population - Cameroon (%)
Place of birth for the foreign-born population - Congo (%)
Place of birth for the foreign-born population - Democratic Republic of Congo (Zaire) (%)
Place of birth for the foreign-born population - Other Middle Africa (%)
Place of birth for the foreign-born population - Egypt (%)
Place of birth for the foreign-born population - Morocco (%)
Place of birth for the foreign-born population - Sudan (%)
Place of birth for the foreign-born population - Other Northern Africa (%)
Place of birth for the foreign-born population - South Africa (%)
Place of birth for the foreign-born population - Other Southern Africa (%)
Place of birth for the foreign-born population - Cabo Verde (%)
Place of birth for the foreign-born population - Ghana (%)
Place of birth for the foreign-born population - Liberia (%)
Place of birth for the foreign-born population - Nigeria (%)
Place of birth for the foreign-born population - Senegal (%)
Place of birth for the foreign-born population - Sierra Leone (%)
Place of birth for the foreign-born population - Other Western Africa (%)
Place of birth for the foreign-born population - Australia (%)
Place of birth for the foreign-born population - New Zealand (%)
Place of birth for the foreign-born population - Fiji (%)
Place of birth for the foreign-born population - Micronesia (%)
Place of birth for the foreign-born population - Bahamas (%)
Place of birth for the foreign-born population - Barbados (%)
Place of birth for the foreign-born population - Cuba (%)
Place of birth for the foreign-born population - Dominica (%)
Place of birth for the foreign-born population - Dominican Republic (%)
Place of birth for the foreign-born population - Grenada (%)
Place of birth for the foreign-born population - Haiti (%)
Place of birth for the foreign-born population - Jamaica (%)
Place of birth for the foreign-born population - St. Vincent and the Grenadines (%)
Place of birth for the foreign-born population - Trinidad and Tobago (%)
Place of birth for the foreign-born population - West Indies (%)
Place of birth for the foreign-born population - Other Caribbean (%)
Place of birth for the foreign-born population - Belize (%)
Place of birth for the foreign-born population - Costa Rica (%)
Place of birth for the foreign-born population - El Salvador (%)
Place of birth for the foreign-born population - Guatemala (%)
Place of birth for the foreign-born population - Honduras (%)
Place of birth for the foreign-born population - Mexico (%)
Place of birth for the foreign-born population - Nicaragua (%)
Place of birth for the foreign-born population - Panama (%)
Place of birth for the foreign-born population - Other Central America (%)
Place of birth for the foreign-born population - Argentina (%)
Place of birth for the foreign-born population - Bolivia (%)
Place of birth for the foreign-born population - Brazil (%)
Place of birth for the foreign-born population - Chile (%)
Place of birth for the foreign-born population - Colombia (%)
Place of birth for the foreign-born population - Ecuador (%)
Place of birth for the foreign-born population - Guyana (%)
Place of birth for the foreign-born population - Peru (%)
Place of birth for the foreign-born population - Uruguay (%)
Place of birth for the foreign-born population - Venezuela (%)
Place of birth for the foreign-born population - Other South America (%)
Place of birth for the foreign-born population - Canada (%)
Place of birth for the foreign-born population - Other Northern America (%)
Place of birth for the foreign-born population - Other (%)
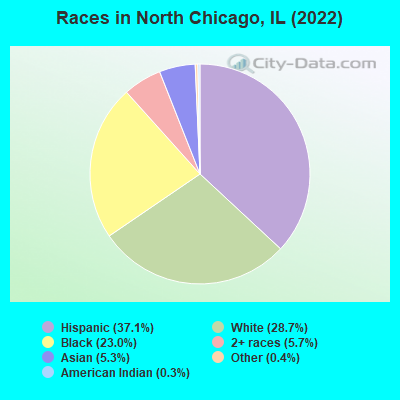
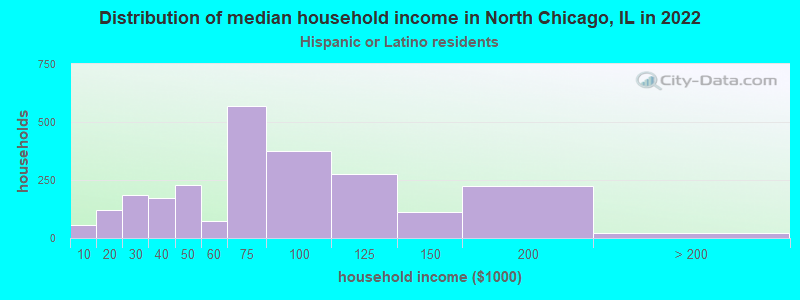
According to 2022 data, the most numerous races in North Chicago, IL are White alone (8,806 residents), Hispanic (11,389 residents), and Black alone (7,071 residents). 65.4% of North Chicago residents speak English at home. 17.7% of North Chicago, IL residents are foreign-born (13.1% born in Latin America, 2.8% born in Asia), which is 21.0% greater than the foreign-born rate of 14.0% across the entire state of Illinois.
Race distribution in North Chicago
2000 2022
8,424,140 67.8% White alone 1,856,152 14.9% Black alone 1,530,262 12.3% Hispanic 419,916 3.4% Asian alone 153,996 1.2% Two or more races 13,479 0.1% Other race alone 18,232 0.1% American Indian alone 3,116 0.03% Native Hawaiian and Other
7,356,301 58.5% White alone 2,299,726 18.3% Hispanic 1,660,423 13.2% Black alone 747,296 5.9% Asian alone 458,599 3.6% Two or more races 45,386 0.4% Other race alone 10,405 0.08% American Indian alone 3,896 0.03% Native Hawaiian and Other
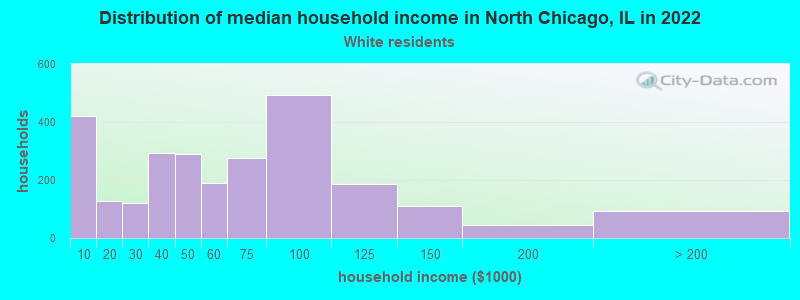
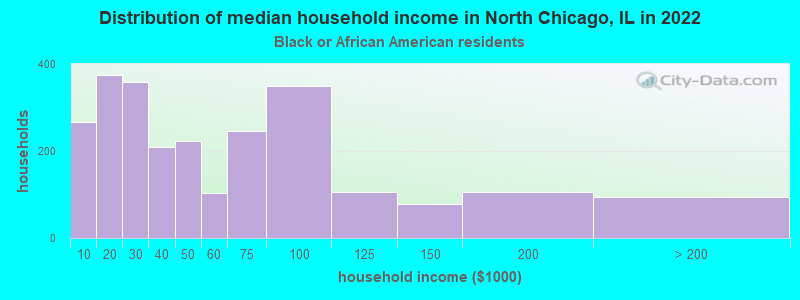
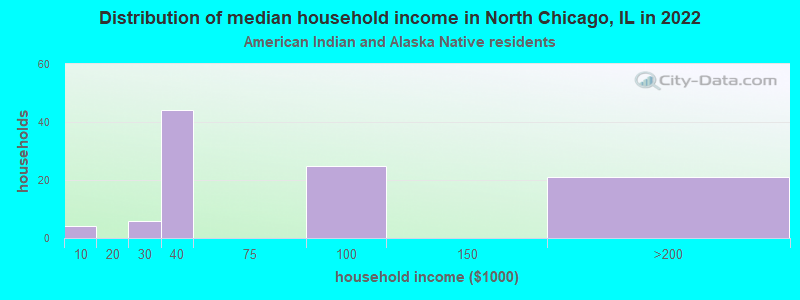
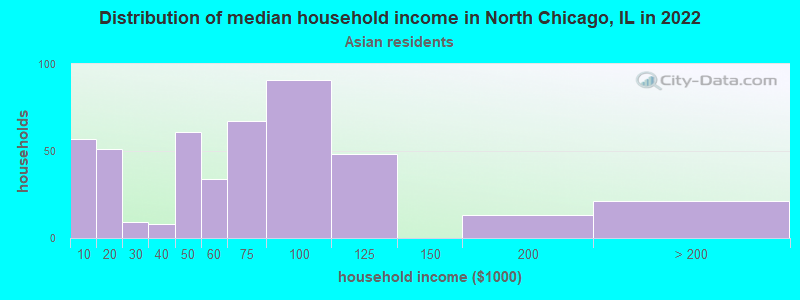
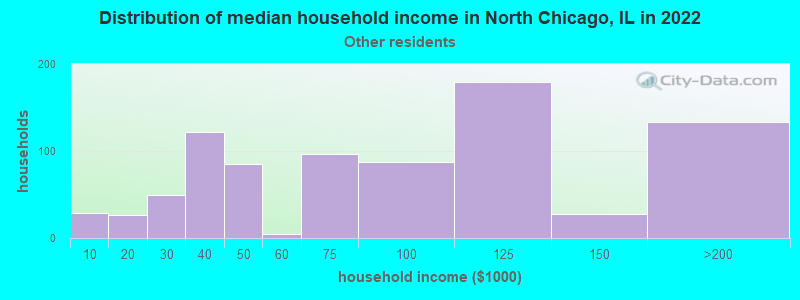
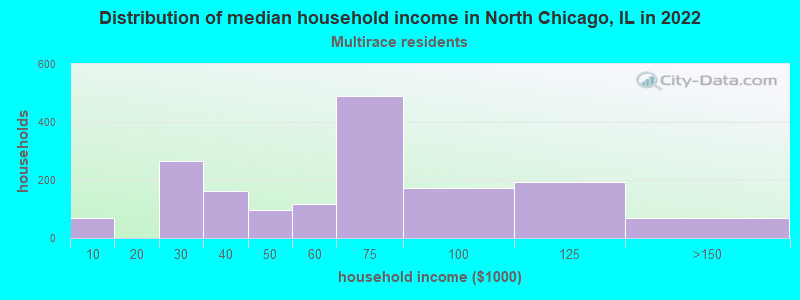
Income and house value in North Chicago Median household income in 2022 $45,043 White non-Hispanic householders$36,468 Black householders$45,201 Asian householders$87,099 Some other race householders$60,325 Two or more races householders$64,432 Hispanic or Latino race householdersMedian 2022 house value $150,774 White Non-Hispanic householders$130,214 Black or African American householders $184,772 Asian householders$148,624 Some other race householders$145,533 Two or more races householders$144,995 Hispanic or Latino householders
Median age by race in North Chicago
23.5 Median age for White residents23.2 24.5 25.7 Median age for Black or African American residents25.1 29.1 22.5 Median age for American Indian / Alaska Native residents23.0 26.1 24.5 Median age for Asian residents23.6 26.2 -593,236,714.4 Median age for Native Hawaiian / Pacific Islander residents-658,536,584.7 -576,015,108.0 27.7 Median age for Other race residents25.0 29.0 25.5 Median age for Two or more races residents24.8 28.0 23.5 Median age for White alone residents23.1 25.5 23.5 Median age for Hispanic or Latino residents23.1 23.9
Owner/renter occupied households by race in North Chicago
House owners and renters - White residents 705 26.8% Owner occupied1,926 73.2% Renter occupiedHouse owners and renters - Black or African American residents 743 30.5% Owner occupied1,689 69.5% Renter occupiedHouse owners and renters - American Indian / Alaska Native residents 31 29.0% Owner occupied75 71.0% Renter occupiedHouse owners and renters - Asian residents 102 23.8% Owner occupied326 76.2% Renter occupiedHouse owners and renters - Native Hawaiian / Pacific Islander residents 24 100.0% Renter occupiedHouse owners and renters - Other race residents 263 32.0% Owner occupied558 68.0% Renter occupiedHouse owners and renters - Two or more races residents 777 48.5% Owner occupied824 51.5% Renter occupiedHouse owners and renters - White alone residents 476 22.2% Owner occupied1,664 77.8% Renter occupiedHouse owners and renters - Hispanic or Latino residents 928 38.6% Owner occupied1,474 61.4% Renter occupied
Language usage in North Chicago
English speakers - Total 65.4% of residents of North Chicago speak English at home.
28.4% of residents speak Spanish at home 4,611 56.1% Speak English very well3,611 43.9% Speak English less than very well6.2% of residents speak other language at home 1,300 72.1% Speak English very well504 27.9% Speak English less than very well
English speakers - Born in the United States 81.8% of residents of North Chicago speak English at home.
16.0% of residents speak Spanish at home 1,945 85.0% Speak English very well343 15.0% Speak English less than very well3.6% of residents speak other language at home 421 81.3% Speak English very well97 18.7% Speak English less than very well
English speakers - Native, born elsewhere 43.0% of residents of North Chicago speak English at home.
52.4% of residents speak Spanish at home 168 53.7% Speak English very well145 46.3% Speak English less than very well0.8% of residents speak other language at home 5 100.0% Speak English very well
English speakers - Foreign-born 15.9% of residents of North Chicago speak English at home.
65.7% of residents speak Spanish at home 938 25.4% Speak English very well2,751 74.6% Speak English less than very well19.5% of residents speak other language at home 682 62.4% Speak English very well411 37.6% Speak English less than very well
White (Caucasian) - Speak only English Native:
83.1% (8,677)Foreign-born:
10.3% (85)
White (Caucasian) - Speak another language Native:
13.1% (1,371)Foreign-born:
83.8% (693)
Black or African American - Speak only English Native:
96.6% (6,489)Foreign-born:
58.9% (242)
Black or African American - Speak another language Native:
3.4% (229)Foreign-born:
40.9% (168)
American Indian / Alaska Native - Speak another language Native:
56.1% (393)Foreign-born:
100.0% (95)
Asian - Speak only English Native:
36.6% (262)Foreign-born:
15.8% (134)
Asian - Speak another language Native:
68.8% (492)Foreign-born:
83.3% (703)
Other race - Speak only English Native:
21.4% (416)Foreign-born:
13.5% (249)
Other race - Speak another language Native:
76.7% (1,489)Foreign-born:
87.3% (1,614)
Two or more races - Speak only English Native:
63.5% (2,357)Foreign-born:
12.9% (300)
Two or more races - Speak another language Native:
35.1% (1,303)Foreign-born:
85.9% (1,994)
White alone - Speak only English Native:
94.7% (7,848)Foreign-born:
22.9% (63)
White alone - Speak another language Native:
5.1% (425)Foreign-born:
76.7% (210)
Hispanic or Latino - Speak only English Native:
35.8% (2,364)Foreign-born:
8.7% (342)
Hispanic or Latino - Speak another language Native:
64.2% (4,236)Foreign-born:
91.6% (3,586)
Foreign-born residents in North Chicago 5,440 residents are foreign born (13.1% Latin America , 2.8% Asia ).
This city:
17.7%Illinois:
14.1%
Marital status for residents in North Chicago Marital status - White (Caucasian) population 15 years and over
Males 71.7% Never married22.8% Now married0.6% Separated0.6% Widowed4.2% DivorcedFemales 55.4% Never married29.7% Now married2.3% Separated2.9% Widowed9.8% DivorcedWomen who gave birth in the past 12 months Now married:
100.0% (117)Unmarried:
0.0% (0)
Women who did not give birth in the past 12 months Now married:
25.7% (735)Unmarried:
74.3% (2,128)
Marital status - Black or African American population 15 years and over
Males 67.3% Never married22.9% Now married1.2% Separated4.9% Widowed3.6% DivorcedFemales 56.5% Never married22.3% Now married3.2% Separated9.7% Widowed8.3% DivorcedWomen who gave birth in the past 12 months Now married:
7.8% (5)Unmarried:
92.2% (65)
Women who did not give birth in the past 12 months Now married:
19.2% (288)Unmarried:
80.8% (1,209)
Marital status - American Indian / Alaska Native population 15 years and over
Males 57.7% Never married41.2% Now married0.0% Separated0.0% Widowed1.1% DivorcedFemales 30.2% Never married28.6% Now married6.3% Separated4.8% Widowed30.2% DivorcedWomen who did not give birth in the past 12 months Now married:
38.6% (37)Unmarried:
61.4% (58)
Marital status - Asian population 15 years and over
Males 80.7% Never married15.7% Now married0.0% Separated0.9% Widowed2.7% DivorcedFemales 57.4% Never married25.7% Now married7.6% Separated4.5% Widowed4.7% DivorcedWomen who gave birth in the past 12 months Now married:
0.0% (0)Unmarried:
100.0% (20)
Women who did not give birth in the past 12 months Now married:
30.9% (139)Unmarried:
69.1% (309)
Marital status - Other race population 15 years and over
Males 43.0% Never married47.6% Now married0.0% Separated0.0% Widowed9.4% DivorcedFemales 42.1% Never married49.7% Now married1.6% Separated3.7% Widowed2.9% DivorcedWomen who gave birth in the past 12 months Now married:
75.6% (60)Unmarried:
24.4% (19)
Women who did not give birth in the past 12 months Now married:
45.1% (429)Unmarried:
54.9% (523)
Marital status - Two or more races population 15 years and over
Males 59.3% Never married27.7% Now married0.8% Separated1.1% Widowed11.2% DivorcedFemales 46.9% Never married38.3% Now married3.4% Separated3.0% Widowed8.5% DivorcedWomen who gave birth in the past 12 months Now married:
100.0% (82)Unmarried:
0.0% (0)
Women who did not give birth in the past 12 months Now married:
33.1% (474)Unmarried:
66.9% (956)
Marital status - White alone, not Hispanic / Latino population 15 years and over
Males 71.4% Never married22.2% Now married0.6% Separated0.6% Widowed5.2% DivorcedFemales 50.9% Never married33.5% Now married1.5% Separated3.5% Widowed10.6% DivorcedWomen who gave birth in the past 12 months Now married:
100.0% (117)Unmarried:
0.0% (0)
Women who did not give birth in the past 12 months Now married:
27.7% (527)Unmarried:
72.3% (1,374)
Marital status - Hispanic or Latino population 15 years and over
Males 57.6% Never married33.8% Now married0.2% Separated0.6% Widowed7.8% DivorcedFemales 50.8% Never married36.8% Now married3.3% Separated2.5% Widowed6.5% DivorcedWomen who gave birth in the past 12 months Now married:
87.2% (132)Unmarried:
12.8% (20)
Women who did not give birth in the past 12 months Now married:
34.1% (1,019)Unmarried:
65.9% (1,973)
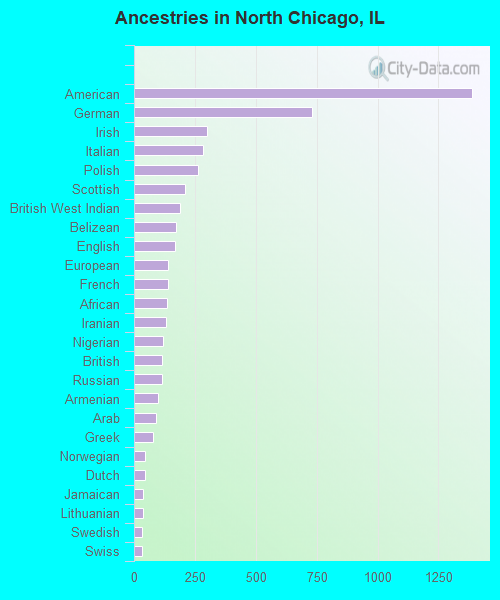
Ancestries in North Chicago
1,388 7.3% American729 3.8% German301 1.6% Irish285 1.5% Italian263 1.4% Polish211 1.1% Scottish187 1.0% British West Indian173 0.9% Belizean167 0.9% English139 0.7% European138 0.7% French137 0.7% African133 0.7% Iranian118 0.6% Nigerian116 0.6% British114 0.6% Russian99 0.5% Armenian90 0.5% Arab80 0.4% Greek47 0.2% Norwegian46 0.2% Dutch37 0.2% Jamaican36 0.2% Lithuanian34 0.2% Swedish34 0.2% Swiss27 0.1% Ukrainian26 0.1% South African19 0.10% Slovene16 0.08% German Russian13 0.07% Eastern European13 0.07% Brazilian13 0.07% Welsh11 0.06% Danish11 0.06% Albanian10 0.05% Estonian8 0.04% Haitian5 0.03% Luxembourger5 0.03% Scandinavian5 0.03% Sierra Leonean3 0.02% Afghan2 0.01% Egyptian
Geographical mobility in North Chicago Same house 1 year ago 6,245 54.3% White (Caucasian)5,652 74.9% Black or African American236 32.6% American Indian / Alaska Native749 46.0% Asian2,936 71.1% Other race4,914 76.4% Two or more races4,343 49.5% White alone, not Hispanic / Latino8,006 71.0% Hispanic or LatinoMoved within same county 524 4.6% White / Caucasian259 3.4% Black or African American6 0.9% American Indian / Alaska Native155 9.5% Asian19 94.6% Native Hawaiian / Pacific Islander582 14.1% Other race709 11.0% Two or more races404 4.6% White alone, not Hispanic / Latino1,137 10.1% Hispanic or LatinoMoved within same state 355 3.1% White / Caucasian164 2.2% Black or African American177 10.9% Asian236 5.7% Other race18 0.3% Two or more races354 4.0% White alone, not Hispanic / Latino161 1.4% Hispanic or LatinoMoved from different state 4,408 38.3% White / Caucasian643 8.5% Black or African American473 65.4% American Indian / Alaska Native323 19.9% Asian248 6.0% Other race459 7.1% Two or more races3,801 43.3% White alone, not Hispanic / Latino2,255 20.0% Hispanic or LatinoMoved from abroad 337 2.9% White578 7.7% Black or African American54 3.3% Asian29 0.7% Other race108 1.7% Two or more races377 4.3% White alone, not Hispanic / Latino103 0.9% Hispanic or Latino
Children Nativity (place of birth) in North Chicago
Children under 6 years - Living with two parents Both parents native 541 100.0% NativeBoth parents foreign-born 329 90.5% Native34 9.5% Foreign-bornOne native, one foreign-born parent 221 100.0% NativeChildren under 6 years - Living with one parent Native parent 623 100.0% NativeForeign-born parent 120 72.9% Native45 27.1% Foreign-bornChildren 6 to 17 years - Living with two parents Both parents native 530 100.0% NativeBoth parents foreign-born 502 76.4% Native155 23.6% Foreign-bornOne native, one foreign-born parent 463 100.0% NativeChildren 6 to 17 years - Living with one parent Native parent 762 100.0% NativeForeign-born parent 355 59.6% Native240 40.4% Foreign-born
Grandparents responsible for own grandchildren in North Chicago
Grandparents (30 to 59 years) White / Caucasian 40 62.4% Responsible for grandchildren24 37.6% Not responsible for grandchildrenBlack or African American 27 43.1% Responsible for grandchildren36 56.9% Not responsible for grandchildrenOther race 25 14.8% Responsible for grandchildren144 85.2% Not responsible for grandchildrenTwo or more races 113 100.0% Not responsible for grandchildrenWhite alone, not Hispanic / Latino 25 100.0% Not responsible for grandchildrenHispanic or Latino 48 19.3% Responsible for grandchildren199 80.7% Not responsible for grandchildrenGrandparents (60 years and over) White / Caucasian 10 49.7% Responsible for grandchildren10 50.3% Not responsible for grandchildrenBlack or African American 61 47.8% Responsible for grandchildren67 52.2% Not responsible for grandchildrenTwo or more races 80 100.0% Not responsible for grandchildrenWhite alone, not Hispanic / Latino 13 65.3% Responsible for grandchildren7 34.7% Not responsible for grandchildrenHispanic or Latino 53 100.0% Not responsible for grandchildren