Races in North Fort Lewis, Washington (WA) Detailed Stats
Data:
Races - White alone (%)
Races - White alone (% change since 2000)
Races - Black alone (%)
Races - Black alone (% change since 2000)
Races - American Indian alone (%)
Races - American Indian alone (% change since 2000)
Races - Asian alone (%)
Races - Asian alone (% change since 2000)
Races - Hispanic (%)
Races - Hispanic (% change since 2000)
Races - Native Hawaiian and Other Pacific Islander alone (%)
Races - Native Hawaiian and Other Pacific Islander alone (% change since 2000)
Races - Two or more races(%)
Races - Two or more races(% change since 2000)
Races - Other race alone (%)
Races - Other race alone (% change since 2000)
Racial diversity
Place of birth - Born in state of residence (%)
Place of birth - Born in state of residence (%) - White
Place of birth - Born in state of residence (%) - Black or African American
Place of birth - Born in state of residence (%) - Asian
Place of birth - Born in state of residence (%) - Hispanic or Latino
Place of birth - Born in state of residence (%) - American Indian and Alaska Native
Place of birth - Born in state of residence (%) - Multirace
Place of birth - Born in state of residence (%) - Other Race
Place of birth - Born in other state (%)
Place of birth - Born in other state (%) - White
Place of birth - Born in other state (%) - Black or African American
Place of birth - Born in other state (%) - Asian
Place of birth - Born in other state (%) - Hispanic or Latino
Place of birth - Born in other state (%) - American Indian and Alaska Native
Place of birth - Born in other state (%) - Multirace
Place of birth - Born in other state (%) - Other Race
Place of birth - Native, outside of US (%)
Place of birth - Native, outside of US (%) - White
Place of birth - Native, outside of US (%) - Black or African American
Place of birth - Native, outside of US (%) - Asian
Place of birth - Native, outside of US (%) - Hispanic or Latino
Place of birth - Native, outside of US (%) - American Indian and Alaska Native
Place of birth - Native, outside of US (%) - Multirace
Place of birth - Native, outside of US (%) - Other Race
Place of birth - Foreign born (%)
Place of birth - Foreign born (%) - White
Place of birth - Foreign born (%) - Black or African American
Place of birth - Foreign born (%) - Asian
Place of birth - Foreign born (%) - Hispanic or Latino
Place of birth - Foreign born (%) - American Indian and Alaska Native
Place of birth - Foreign born (%) - Multirace
Place of birth - Foreign born (%) - Other Race
Residents speaking English at home (%)
Residents speaking English at home - Born in the United States (%)
Residents speaking English at home - Native, born elsewhere (%)
Residents speaking English at home - Foreign born (%)
Residents speaking Spanish at home (%)
Residents speaking Spanish at home - Born in the United States (%)
Residents speaking Spanish at home - Native, born elsewhere (%)
Residents speaking Spanish at home - Foreign born (%)
Residents speaking other language at home (%)
Residents speaking other language at home - Born in the United States (%)
Residents speaking other language at home - Native, born elsewhere (%)
Residents speaking other language at home - Foreign born (%)
Marital status - Never married (%)
Marital status - Now married (%)
Marital status - Separated (%)
Marital status - Widowed (%)
Marital status - Divorced (%)
Ancestries Reported - Arab (%)
Ancestries Reported - Czech (%)
Ancestries Reported - Danish (%)
Ancestries Reported - Dutch (%)
Ancestries Reported - English (%)
Ancestries Reported - French (%)
Ancestries Reported - French Canadian (%)
Ancestries Reported - German (%)
Ancestries Reported - Greek (%)
Ancestries Reported - Hungarian (%)
Ancestries Reported - Irish (%)
Ancestries Reported - Italian (%)
Ancestries Reported - Lithuanian (%)
Ancestries Reported - Norwegian (%)
Ancestries Reported - Polish (%)
Ancestries Reported - Portuguese (%)
Ancestries Reported - Russian (%)
Ancestries Reported - Scotch-Irish (%)
Ancestries Reported - Scottish (%)
Ancestries Reported - Slovak (%)
Ancestries Reported - Subsaharan African (%)
Ancestries Reported - Swedish (%)
Ancestries Reported - Swiss (%)
Ancestries Reported - Ukrainian (%)
Ancestries Reported - United States (%)
Ancestries Reported - Welsh (%)
Ancestries Reported - West Indian (%)
Ancestries Reported - Other (%)
Geographical mobility - Same house 1 year ago (%)
Geographical mobility - Same house 1 year ago (%) - White
Geographical mobility - Same house 1 year ago (%) - Black or African American
Geographical mobility - Same house 1 year ago (%) - Asian
Geographical mobility - Same house 1 year ago (%) - Hispanic or Latino
Geographical mobility - Same house 1 year ago (%) - American Indian and Alaska Native
Geographical mobility - Same house 1 year ago (%) - Multirace
Geographical mobility - Same house 1 year ago (%) - Other Race
Geographical mobility - Moved within same county (%)
Geographical mobility - Moved within same county (%) - White
Geographical mobility - Moved within same county (%) - Black or African American
Geographical mobility - Moved within same county (%) - Asian
Geographical mobility - Moved within same county (%) - Hispanic or Latino
Geographical mobility - Moved within same county (%) - American Indian and Alaska Native
Geographical mobility - Moved within same county (%) - Multirace
Geographical mobility - Moved within same county (%) - Other Race
Geographical mobility - Moved from different county within same state (%)
Geographical mobility - Moved from different county within same state (%) - White
Geographical mobility - Moved from different county within same state (%) - Black or African American
Geographical mobility - Moved from different county within same state (%) - Asian
Geographical mobility - Moved from different county within same state (%) - Hispanic or Latino
Geographical mobility - Moved from different county within same state (%) - American Indian and Alaska Native
Geographical mobility - Moved from different county within same state (%) - Multirace
Geographical mobility - Moved from different county within same state (%) - Other Race
Geographical mobility - Moved from different state (%)
Geographical mobility - Moved from different state (%) - White
Geographical mobility - Moved from different state (%) - Black or African American
Geographical mobility - Moved from different state (%) - Asian
Geographical mobility - Moved from different state (%) - Hispanic or Latino
Geographical mobility - Moved from different state (%) - American Indian and Alaska Native
Geographical mobility - Moved from different state (%) - Multirace
Geographical mobility - Moved from different state (%) - Other Race
Geographical mobility - Moved from abroad (%)
Geographical mobility - Moved from abroad (%) - White
Geographical mobility - Moved from abroad (%) - Black or African American
Geographical mobility - Moved from abroad (%) - Asian
Geographical mobility - Moved from abroad (%) - Hispanic or Latino
Geographical mobility - Moved from abroad (%) - American Indian and Alaska Native
Geographical mobility - Moved from abroad (%) - Multirace
Geographical mobility - Moved from abroad (%) - Other Race
Place of birth for the foreign-born population - Ireland (%)
Place of birth for the foreign-born population - Denmark (%)
Place of birth for the foreign-born population - Norway (%)
Place of birth for the foreign-born population - Sweden (%)
Place of birth for the foreign-born population - United Kingdom (%)
Place of birth for the foreign-born population - England (%)
Place of birth for the foreign-born population - Scotland (%)
Place of birth for the foreign-born population - Other Northern Europe (%)
Place of birth for the foreign-born population - Austria (%)
Place of birth for the foreign-born population - Belgium (%)
Place of birth for the foreign-born population - France (%)
Place of birth for the foreign-born population - Germany (%)
Place of birth for the foreign-born population - Netherlands (%)
Place of birth for the foreign-born population - Switzerland (%)
Place of birth for the foreign-born population - Other Western Europe (%)
Place of birth for the foreign-born population - Greece (%)
Place of birth for the foreign-born population - Italy (%)
Place of birth for the foreign-born population - Portugal (%)
Place of birth for the foreign-born population - Spain (%)
Place of birth for the foreign-born population - Other Southern Europe (%)
Place of birth for the foreign-born population - Albania (%)
Place of birth for the foreign-born population - Belarus (%)
Place of birth for the foreign-born population - Bosnia and Herzegovina (%)
Place of birth for the foreign-born population - Bulgaria (%)
Place of birth for the foreign-born population - Croatia (%)
Place of birth for the foreign-born population - Czechoslovakia (%)
Place of birth for the foreign-born population - Hungary (%)
Place of birth for the foreign-born population - Latvia (%)
Place of birth for the foreign-born population - Lithuania (%)
Place of birth for the foreign-born population - North Macedonia (Macedonia) (%)
Place of birth for the foreign-born population - Moldova (%)
Place of birth for the foreign-born population - Poland (%)
Place of birth for the foreign-born population - Romania (%)
Place of birth for the foreign-born population - Russia (%)
Place of birth for the foreign-born population - Serbia (%)
Place of birth for the foreign-born population - Ukraine (%)
Place of birth for the foreign-born population - Other Eastern Europe (%)
Place of birth for the foreign-born population - China (%)
Place of birth for the foreign-born population - Hong Kong (%)
Place of birth for the foreign-born population - Taiwan (%)
Place of birth for the foreign-born population - Japan (%)
Place of birth for the foreign-born population - Korea (%)
Place of birth for the foreign-born population - Other Eastern Asia (%)
Place of birth for the foreign-born population - Afghanistan (%)
Place of birth for the foreign-born population - Bangladesh (%)
Place of birth for the foreign-born population - India (%)
Place of birth for the foreign-born population - Iran (%)
Place of birth for the foreign-born population - Kazakhstan (%)
Place of birth for the foreign-born population - Nepal (%)
Place of birth for the foreign-born population - Pakistan (%)
Place of birth for the foreign-born population - Sri Lanka (%)
Place of birth for the foreign-born population - Uzbekistan (%)
Place of birth for the foreign-born population - Other South Central Asia (%)
Place of birth for the foreign-born population - Burma (%)
Place of birth for the foreign-born population - Cambodia (%)
Place of birth for the foreign-born population - Indonesia (%)
Place of birth for the foreign-born population - Laos (%)
Place of birth for the foreign-born population - Malaysia (%)
Place of birth for the foreign-born population - Philippines (%)
Place of birth for the foreign-born population - Singapore (%)
Place of birth for the foreign-born population - Thailand (%)
Place of birth for the foreign-born population - Vietnam (%)
Place of birth for the foreign-born population - Other South Eastern Asia (%)
Place of birth for the foreign-born population - Armenia (%)
Place of birth for the foreign-born population - Iraq (%)
Place of birth for the foreign-born population - Israel (%)
Place of birth for the foreign-born population - Jordan (%)
Place of birth for the foreign-born population - Kuwait (%)
Place of birth for the foreign-born population - Lebanon (%)
Place of birth for the foreign-born population - Saudi Arabia (%)
Place of birth for the foreign-born population - Syria (%)
Place of birth for the foreign-born population - Turkey (%)
Place of birth for the foreign-born population - Yemen (%)
Place of birth for the foreign-born population - Other Western Asia (%)
Place of birth for the foreign-born population - Eritrea (%)
Place of birth for the foreign-born population - Ethiopia (%)
Place of birth for the foreign-born population - Kenya (%)
Place of birth for the foreign-born population - Somalia (%)
Place of birth for the foreign-born population - Uganda (%)
Place of birth for the foreign-born population - Zimbabwe (%)
Place of birth for the foreign-born population - Other Eastern Africa (%)
Place of birth for the foreign-born population - Cameroon (%)
Place of birth for the foreign-born population - Congo (%)
Place of birth for the foreign-born population - Democratic Republic of Congo (Zaire) (%)
Place of birth for the foreign-born population - Other Middle Africa (%)
Place of birth for the foreign-born population - Egypt (%)
Place of birth for the foreign-born population - Morocco (%)
Place of birth for the foreign-born population - Sudan (%)
Place of birth for the foreign-born population - Other Northern Africa (%)
Place of birth for the foreign-born population - South Africa (%)
Place of birth for the foreign-born population - Other Southern Africa (%)
Place of birth for the foreign-born population - Cabo Verde (%)
Place of birth for the foreign-born population - Ghana (%)
Place of birth for the foreign-born population - Liberia (%)
Place of birth for the foreign-born population - Nigeria (%)
Place of birth for the foreign-born population - Senegal (%)
Place of birth for the foreign-born population - Sierra Leone (%)
Place of birth for the foreign-born population - Other Western Africa (%)
Place of birth for the foreign-born population - Australia (%)
Place of birth for the foreign-born population - New Zealand (%)
Place of birth for the foreign-born population - Fiji (%)
Place of birth for the foreign-born population - Micronesia (%)
Place of birth for the foreign-born population - Bahamas (%)
Place of birth for the foreign-born population - Barbados (%)
Place of birth for the foreign-born population - Cuba (%)
Place of birth for the foreign-born population - Dominica (%)
Place of birth for the foreign-born population - Dominican Republic (%)
Place of birth for the foreign-born population - Grenada (%)
Place of birth for the foreign-born population - Haiti (%)
Place of birth for the foreign-born population - Jamaica (%)
Place of birth for the foreign-born population - St. Vincent and the Grenadines (%)
Place of birth for the foreign-born population - Trinidad and Tobago (%)
Place of birth for the foreign-born population - West Indies (%)
Place of birth for the foreign-born population - Other Caribbean (%)
Place of birth for the foreign-born population - Belize (%)
Place of birth for the foreign-born population - Costa Rica (%)
Place of birth for the foreign-born population - El Salvador (%)
Place of birth for the foreign-born population - Guatemala (%)
Place of birth for the foreign-born population - Honduras (%)
Place of birth for the foreign-born population - Mexico (%)
Place of birth for the foreign-born population - Nicaragua (%)
Place of birth for the foreign-born population - Panama (%)
Place of birth for the foreign-born population - Other Central America (%)
Place of birth for the foreign-born population - Argentina (%)
Place of birth for the foreign-born population - Bolivia (%)
Place of birth for the foreign-born population - Brazil (%)
Place of birth for the foreign-born population - Chile (%)
Place of birth for the foreign-born population - Colombia (%)
Place of birth for the foreign-born population - Ecuador (%)
Place of birth for the foreign-born population - Guyana (%)
Place of birth for the foreign-born population - Peru (%)
Place of birth for the foreign-born population - Uruguay (%)
Place of birth for the foreign-born population - Venezuela (%)
Place of birth for the foreign-born population - Other South America (%)
Place of birth for the foreign-born population - Canada (%)
Place of birth for the foreign-born population - Other Northern America (%)
Place of birth for the foreign-born population - Other (%)
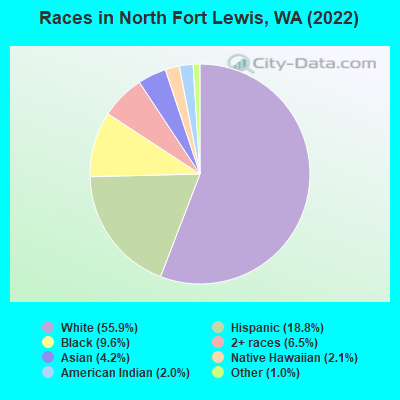
According to 2022 data, the most numerous races in North Fort Lewis, WA are White alone (3,399 residents), Hispanic (1,141 residents), and Asian alone (256 residents). 79.1% of North Fort Lewis residents speak English at home.
Race distribution in North Fort Lewis 3,399 55.9% White alone 1,141 18.8% Hispanic 584 9.6% Black alone 396 6.5% Two or more races 256 4.2% Asian alone 126 2.1% Native Hawaiian and Other 123 2.0% American Indian alone 60 1.0% Other race alone
2000 2022
4,652,490 78.9% White alone 441,509 7.5% Hispanic 319,401 5.4% Asian alone 184,631 3.1% Black alone 175,926 3.0% Two or more races 85,396 1.4% American Indian alone 22,779 0.4% Native Hawaiian and Other 11,989 0.2% Other race alone
4,941,456 63.5% White alone 1,093,313 14.0% Hispanic 755,832 9.7% Asian alone 523,448 6.7% Two or more races 299,537 3.8% Black alone 69,024 0.9% American Indian alone 52,231 0.7% Native Hawaiian and Other 50,945 0.7% Other race alone
Income and house value in North Fort Lewis Median household income in 2022 $67,367 White non-Hispanic householders$45,876 Black householders$97,339 Asian householders$68,682 Some other race householders$89,789 Two or more races householders$82,426 Hispanic or Latino race householders
Median age by race in North Fort Lewis
23.8 Median age for White residents23.9 23.8 28.0 Median age for Black or African American residents26.2 29.9 20.7 Median age for American Indian / Alaska Native residents23.9 -519,527,701.6 24.0 Median age for Asian residents24.8 25.2 26.1 Median age for Native Hawaiian / Pacific Islander residents28.9 23.7 26.7 Median age for Other race residents25.7 26.9 21.3 Median age for Two or more races residents23.3 15.4 24.2 Median age for White alone residents23.9 25.0 24.4 Median age for Hispanic or Latino residents25.5 21.0
Owner/renter occupied households by race in North Fort Lewis
House owners and renters - White residents 738 100.0% Renter occupiedHouse owners and renters - Black or African American residents 175 100.0% Renter occupiedHouse owners and renters - American Indian / Alaska Native residents 32 100.0% Renter occupiedHouse owners and renters - Asian residents 45 100.0% Renter occupiedHouse owners and renters - Native Hawaiian / Pacific Islander residents 27 100.0% Renter occupiedHouse owners and renters - Other race residents 44 100.0% Renter occupiedHouse owners and renters - Two or more races residents 85 100.0% Renter occupiedHouse owners and renters - White alone residents 675 100.0% Renter occupiedHouse owners and renters - Hispanic or Latino residents 165 100.0% Renter occupied
Language usage in North Fort Lewis
English speakers - Total 79.1% of residents of North Fort Lewis speak English at home.
10.6% of residents speak Spanish at home 423 72.7% Speak English very well159 27.3% Speak English less than very well9.9% of residents speak other language at home 464 85.6% Speak English very well78 14.4% Speak English less than very well
English speakers - Born in the United States 86.1% of residents of North Fort Lewis speak English at home.
10.5% of residents speak Spanish at home 291 63.5% Speak English very well167 36.5% Speak English less than very well3.4% of residents speak other language at home 147 98.0% Speak English very well3 2.0% Speak English less than very well
English speakers - Native, born elsewhere 42.6% of residents of North Fort Lewis speak English at home.
26.2% of residents speak Spanish at home 75 96.2% Speak English very well3 3.8% Speak English less than very well27.2% of residents speak other language at home 81 100.0% Speak English very well
English speakers - Foreign-born 10.3% of residents of North Fort Lewis speak English at home.
11.8% of residents speak Spanish at home 40 85.1% Speak English very well7 14.9% Speak English less than very well79.2% of residents speak other language at home 242 76.6% Speak English very well74 23.4% Speak English less than very well
White (Caucasian) - Speak another language Native:
5.0% (168)Foreign-born:
100.0% (75)
Black or African American - Speak only English Native:
92.8% (550)Foreign-born:
17.2% (10)
Black or African American - Speak another language Native:
7.4% (44)Foreign-born:
79.3% (46)
Asian - Speak only English Native:
25.4% (19)Foreign-born:
10.4% (15)
Asian - Speak another language Native:
69.2% (52)Foreign-born:
86.7% (127)
Native Hawaiian / Pacific Islander - Speak another language Native:
50.6% (20)Foreign-born:
91.9% (52)
Other race - Speak only English Native:
18.8% (73)Foreign-born:
100.0% (11)
Two or more races - Speak another language Native:
30.4% (148)Foreign-born:
100.0% (41)
White alone - Speak another language Native:
2.7% (82)Foreign-born:
100.0% (61)
Hispanic or Latino - Speak only English Native:
44.6% (417)Foreign-born:
19.2% (13)
Hispanic or Latino - Speak another language Native:
53.2% (496)Foreign-born:
78.0% (53)
Foreign-born residents in North Fort Lewis
Marital status for residents in North Fort Lewis Marital status - White (Caucasian) population 15 years and over
Males 55.5% Never married41.0% Now married0.8% Separated0.0% Widowed2.6% DivorcedFemales 22.9% Never married75.0% Now married0.0% Separated0.0% Widowed2.1% DivorcedWomen who gave birth in the past 12 months Now married:
100.0% (163)Unmarried:
0.0% (0)
Women who did not give birth in the past 12 months Now married:
70.9% (600)Unmarried:
29.1% (246)
Marital status - Black or African American population 15 years and over
Males 54.9% Never married43.7% Now married0.0% Separated0.0% Widowed1.4% DivorcedFemales 32.4% Never married58.0% Now married0.0% Separated0.0% Widowed9.7% DivorcedWomen who did not give birth in the past 12 months Now married:
59.0% (100)Unmarried:
41.0% (70)
Marital status - Asian population 15 years and over
Males 61.9% Never married38.1% Now married0.0% Separated0.0% Widowed0.0% DivorcedFemales 36.7% Never married63.3% Now married0.0% Separated0.0% Widowed0.0% DivorcedWomen who did not give birth in the past 12 months Now married:
63.3% (52)Unmarried:
36.7% (30)
Marital status - Native Hawaiian / Pacific Islander population 15 years and over
Males 43.6% Never married56.4% Now married0.0% Separated0.0% Widowed0.0% DivorcedFemales 56.5% Never married43.5% Now married0.0% Separated0.0% Widowed0.0% DivorcedWomen who did not give birth in the past 12 months Now married:
43.5% (23)Unmarried:
56.5% (29)
Marital status - Other race population 15 years and over
Males 67.9% Never married32.1% Now married0.0% Separated0.0% Widowed0.0% DivorcedFemales 41.7% Never married58.3% Now married0.0% Separated0.0% Widowed0.0% DivorcedWomen who did not give birth in the past 12 months Now married:
58.3% (46)Unmarried:
41.7% (33)
Marital status - Two or more races population 15 years and over
Males 56.2% Never married43.8% Now married0.0% Separated0.0% Widowed0.0% DivorcedFemales 44.9% Never married43.8% Now married0.0% Separated11.2% Widowed0.0% DivorcedWomen who did not give birth in the past 12 months Now married:
43.8% (51)Unmarried:
56.2% (66)
Marital status - White alone, not Hispanic / Latino population 15 years and over
Males 56.0% Never married40.4% Now married0.9% Separated0.0% Widowed2.8% DivorcedFemales 19.2% Never married78.3% Now married0.0% Separated0.0% Widowed2.5% DivorcedWomen who gave birth in the past 12 months Now married:
100.0% (162)Unmarried:
0.0% (0)
Women who did not give birth in the past 12 months Now married:
74.5% (537)Unmarried:
25.5% (183)
Marital status - Hispanic or Latino population 15 years and over
Males 61.0% Never married39.0% Now married0.0% Separated0.0% Widowed0.0% DivorcedFemales 41.0% Never married55.6% Now married0.0% Separated3.4% Widowed0.0% DivorcedWomen who gave birth in the past 12 months Now married:
100.0% (5)Unmarried:
0.0% (0)
Women who did not give birth in the past 12 months Now married:
54.9% (171)Unmarried:
45.1% (141)
Ancestries in North Fort Lewis
561 19.0% German161 5.5% Irish160 5.4% European142 4.8% English87 2.9% American69 2.3% German Russian44 1.5% Scottish39 1.3% Italian35 1.2% Ethiopian29 1.0% Swedish25 0.8% Scotch-Irish24 0.8% Armenian24 0.8% Scandinavian24 0.8% Jamaican19 0.6% Iranian18 0.6% Polish15 0.5% British14 0.5% Czech5 0.2% African4 0.1% Austrian4 0.1% Portuguese
Children Nativity (place of birth) in North Fort Lewis
Children under 6 years - Living with two parents Both parents native 596 100.0% NativeBoth parents foreign-born 49 100.0% NativeOne native, one foreign-born parent 54 100.0% NativeChildren under 6 years - Living with one parent Native parent 33 100.0% Native
Children 6 to 17 years - Living with two parents Both parents native 741 100.0% NativeBoth parents foreign-born 29 100.0% NativeOne native, one foreign-born parent 75 100.0% NativeChildren 6 to 17 years - Living with one parent Native parent 22 100.0% Native
Grandparents responsible for own grandchildren in North Fort Lewis
Grandparents (30 to 59 years) White / Caucasian 19 100.0% Not responsible for grandchildrenWhite alone, not Hispanic / Latino 20 100.0% Not responsible for grandchildren
Grandparents (60 years and over)