Races in North Lauderdale, Florida (FL) Detailed Stats
Data:
Races - White alone (%)
Races - White alone (% change since 2000)
Races - Black alone (%)
Races - Black alone (% change since 2000)
Races - American Indian alone (%)
Races - American Indian alone (% change since 2000)
Races - Asian alone (%)
Races - Asian alone (% change since 2000)
Races - Hispanic (%)
Races - Hispanic (% change since 2000)
Races - Native Hawaiian and Other Pacific Islander alone (%)
Races - Native Hawaiian and Other Pacific Islander alone (% change since 2000)
Races - Two or more races(%)
Races - Two or more races(% change since 2000)
Races - Other race alone (%)
Races - Other race alone (% change since 2000)
Racial diversity
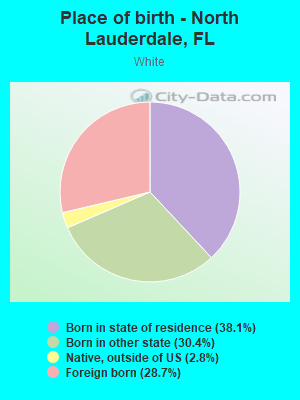
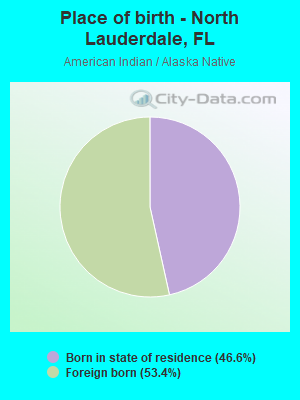
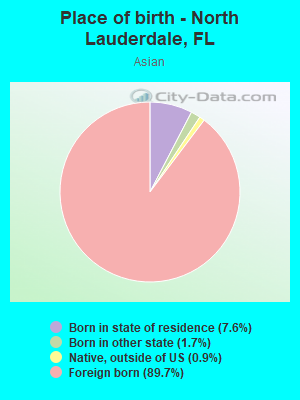
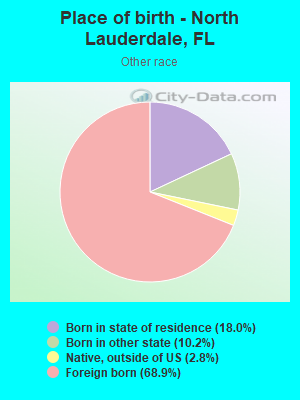
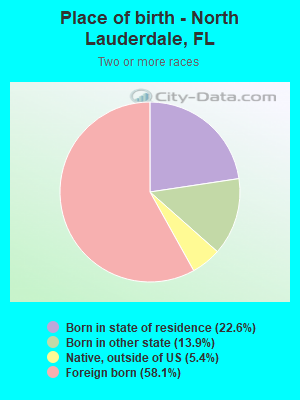
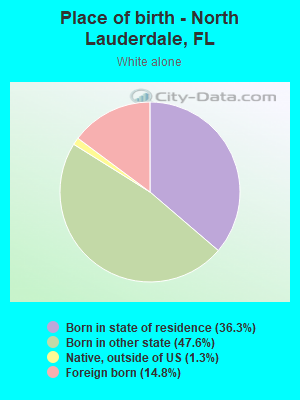
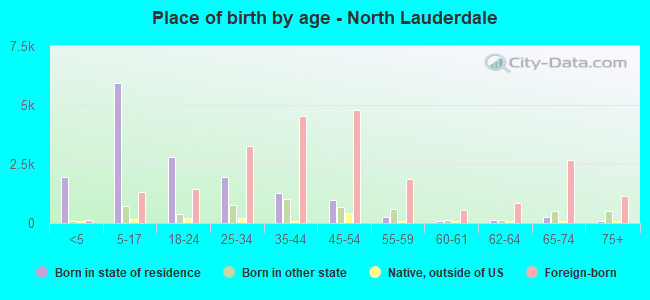
Place of birth - Born in state of residence (%)
Place of birth - Born in state of residence (%) - White
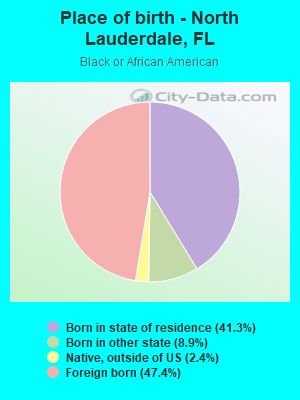
Place of birth - Born in state of residence (%) - Black or African American
Place of birth - Born in state of residence (%) - Asian
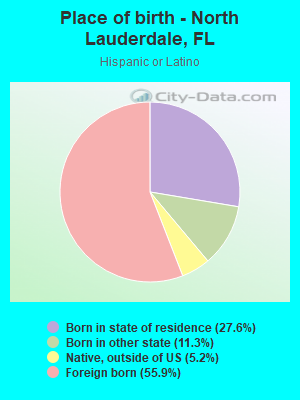
Place of birth - Born in state of residence (%) - Hispanic or Latino
Place of birth - Born in state of residence (%) - American Indian and Alaska Native
Place of birth - Born in state of residence (%) - Multirace
Place of birth - Born in state of residence (%) - Other Race
Place of birth - Born in other state (%)
Place of birth - Born in other state (%) - White
Place of birth - Born in other state (%) - Black or African American
Place of birth - Born in other state (%) - Asian
Place of birth - Born in other state (%) - Hispanic or Latino
Place of birth - Born in other state (%) - American Indian and Alaska Native
Place of birth - Born in other state (%) - Multirace
Place of birth - Born in other state (%) - Other Race
Place of birth - Native, outside of US (%)
Place of birth - Native, outside of US (%) - White
Place of birth - Native, outside of US (%) - Black or African American
Place of birth - Native, outside of US (%) - Asian
Place of birth - Native, outside of US (%) - Hispanic or Latino
Place of birth - Native, outside of US (%) - American Indian and Alaska Native
Place of birth - Native, outside of US (%) - Multirace
Place of birth - Native, outside of US (%) - Other Race
Place of birth - Foreign born (%)
Place of birth - Foreign born (%) - White
Place of birth - Foreign born (%) - Black or African American
Place of birth - Foreign born (%) - Asian
Place of birth - Foreign born (%) - Hispanic or Latino
Place of birth - Foreign born (%) - American Indian and Alaska Native
Place of birth - Foreign born (%) - Multirace
Place of birth - Foreign born (%) - Other Race
Residents speaking English at home (%)
Residents speaking English at home - Born in the United States (%)
Residents speaking English at home - Native, born elsewhere (%)
Residents speaking English at home - Foreign born (%)
Residents speaking Spanish at home (%)
Residents speaking Spanish at home - Born in the United States (%)
Residents speaking Spanish at home - Native, born elsewhere (%)
Residents speaking Spanish at home - Foreign born (%)
Residents speaking other language at home (%)
Residents speaking other language at home - Born in the United States (%)
Residents speaking other language at home - Native, born elsewhere (%)
Residents speaking other language at home - Foreign born (%)
Marital status - Never married (%)
Marital status - Now married (%)
Marital status - Separated (%)
Marital status - Widowed (%)
Marital status - Divorced (%)
Ancestries Reported - Arab (%)
Ancestries Reported - Czech (%)
Ancestries Reported - Danish (%)
Ancestries Reported - Dutch (%)
Ancestries Reported - English (%)
Ancestries Reported - French (%)
Ancestries Reported - French Canadian (%)
Ancestries Reported - German (%)
Ancestries Reported - Greek (%)
Ancestries Reported - Hungarian (%)
Ancestries Reported - Irish (%)
Ancestries Reported - Italian (%)
Ancestries Reported - Lithuanian (%)
Ancestries Reported - Norwegian (%)
Ancestries Reported - Polish (%)
Ancestries Reported - Portuguese (%)
Ancestries Reported - Russian (%)
Ancestries Reported - Scotch-Irish (%)
Ancestries Reported - Scottish (%)
Ancestries Reported - Slovak (%)
Ancestries Reported - Subsaharan African (%)
Ancestries Reported - Swedish (%)
Ancestries Reported - Swiss (%)
Ancestries Reported - Ukrainian (%)
Ancestries Reported - United States (%)
Ancestries Reported - Welsh (%)
Ancestries Reported - West Indian (%)
Ancestries Reported - Other (%)
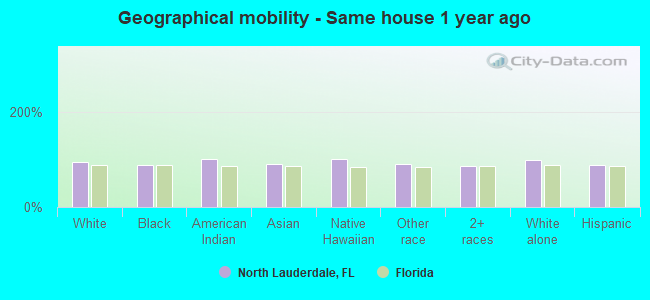
Geographical mobility - Same house 1 year ago (%)
Geographical mobility - Same house 1 year ago (%) - White
Geographical mobility - Same house 1 year ago (%) - Black or African American
Geographical mobility - Same house 1 year ago (%) - Asian
Geographical mobility - Same house 1 year ago (%) - Hispanic or Latino
Geographical mobility - Same house 1 year ago (%) - American Indian and Alaska Native
Geographical mobility - Same house 1 year ago (%) - Multirace
Geographical mobility - Same house 1 year ago (%) - Other Race
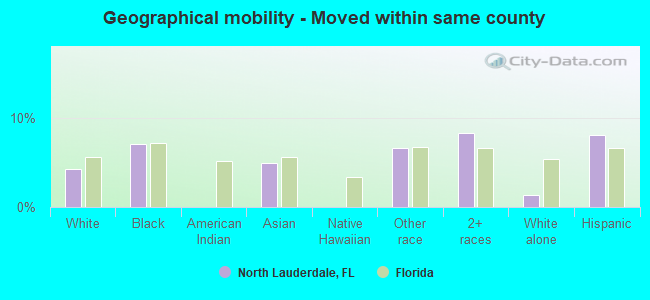
Geographical mobility - Moved within same county (%)
Geographical mobility - Moved within same county (%) - White
Geographical mobility - Moved within same county (%) - Black or African American
Geographical mobility - Moved within same county (%) - Asian
Geographical mobility - Moved within same county (%) - Hispanic or Latino
Geographical mobility - Moved within same county (%) - American Indian and Alaska Native
Geographical mobility - Moved within same county (%) - Multirace
Geographical mobility - Moved within same county (%) - Other Race
Geographical mobility - Moved from different county within same state (%)
Geographical mobility - Moved from different county within same state (%) - White
Geographical mobility - Moved from different county within same state (%) - Black or African American
Geographical mobility - Moved from different county within same state (%) - Asian
Geographical mobility - Moved from different county within same state (%) - Hispanic or Latino
Geographical mobility - Moved from different county within same state (%) - American Indian and Alaska Native
Geographical mobility - Moved from different county within same state (%) - Multirace
Geographical mobility - Moved from different county within same state (%) - Other Race
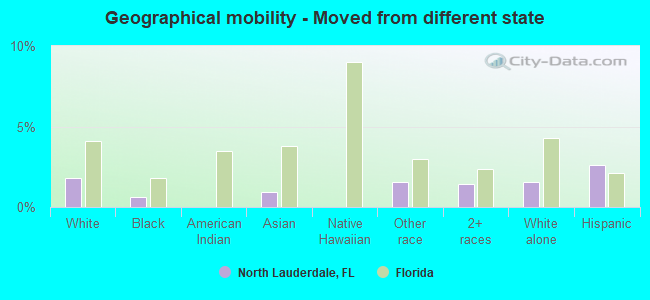
Geographical mobility - Moved from different state (%)
Geographical mobility - Moved from different state (%) - White
Geographical mobility - Moved from different state (%) - Black or African American
Geographical mobility - Moved from different state (%) - Asian
Geographical mobility - Moved from different state (%) - Hispanic or Latino
Geographical mobility - Moved from different state (%) - American Indian and Alaska Native
Geographical mobility - Moved from different state (%) - Multirace
Geographical mobility - Moved from different state (%) - Other Race
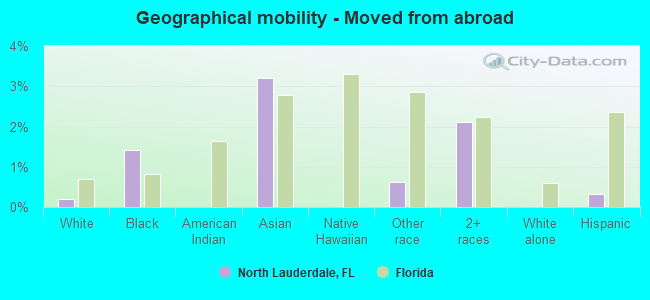
Geographical mobility - Moved from abroad (%)
Geographical mobility - Moved from abroad (%) - White
Geographical mobility - Moved from abroad (%) - Black or African American
Geographical mobility - Moved from abroad (%) - Asian
Geographical mobility - Moved from abroad (%) - Hispanic or Latino
Geographical mobility - Moved from abroad (%) - American Indian and Alaska Native
Geographical mobility - Moved from abroad (%) - Multirace
Geographical mobility - Moved from abroad (%) - Other Race
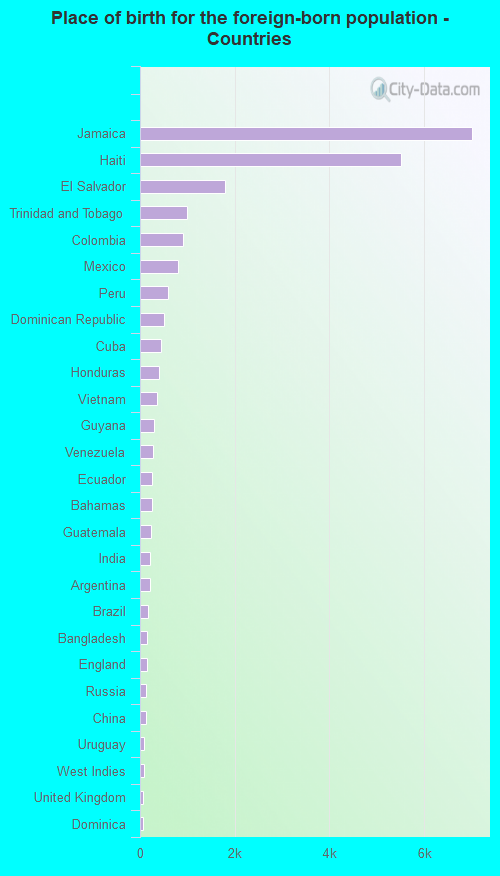
Place of birth for the foreign-born population - Ireland (%)
Place of birth for the foreign-born population - Denmark (%)
Place of birth for the foreign-born population - Norway (%)
Place of birth for the foreign-born population - Sweden (%)
Place of birth for the foreign-born population - United Kingdom (%)
Place of birth for the foreign-born population - England (%)
Place of birth for the foreign-born population - Scotland (%)
Place of birth for the foreign-born population - Other Northern Europe (%)
Place of birth for the foreign-born population - Austria (%)
Place of birth for the foreign-born population - Belgium (%)
Place of birth for the foreign-born population - France (%)
Place of birth for the foreign-born population - Germany (%)
Place of birth for the foreign-born population - Netherlands (%)
Place of birth for the foreign-born population - Switzerland (%)
Place of birth for the foreign-born population - Other Western Europe (%)
Place of birth for the foreign-born population - Greece (%)
Place of birth for the foreign-born population - Italy (%)
Place of birth for the foreign-born population - Portugal (%)
Place of birth for the foreign-born population - Spain (%)
Place of birth for the foreign-born population - Other Southern Europe (%)
Place of birth for the foreign-born population - Albania (%)
Place of birth for the foreign-born population - Belarus (%)
Place of birth for the foreign-born population - Bosnia and Herzegovina (%)
Place of birth for the foreign-born population - Bulgaria (%)
Place of birth for the foreign-born population - Croatia (%)
Place of birth for the foreign-born population - Czechoslovakia (%)
Place of birth for the foreign-born population - Hungary (%)
Place of birth for the foreign-born population - Latvia (%)
Place of birth for the foreign-born population - Lithuania (%)
Place of birth for the foreign-born population - North Macedonia (Macedonia) (%)
Place of birth for the foreign-born population - Moldova (%)
Place of birth for the foreign-born population - Poland (%)
Place of birth for the foreign-born population - Romania (%)
Place of birth for the foreign-born population - Russia (%)
Place of birth for the foreign-born population - Serbia (%)
Place of birth for the foreign-born population - Ukraine (%)
Place of birth for the foreign-born population - Other Eastern Europe (%)
Place of birth for the foreign-born population - China (%)
Place of birth for the foreign-born population - Hong Kong (%)
Place of birth for the foreign-born population - Taiwan (%)
Place of birth for the foreign-born population - Japan (%)
Place of birth for the foreign-born population - Korea (%)
Place of birth for the foreign-born population - Other Eastern Asia (%)
Place of birth for the foreign-born population - Afghanistan (%)
Place of birth for the foreign-born population - Bangladesh (%)
Place of birth for the foreign-born population - India (%)
Place of birth for the foreign-born population - Iran (%)
Place of birth for the foreign-born population - Kazakhstan (%)
Place of birth for the foreign-born population - Nepal (%)
Place of birth for the foreign-born population - Pakistan (%)
Place of birth for the foreign-born population - Sri Lanka (%)
Place of birth for the foreign-born population - Uzbekistan (%)
Place of birth for the foreign-born population - Other South Central Asia (%)
Place of birth for the foreign-born population - Burma (%)
Place of birth for the foreign-born population - Cambodia (%)
Place of birth for the foreign-born population - Indonesia (%)
Place of birth for the foreign-born population - Laos (%)
Place of birth for the foreign-born population - Malaysia (%)
Place of birth for the foreign-born population - Philippines (%)
Place of birth for the foreign-born population - Singapore (%)
Place of birth for the foreign-born population - Thailand (%)
Place of birth for the foreign-born population - Vietnam (%)
Place of birth for the foreign-born population - Other South Eastern Asia (%)
Place of birth for the foreign-born population - Armenia (%)
Place of birth for the foreign-born population - Iraq (%)
Place of birth for the foreign-born population - Israel (%)
Place of birth for the foreign-born population - Jordan (%)
Place of birth for the foreign-born population - Kuwait (%)
Place of birth for the foreign-born population - Lebanon (%)
Place of birth for the foreign-born population - Saudi Arabia (%)
Place of birth for the foreign-born population - Syria (%)
Place of birth for the foreign-born population - Turkey (%)
Place of birth for the foreign-born population - Yemen (%)
Place of birth for the foreign-born population - Other Western Asia (%)
Place of birth for the foreign-born population - Eritrea (%)
Place of birth for the foreign-born population - Ethiopia (%)
Place of birth for the foreign-born population - Kenya (%)
Place of birth for the foreign-born population - Somalia (%)
Place of birth for the foreign-born population - Uganda (%)
Place of birth for the foreign-born population - Zimbabwe (%)
Place of birth for the foreign-born population - Other Eastern Africa (%)
Place of birth for the foreign-born population - Cameroon (%)
Place of birth for the foreign-born population - Congo (%)
Place of birth for the foreign-born population - Democratic Republic of Congo (Zaire) (%)
Place of birth for the foreign-born population - Other Middle Africa (%)
Place of birth for the foreign-born population - Egypt (%)
Place of birth for the foreign-born population - Morocco (%)
Place of birth for the foreign-born population - Sudan (%)
Place of birth for the foreign-born population - Other Northern Africa (%)
Place of birth for the foreign-born population - South Africa (%)
Place of birth for the foreign-born population - Other Southern Africa (%)
Place of birth for the foreign-born population - Cabo Verde (%)
Place of birth for the foreign-born population - Ghana (%)
Place of birth for the foreign-born population - Liberia (%)
Place of birth for the foreign-born population - Nigeria (%)
Place of birth for the foreign-born population - Senegal (%)
Place of birth for the foreign-born population - Sierra Leone (%)
Place of birth for the foreign-born population - Other Western Africa (%)
Place of birth for the foreign-born population - Australia (%)
Place of birth for the foreign-born population - New Zealand (%)
Place of birth for the foreign-born population - Fiji (%)
Place of birth for the foreign-born population - Micronesia (%)
Place of birth for the foreign-born population - Bahamas (%)
Place of birth for the foreign-born population - Barbados (%)
Place of birth for the foreign-born population - Cuba (%)
Place of birth for the foreign-born population - Dominica (%)
Place of birth for the foreign-born population - Dominican Republic (%)
Place of birth for the foreign-born population - Grenada (%)
Place of birth for the foreign-born population - Haiti (%)
Place of birth for the foreign-born population - Jamaica (%)
Place of birth for the foreign-born population - St. Vincent and the Grenadines (%)
Place of birth for the foreign-born population - Trinidad and Tobago (%)
Place of birth for the foreign-born population - West Indies (%)
Place of birth for the foreign-born population - Other Caribbean (%)
Place of birth for the foreign-born population - Belize (%)
Place of birth for the foreign-born population - Costa Rica (%)
Place of birth for the foreign-born population - El Salvador (%)
Place of birth for the foreign-born population - Guatemala (%)
Place of birth for the foreign-born population - Honduras (%)
Place of birth for the foreign-born population - Mexico (%)
Place of birth for the foreign-born population - Nicaragua (%)
Place of birth for the foreign-born population - Panama (%)
Place of birth for the foreign-born population - Other Central America (%)
Place of birth for the foreign-born population - Argentina (%)
Place of birth for the foreign-born population - Bolivia (%)
Place of birth for the foreign-born population - Brazil (%)
Place of birth for the foreign-born population - Chile (%)
Place of birth for the foreign-born population - Colombia (%)
Place of birth for the foreign-born population - Ecuador (%)
Place of birth for the foreign-born population - Guyana (%)
Place of birth for the foreign-born population - Peru (%)
Place of birth for the foreign-born population - Uruguay (%)
Place of birth for the foreign-born population - Venezuela (%)
Place of birth for the foreign-born population - Other South America (%)
Place of birth for the foreign-born population - Canada (%)
Place of birth for the foreign-born population - Other Northern America (%)
Place of birth for the foreign-born population - Other (%)
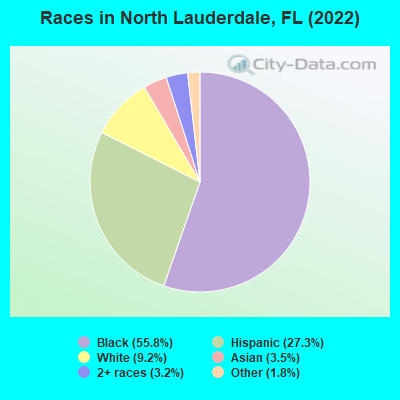
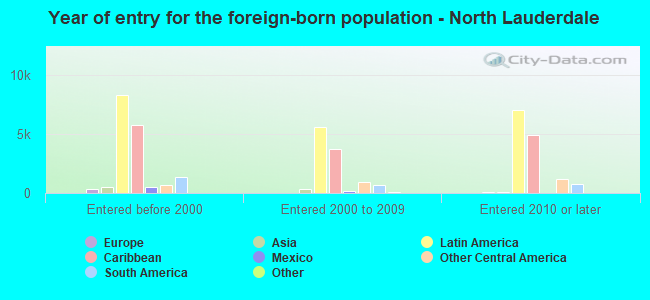
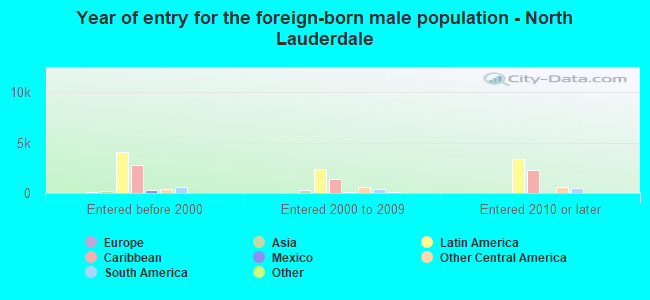
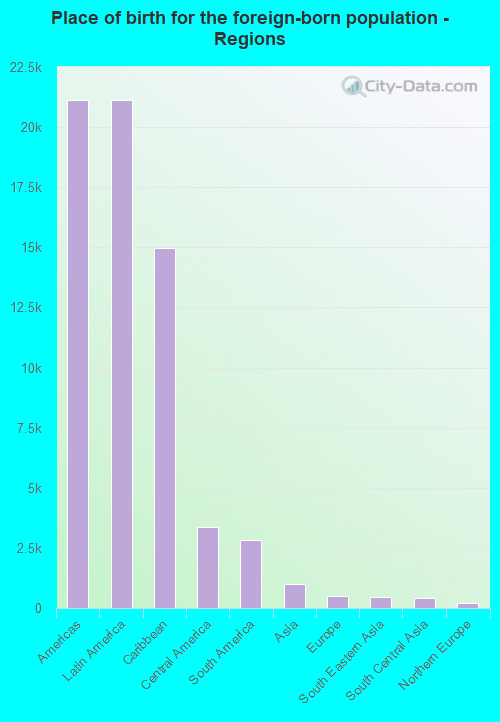
According to 2022 data, the most numerous races in North Lauderdale, FL are White alone (4,121 residents), Hispanic (12,212 residents), and Black alone (24,999 residents). 55.3% of North Lauderdale residents speak English at home. 50.6% of North Lauderdale, FL residents are foreign-born (44.5% born in Latin America), which is 58.5% greater than the foreign-born rate of 21.0% across the entire state of Florida.
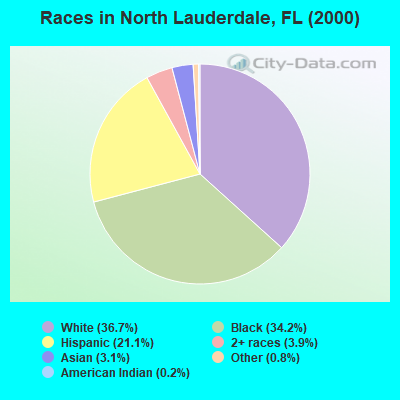
Race distribution in North Lauderdale
2000 2022
10,458,509 65.4% White alone 2,682,715 16.8% Hispanic 2,264,268 14.2% Black alone 261,693 1.6% Asian alone 236,954 1.5% Two or more races 42,358 0.3% American Indian alone 28,994 0.2% Other race alone 6,887 0.04% Native Hawaiian and Other
11,309,403 50.8% White alone 6,025,039 27.1% Hispanic 3,241,015 14.6% Black alone 861,630 3.9% Two or more races 623,692 2.8% Asian alone 152,054 0.7% Other race alone 22,504 0.1% American Indian alone 9,486 0.04% Native Hawaiian and Other
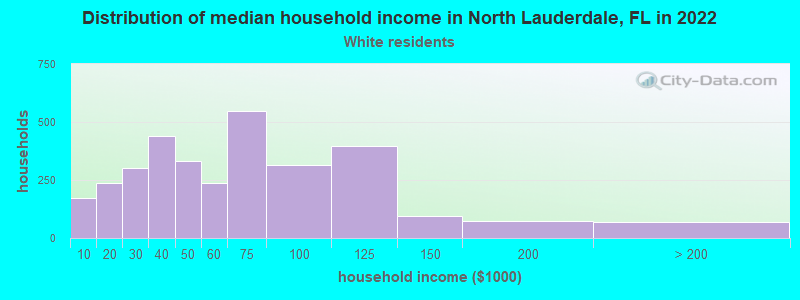
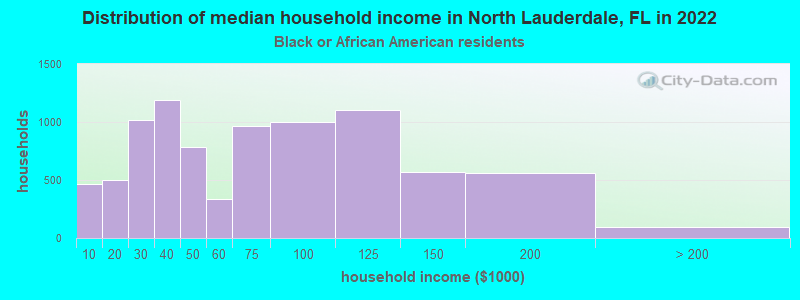
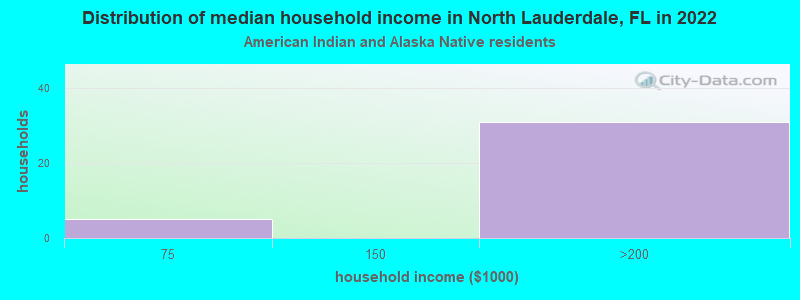
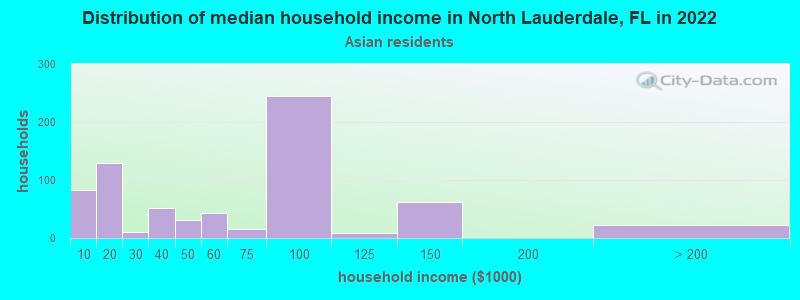
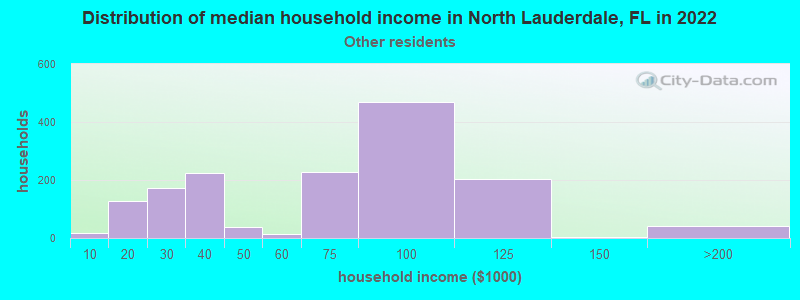
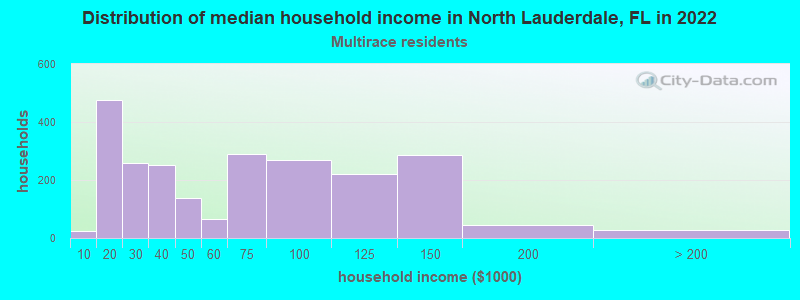
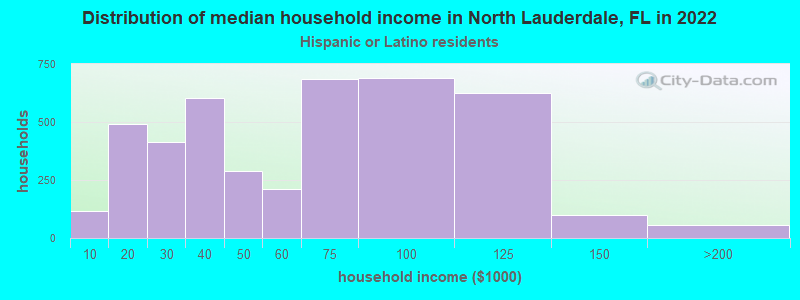
Income and house value in North Lauderdale Median household income in 2022 $53,020 White non-Hispanic householders$59,663 Black householders$51,823 Asian householders$73,697 Some other race householders$63,439 Two or more races householders$63,906 Hispanic or Latino race householdersMedian 2022 house value $285,647 White Non-Hispanic householders$280,195 Black or African American householders $289,585 Asian householders$253,841 Some other race householders$286,556 Two or more races householders$260,506 Hispanic or Latino householders
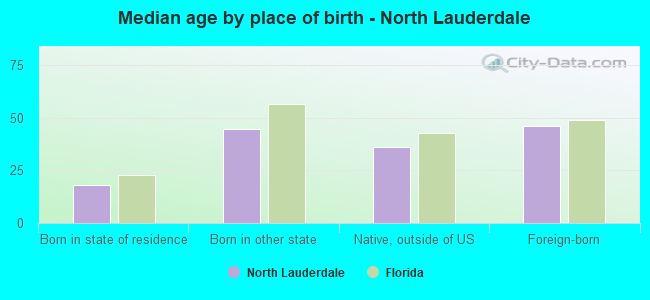
Median age by race in North Lauderdale
42.1 Median age for White residents40.5 44.1 33.1 Median age for Black or African American residents31.9 34.2 35.2 Median age for American Indian / Alaska Native residents27.4 39.3 50.9 Median age for Asian residents45.3 66.3 20.3 Median age for Native Hawaiian / Pacific Islander residents21.1 -666,666,666.0 39.9 Median age for Other race residents37.8 42.3 33.8 Median age for Two or more races residents29.8 36.3 53.6 Median age for White alone residents48.4 57.8 32.4 Median age for Hispanic or Latino residents31.6 34.0
Owner/renter occupied households by race in North Lauderdale
House owners and renters - White residents 1,996 62.2% Owner occupied1,214 37.8% Renter occupiedHouse owners and renters - Black or African American residents 4,542 54.3% Owner occupied3,817 45.7% Renter occupiedHouse owners and renters - American Indian / Alaska Native residents 25 100.0% Owner occupiedHouse owners and renters - Asian residents 457 77.1% Owner occupied136 22.9% Renter occupiedHouse owners and renters - Other race residents 1,013 64.0% Owner occupied569 36.0% Renter occupiedHouse owners and renters - Two or more races residents 1,401 58.3% Owner occupied1,001 41.7% Renter occupiedHouse owners and renters - White alone residents 1,407 73.5% Owner occupied509 26.5% Renter occupiedHouse owners and renters - Hispanic or Latino residents 2,191 50.7% Owner occupied2,129 49.3% Renter occupied
Language usage in North Lauderdale
English speakers - Total 55.3% of residents of North Lauderdale speak English at home.
24.7% of residents speak Spanish at home 5,626 53.5% Speak English very well4,883 46.5% Speak English less than very well20.2% of residents speak other language at home 4,798 55.7% Speak English very well3,812 44.3% Speak English less than very well
English speakers - Born in the United States 76.5% of residents of North Lauderdale speak English at home.
19.5% of residents speak Spanish at home 1,002 94.9% Speak English very well54 5.1% Speak English less than very well3.2% of residents speak other language at home 152 86.9% Speak English very well23 13.1% Speak English less than very well
English speakers - Native, born elsewhere 34.4% of residents of North Lauderdale speak English at home.
46.7% of residents speak Spanish at home 489 79.3% Speak English very well128 20.7% Speak English less than very well17.5% of residents speak other language at home 146 63.2% Speak English very well85 36.8% Speak English less than very well
English speakers - Foreign-born 36.4% of residents of North Lauderdale speak English at home.
30.9% of residents speak Spanish at home 2,479 35.6% Speak English very well4,478 64.4% Speak English less than very well31.4% of residents speak other language at home 3,416 48.3% Speak English very well3,655 51.7% Speak English less than very well
White (Caucasian) - Speak only English Native:
65.1% (3,338)Foreign-born:
15.8% (339)
White (Caucasian) - Speak another language Native:
29.0% (1,486)Foreign-born:
82.9% (1,778)
Black or African American - Speak only English Native:
88.3% (10,794)Foreign-born:
50.6% (6,011)
Black or African American - Speak another language Native:
11.7% (1,434)Foreign-born:
49.3% (5,863)
American Indian / Alaska Native - Speak another language Native:
73.5% (41)Foreign-born:
97.0% (75)
Asian - Speak only English Native:
33.7% (56)Foreign-born:
40.6% (621)
Asian - Speak another language Native:
69.5% (115)Foreign-born:
57.9% (886)
Other race - Speak only English Native:
37.3% (364)Foreign-born:
19.7% (491)
Other race - Speak another language Native:
62.5% (610)Foreign-born:
80.5% (2,007)
Two or more races - Speak only English Native:
55.4% (1,385)Foreign-born:
15.9% (662)
Two or more races - Speak another language Native:
44.2% (1,106)Foreign-born:
83.0% (3,468)
White alone - Speak only English Native:
88.5% (2,973)Foreign-born:
38.6% (236)
White alone - Speak another language Native:
11.5% (387)Foreign-born:
62.0% (378)
Hispanic or Latino - Speak only English Native:
31.3% (1,458)Foreign-born:
4.5% (309)
Hispanic or Latino - Speak another language Native:
68.6% (3,196)Foreign-born:
95.4% (6,499)
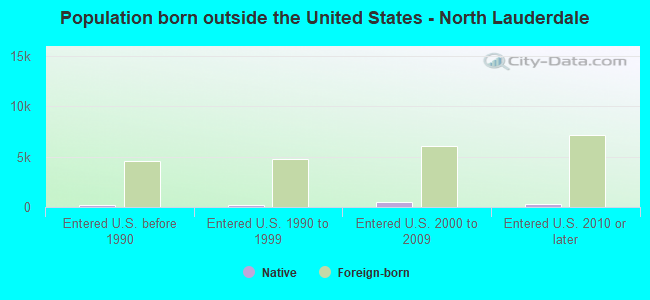
Foreign-born residents in North Lauderdale 22,665 residents are foreign born (44.5% Latin America ).
This city:
50.6%Florida:
21.1%
Marital status for residents in North Lauderdale Marital status - White (Caucasian) population 15 years and over
Males 48.7% Never married33.2% Now married2.9% Separated0.8% Widowed14.3% DivorcedFemales 31.0% Never married34.5% Now married4.9% Separated8.3% Widowed21.2% DivorcedWomen who gave birth in the past 12 months Now married:
34.8% (52)Unmarried:
65.2% (97)
Women who did not give birth in the past 12 months Now married:
30.4% (444)Unmarried:
69.6% (1,015)
Marital status - Black or African American population 15 years and over
Males 45.8% Never married43.2% Now married0.1% Separated1.4% Widowed9.6% DivorcedFemales 43.8% Never married35.0% Now married4.7% Separated1.3% Widowed15.3% DivorcedWomen who gave birth in the past 12 months Now married:
43.3% (186)Unmarried:
56.7% (243)
Women who did not give birth in the past 12 months Now married:
36.1% (2,813)Unmarried:
63.9% (4,977)
Marital status - American Indian / Alaska Native population 15 years and over
Males 57.1% Never married42.9% Now married0.0% Separated0.0% Widowed0.0% DivorcedFemales 31.7% Never married31.7% Now married0.0% Separated0.0% Widowed36.5% DivorcedWomen who did not give birth in the past 12 months Now married:
8.5% (7)Unmarried:
91.5% (70)
Marital status - Asian population 15 years and over
Males 44.0% Never married45.3% Now married0.0% Separated0.0% Widowed10.8% DivorcedFemales 7.8% Never married64.3% Now married0.0% Separated17.8% Widowed10.2% DivorcedWomen who did not give birth in the past 12 months Now married:
52.0% (105)Unmarried:
48.0% (97)
Marital status - Other race population 15 years and over
Males 42.9% Never married54.0% Now married0.0% Separated0.0% Widowed3.1% DivorcedFemales 44.2% Never married41.0% Now married0.0% Separated6.4% Widowed8.4% DivorcedWomen who did not give birth in the past 12 months Now married:
39.4% (363)Unmarried:
60.6% (559)
Marital status - Two or more races population 15 years and over
Males 38.0% Never married54.2% Now married0.0% Separated0.0% Widowed7.7% DivorcedFemales 38.3% Never married38.3% Now married6.3% Separated5.9% Widowed11.2% DivorcedWomen who gave birth in the past 12 months Now married:
38.7% (44)Unmarried:
61.3% (70)
Women who did not give birth in the past 12 months Now married:
36.9% (907)Unmarried:
63.1% (1,551)
Marital status - White alone, not Hispanic / Latino population 15 years and over
Males 43.5% Never married30.5% Now married1.5% Separated1.5% Widowed23.0% DivorcedFemales 28.7% Never married30.6% Now married2.9% Separated13.6% Widowed24.2% DivorcedWomen who gave birth in the past 12 months Now married:
100.0% (15)Unmarried:
0.0% (0)
Women who did not give birth in the past 12 months Now married:
13.6% (83)Unmarried:
86.4% (530)
Marital status - Hispanic or Latino population 15 years and over
Males 48.0% Never married44.0% Now married2.1% Separated0.1% Widowed5.7% DivorcedFemales 36.4% Never married39.2% Now married4.6% Separated5.7% Widowed14.0% DivorcedWomen who gave birth in the past 12 months Now married:
31.7% (84)Unmarried:
68.3% (181)
Women who did not give birth in the past 12 months Now married:
38.5% (1,212)Unmarried:
61.5% (1,936)
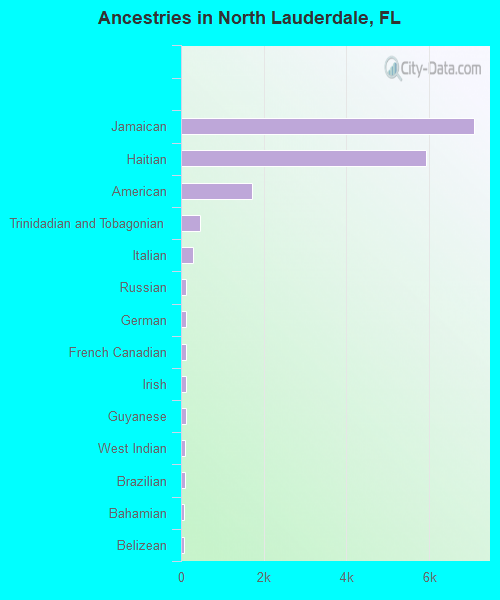
Ancestries in North Lauderdale
7,095 21.9% Jamaican5,914 18.2% Haitian1,708 5.3% American459 1.4% Trinidadian and Tobagonian279 0.9% Italian130 0.4% Russian123 0.4% German122 0.4% French Canadian121 0.4% Irish112 0.3% Guyanese100 0.3% West Indian86 0.3% Brazilian80 0.2% Bahamian71 0.2% Belizean49 0.2% Romanian48 0.1% English47 0.1% Austrian32 0.10% Barbadian31 0.10% French27 0.08% Scottish25 0.08% Polish22 0.07% African21 0.06% Portuguese19 0.06% Nigerian16 0.05% European16 0.05% Hungarian13 0.04% Czech9 0.03% Dutch5 0.02% Greek
Geographical mobility in North Lauderdale Same house 1 year ago 7,371 93.9% White (Caucasian)22,629 89.4% Black or African American166 100.0% American Indian / Alaska Native1,515 90.9% Asian25 100.0% Native Hawaiian / Pacific Islander3,187 90.4% Other race6,119 86.1% Two or more races4,030 97.7% White alone, not Hispanic / Latino10,653 88.2% Hispanic or LatinoMoved within same county 331 4.2% White / Caucasian1,795 7.1% Black or African American82 4.9% Asian234 6.6% Other race590 8.3% Two or more races56 1.4% White alone, not Hispanic / Latino979 8.1% Hispanic or LatinoMoved within same state 28 0.4% White / Caucasian398 1.6% Black or African American25 0.7% Other race140 2.0% Two or more races99 0.8% Hispanic or LatinoMoved from different state 143 1.8% White / Caucasian165 0.7% Black or African American15 0.9% Asian55 1.6% Other race101 1.4% Two or more races63 1.5% White alone, not Hispanic / Latino312 2.6% Hispanic or LatinoMoved from abroad 15 0.2% White359 1.4% Black or African American53 3.2% Asian22 0.6% Other race151 2.1% Two or more races40 0.3% Hispanic or Latino
Children Nativity (place of birth) in North Lauderdale
Children under 6 years - Living with two parents Both parents native 274 99.4% Native2 0.6% Foreign-bornBoth parents foreign-born 475 96.6% Native17 3.4% Foreign-bornOne native, one foreign-born parent 156 100.0% NativeChildren under 6 years - Living with one parent Native parent 597 99.1% Native6 0.9% Foreign-bornForeign-born parent 953 85.3% Native165 14.7% Foreign-bornChildren 6 to 17 years - Living with two parents Both parents native 488 100.0% NativeBoth parents foreign-born 1,706 80.2% Native421 19.8% Foreign-bornOne native, one foreign-born parent 561 100.0% NativeChildren 6 to 17 years - Living with one parent Native parent 1,255 100.0% NativeForeign-born parent 2,339 56.4% Native1,807 43.6% Foreign-born
Grandparents responsible for own grandchildren in North Lauderdale
Grandparents (30 to 59 years) White / Caucasian 60 100.0% Not responsible for grandchildrenBlack or African American 6 2.3% Responsible for grandchildren258 97.7% Not responsible for grandchildrenAsian 38 100.0% Not responsible for grandchildrenOther race 5 100.0% Not responsible for grandchildrenTwo or more races 46 38.7% Responsible for grandchildren72 61.3% Not responsible for grandchildrenHispanic or Latino 41 19.9% Responsible for grandchildren164 80.1% Not responsible for grandchildrenGrandparents (60 years and over) White / Caucasian 82 100.0% Not responsible for grandchildrenBlack or African American 2 0.5% Responsible for grandchildren334 99.5% Not responsible for grandchildrenAsian 6 100.0% Responsible for grandchildrenTwo or more races 28 94.6% Responsible for grandchildren2 5.4% Not responsible for grandchildrenHispanic or Latino 12 100.0% Responsible for grandchildren