Races in North Laurel, Maryland (MD) Detailed Stats
Data:
Races - White alone (%)
Races - White alone (% change since 2000)
Races - Black alone (%)
Races - Black alone (% change since 2000)
Races - American Indian alone (%)
Races - American Indian alone (% change since 2000)
Races - Asian alone (%)
Races - Asian alone (% change since 2000)
Races - Hispanic (%)
Races - Hispanic (% change since 2000)
Races - Native Hawaiian and Other Pacific Islander alone (%)
Races - Native Hawaiian and Other Pacific Islander alone (% change since 2000)
Races - Two or more races(%)
Races - Two or more races(% change since 2000)
Races - Other race alone (%)
Races - Other race alone (% change since 2000)
Racial diversity
Place of birth - Born in state of residence (%)
Place of birth - Born in state of residence (%) - White
Place of birth - Born in state of residence (%) - Black or African American
Place of birth - Born in state of residence (%) - Asian
Place of birth - Born in state of residence (%) - Hispanic or Latino
Place of birth - Born in state of residence (%) - American Indian and Alaska Native
Place of birth - Born in state of residence (%) - Multirace
Place of birth - Born in state of residence (%) - Other Race
Place of birth - Born in other state (%)
Place of birth - Born in other state (%) - White
Place of birth - Born in other state (%) - Black or African American
Place of birth - Born in other state (%) - Asian
Place of birth - Born in other state (%) - Hispanic or Latino
Place of birth - Born in other state (%) - American Indian and Alaska Native
Place of birth - Born in other state (%) - Multirace
Place of birth - Born in other state (%) - Other Race
Place of birth - Native, outside of US (%)
Place of birth - Native, outside of US (%) - White
Place of birth - Native, outside of US (%) - Black or African American
Place of birth - Native, outside of US (%) - Asian
Place of birth - Native, outside of US (%) - Hispanic or Latino
Place of birth - Native, outside of US (%) - American Indian and Alaska Native
Place of birth - Native, outside of US (%) - Multirace
Place of birth - Native, outside of US (%) - Other Race
Place of birth - Foreign born (%)
Place of birth - Foreign born (%) - White
Place of birth - Foreign born (%) - Black or African American
Place of birth - Foreign born (%) - Asian
Place of birth - Foreign born (%) - Hispanic or Latino
Place of birth - Foreign born (%) - American Indian and Alaska Native
Place of birth - Foreign born (%) - Multirace
Place of birth - Foreign born (%) - Other Race
Residents speaking English at home (%)
Residents speaking English at home - Born in the United States (%)
Residents speaking English at home - Native, born elsewhere (%)
Residents speaking English at home - Foreign born (%)
Residents speaking Spanish at home (%)
Residents speaking Spanish at home - Born in the United States (%)
Residents speaking Spanish at home - Native, born elsewhere (%)
Residents speaking Spanish at home - Foreign born (%)
Residents speaking other language at home (%)
Residents speaking other language at home - Born in the United States (%)
Residents speaking other language at home - Native, born elsewhere (%)
Residents speaking other language at home - Foreign born (%)
Marital status - Never married (%)
Marital status - Now married (%)
Marital status - Separated (%)
Marital status - Widowed (%)
Marital status - Divorced (%)
Ancestries Reported - Arab (%)
Ancestries Reported - Czech (%)
Ancestries Reported - Danish (%)
Ancestries Reported - Dutch (%)
Ancestries Reported - English (%)
Ancestries Reported - French (%)
Ancestries Reported - French Canadian (%)
Ancestries Reported - German (%)
Ancestries Reported - Greek (%)
Ancestries Reported - Hungarian (%)
Ancestries Reported - Irish (%)
Ancestries Reported - Italian (%)
Ancestries Reported - Lithuanian (%)
Ancestries Reported - Norwegian (%)
Ancestries Reported - Polish (%)
Ancestries Reported - Portuguese (%)
Ancestries Reported - Russian (%)
Ancestries Reported - Scotch-Irish (%)
Ancestries Reported - Scottish (%)
Ancestries Reported - Slovak (%)
Ancestries Reported - Subsaharan African (%)
Ancestries Reported - Swedish (%)
Ancestries Reported - Swiss (%)
Ancestries Reported - Ukrainian (%)
Ancestries Reported - United States (%)
Ancestries Reported - Welsh (%)
Ancestries Reported - West Indian (%)
Ancestries Reported - Other (%)
Geographical mobility - Same house 1 year ago (%)
Geographical mobility - Same house 1 year ago (%) - White
Geographical mobility - Same house 1 year ago (%) - Black or African American
Geographical mobility - Same house 1 year ago (%) - Asian
Geographical mobility - Same house 1 year ago (%) - Hispanic or Latino
Geographical mobility - Same house 1 year ago (%) - American Indian and Alaska Native
Geographical mobility - Same house 1 year ago (%) - Multirace
Geographical mobility - Same house 1 year ago (%) - Other Race
Geographical mobility - Moved within same county (%)
Geographical mobility - Moved within same county (%) - White
Geographical mobility - Moved within same county (%) - Black or African American
Geographical mobility - Moved within same county (%) - Asian
Geographical mobility - Moved within same county (%) - Hispanic or Latino
Geographical mobility - Moved within same county (%) - American Indian and Alaska Native
Geographical mobility - Moved within same county (%) - Multirace
Geographical mobility - Moved within same county (%) - Other Race
Geographical mobility - Moved from different county within same state (%)
Geographical mobility - Moved from different county within same state (%) - White
Geographical mobility - Moved from different county within same state (%) - Black or African American
Geographical mobility - Moved from different county within same state (%) - Asian
Geographical mobility - Moved from different county within same state (%) - Hispanic or Latino
Geographical mobility - Moved from different county within same state (%) - American Indian and Alaska Native
Geographical mobility - Moved from different county within same state (%) - Multirace
Geographical mobility - Moved from different county within same state (%) - Other Race
Geographical mobility - Moved from different state (%)
Geographical mobility - Moved from different state (%) - White
Geographical mobility - Moved from different state (%) - Black or African American
Geographical mobility - Moved from different state (%) - Asian
Geographical mobility - Moved from different state (%) - Hispanic or Latino
Geographical mobility - Moved from different state (%) - American Indian and Alaska Native
Geographical mobility - Moved from different state (%) - Multirace
Geographical mobility - Moved from different state (%) - Other Race
Geographical mobility - Moved from abroad (%)
Geographical mobility - Moved from abroad (%) - White
Geographical mobility - Moved from abroad (%) - Black or African American
Geographical mobility - Moved from abroad (%) - Asian
Geographical mobility - Moved from abroad (%) - Hispanic or Latino
Geographical mobility - Moved from abroad (%) - American Indian and Alaska Native
Geographical mobility - Moved from abroad (%) - Multirace
Geographical mobility - Moved from abroad (%) - Other Race
Place of birth for the foreign-born population - Ireland (%)
Place of birth for the foreign-born population - Denmark (%)
Place of birth for the foreign-born population - Norway (%)
Place of birth for the foreign-born population - Sweden (%)
Place of birth for the foreign-born population - United Kingdom (%)
Place of birth for the foreign-born population - England (%)
Place of birth for the foreign-born population - Scotland (%)
Place of birth for the foreign-born population - Other Northern Europe (%)
Place of birth for the foreign-born population - Austria (%)
Place of birth for the foreign-born population - Belgium (%)
Place of birth for the foreign-born population - France (%)
Place of birth for the foreign-born population - Germany (%)
Place of birth for the foreign-born population - Netherlands (%)
Place of birth for the foreign-born population - Switzerland (%)
Place of birth for the foreign-born population - Other Western Europe (%)
Place of birth for the foreign-born population - Greece (%)
Place of birth for the foreign-born population - Italy (%)
Place of birth for the foreign-born population - Portugal (%)
Place of birth for the foreign-born population - Spain (%)
Place of birth for the foreign-born population - Other Southern Europe (%)
Place of birth for the foreign-born population - Albania (%)
Place of birth for the foreign-born population - Belarus (%)
Place of birth for the foreign-born population - Bosnia and Herzegovina (%)
Place of birth for the foreign-born population - Bulgaria (%)
Place of birth for the foreign-born population - Croatia (%)
Place of birth for the foreign-born population - Czechoslovakia (%)
Place of birth for the foreign-born population - Hungary (%)
Place of birth for the foreign-born population - Latvia (%)
Place of birth for the foreign-born population - Lithuania (%)
Place of birth for the foreign-born population - North Macedonia (Macedonia) (%)
Place of birth for the foreign-born population - Moldova (%)
Place of birth for the foreign-born population - Poland (%)
Place of birth for the foreign-born population - Romania (%)
Place of birth for the foreign-born population - Russia (%)
Place of birth for the foreign-born population - Serbia (%)
Place of birth for the foreign-born population - Ukraine (%)
Place of birth for the foreign-born population - Other Eastern Europe (%)
Place of birth for the foreign-born population - China (%)
Place of birth for the foreign-born population - Hong Kong (%)
Place of birth for the foreign-born population - Taiwan (%)
Place of birth for the foreign-born population - Japan (%)
Place of birth for the foreign-born population - Korea (%)
Place of birth for the foreign-born population - Other Eastern Asia (%)
Place of birth for the foreign-born population - Afghanistan (%)
Place of birth for the foreign-born population - Bangladesh (%)
Place of birth for the foreign-born population - India (%)
Place of birth for the foreign-born population - Iran (%)
Place of birth for the foreign-born population - Kazakhstan (%)
Place of birth for the foreign-born population - Nepal (%)
Place of birth for the foreign-born population - Pakistan (%)
Place of birth for the foreign-born population - Sri Lanka (%)
Place of birth for the foreign-born population - Uzbekistan (%)
Place of birth for the foreign-born population - Other South Central Asia (%)
Place of birth for the foreign-born population - Burma (%)
Place of birth for the foreign-born population - Cambodia (%)
Place of birth for the foreign-born population - Indonesia (%)
Place of birth for the foreign-born population - Laos (%)
Place of birth for the foreign-born population - Malaysia (%)
Place of birth for the foreign-born population - Philippines (%)
Place of birth for the foreign-born population - Singapore (%)
Place of birth for the foreign-born population - Thailand (%)
Place of birth for the foreign-born population - Vietnam (%)
Place of birth for the foreign-born population - Other South Eastern Asia (%)
Place of birth for the foreign-born population - Armenia (%)
Place of birth for the foreign-born population - Iraq (%)
Place of birth for the foreign-born population - Israel (%)
Place of birth for the foreign-born population - Jordan (%)
Place of birth for the foreign-born population - Kuwait (%)
Place of birth for the foreign-born population - Lebanon (%)
Place of birth for the foreign-born population - Saudi Arabia (%)
Place of birth for the foreign-born population - Syria (%)
Place of birth for the foreign-born population - Turkey (%)
Place of birth for the foreign-born population - Yemen (%)
Place of birth for the foreign-born population - Other Western Asia (%)
Place of birth for the foreign-born population - Eritrea (%)
Place of birth for the foreign-born population - Ethiopia (%)
Place of birth for the foreign-born population - Kenya (%)
Place of birth for the foreign-born population - Somalia (%)
Place of birth for the foreign-born population - Uganda (%)
Place of birth for the foreign-born population - Zimbabwe (%)
Place of birth for the foreign-born population - Other Eastern Africa (%)
Place of birth for the foreign-born population - Cameroon (%)
Place of birth for the foreign-born population - Congo (%)
Place of birth for the foreign-born population - Democratic Republic of Congo (Zaire) (%)
Place of birth for the foreign-born population - Other Middle Africa (%)
Place of birth for the foreign-born population - Egypt (%)
Place of birth for the foreign-born population - Morocco (%)
Place of birth for the foreign-born population - Sudan (%)
Place of birth for the foreign-born population - Other Northern Africa (%)
Place of birth for the foreign-born population - South Africa (%)
Place of birth for the foreign-born population - Other Southern Africa (%)
Place of birth for the foreign-born population - Cabo Verde (%)
Place of birth for the foreign-born population - Ghana (%)
Place of birth for the foreign-born population - Liberia (%)
Place of birth for the foreign-born population - Nigeria (%)
Place of birth for the foreign-born population - Senegal (%)
Place of birth for the foreign-born population - Sierra Leone (%)
Place of birth for the foreign-born population - Other Western Africa (%)
Place of birth for the foreign-born population - Australia (%)
Place of birth for the foreign-born population - New Zealand (%)
Place of birth for the foreign-born population - Fiji (%)
Place of birth for the foreign-born population - Micronesia (%)
Place of birth for the foreign-born population - Bahamas (%)
Place of birth for the foreign-born population - Barbados (%)
Place of birth for the foreign-born population - Cuba (%)
Place of birth for the foreign-born population - Dominica (%)
Place of birth for the foreign-born population - Dominican Republic (%)
Place of birth for the foreign-born population - Grenada (%)
Place of birth for the foreign-born population - Haiti (%)
Place of birth for the foreign-born population - Jamaica (%)
Place of birth for the foreign-born population - St. Vincent and the Grenadines (%)
Place of birth for the foreign-born population - Trinidad and Tobago (%)
Place of birth for the foreign-born population - West Indies (%)
Place of birth for the foreign-born population - Other Caribbean (%)
Place of birth for the foreign-born population - Belize (%)
Place of birth for the foreign-born population - Costa Rica (%)
Place of birth for the foreign-born population - El Salvador (%)
Place of birth for the foreign-born population - Guatemala (%)
Place of birth for the foreign-born population - Honduras (%)
Place of birth for the foreign-born population - Mexico (%)
Place of birth for the foreign-born population - Nicaragua (%)
Place of birth for the foreign-born population - Panama (%)
Place of birth for the foreign-born population - Other Central America (%)
Place of birth for the foreign-born population - Argentina (%)
Place of birth for the foreign-born population - Bolivia (%)
Place of birth for the foreign-born population - Brazil (%)
Place of birth for the foreign-born population - Chile (%)
Place of birth for the foreign-born population - Colombia (%)
Place of birth for the foreign-born population - Ecuador (%)
Place of birth for the foreign-born population - Guyana (%)
Place of birth for the foreign-born population - Peru (%)
Place of birth for the foreign-born population - Uruguay (%)
Place of birth for the foreign-born population - Venezuela (%)
Place of birth for the foreign-born population - Other South America (%)
Place of birth for the foreign-born population - Canada (%)
Place of birth for the foreign-born population - Other Northern America (%)
Place of birth for the foreign-born population - Other (%)
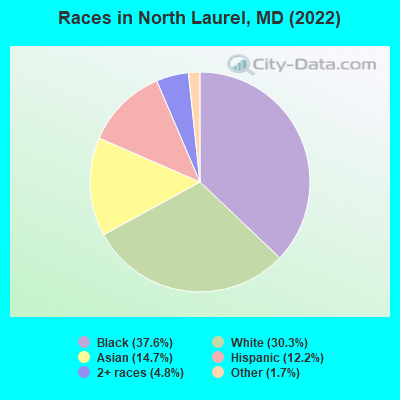
According to 2022 data, the most numerous races in North Laurel, MD are White alone (7,462 residents), Black alone (9,280 residents), and Hispanic (3,015 residents). 62.9% of North Laurel residents speak English at home. 29.8% of North Laurel, MD residents are foreign-born (10.4% born in Asia, 7.7% born in Africa, 6.4% born in Latin America, 3.4% born in Europe), which is 46.4% greater than the foreign-born rate of 16.0% across the entire state of Maryland.
Race distribution in North Laurel
2000 2022
3,286,547 62.1% White alone 1,464,735 27.7% Black alone 227,916 4.3% Hispanic 209,738 4.0% Asian alone 82,946 1.6% Two or more races 13,312 0.3% American Indian alone 9,379 0.2% Other race alone 1,913 0.04% Native Hawaiian and Other
2,906,492 47.1% White alone 1,800,914 29.2% Black alone 705,842 11.4% Hispanic 401,818 6.5% Asian alone 291,317 4.7% Two or more races 46,930 0.8% Other race alone 8,930 0.1% American Indian alone 2,417 0.04% Native Hawaiian and Other
Income and house value in North Laurel Median household income in 2022 $110,714 White non-Hispanic householders$101,430 Black householders$134,481 Asian householders$51,430 Some other race householders$62,378 Two or more races householders$50,256 Hispanic or Latino race householdersMedian 2022 house value $484,797 White Non-Hispanic householders$360,509 Black or African American householders$418,150 American Indian or Alaska Native householders $608,054 Asian householders$289,488 Some other race householders$715,616 Two or more races householders$476,562 Hispanic or Latino householders
Median age by race in North Laurel
41.9 Median age for White residents42.3 42.1 33.6 Median age for Black or African American residents32.1 35.5 54.0 Median age for American Indian / Alaska Native residents55.5 72.2 43.5 Median age for Asian residents44.5 43.1 -763,333,332.6 Median age for Native Hawaiian / Pacific Islander residents-720,061,021.4 -760,942,760.2 32.4 Median age for Other race residents31.3 33.8 26.7 Median age for Two or more races residents22.0 32.6 42.2 Median age for White alone residents42.5 42.7 33.0 Median age for Hispanic or Latino residents31.5 35.3
Owner/renter occupied households by race in North Laurel
House owners and renters - White residents 2,662 76.7% Owner occupied808 23.3% Renter occupiedHouse owners and renters - Black or African American residents 1,520 45.2% Owner occupied1,843 54.8% Renter occupiedHouse owners and renters - American Indian / Alaska Native residents 4 100.0% Owner occupiedHouse owners and renters - Asian residents 795 88.7% Owner occupied101 11.3% Renter occupiedHouse owners and renters - Other race residents 272 35.5% Owner occupied493 64.5% Renter occupiedHouse owners and renters - Two or more races residents 357 56.8% Owner occupied271 43.2% Renter occupiedHouse owners and renters - White alone residents 2,640 76.7% Owner occupied800 23.3% Renter occupiedHouse owners and renters - Hispanic or Latino residents 366 41.6% Owner occupied513 58.4% Renter occupied
Language usage in North Laurel
English speakers - Total 62.9% of residents of North Laurel speak English at home.
10.9% of residents speak Spanish at home 1,660 66.7% Speak English very well827 33.3% Speak English less than very well26.9% of residents speak other language at home 4,494 73.2% Speak English very well1,644 26.8% Speak English less than very well
English speakers - Born in the United States 85.3% of residents of North Laurel speak English at home.
6.7% of residents speak Spanish at home 430 78.6% Speak English very well117 21.4% Speak English less than very well8.3% of residents speak other language at home 517 76.4% Speak English very well160 23.6% Speak English less than very well
English speakers - Native, born elsewhere 41.7% of residents of North Laurel speak English at home.
29.4% of residents speak Spanish at home 94 85.5% Speak English very well16 14.5% Speak English less than very well23.3% of residents speak other language at home 87 100.0% Speak English very well
English speakers - Foreign-born 19.8% of residents of North Laurel speak English at home.
14.9% of residents speak Spanish at home 418 38.3% Speak English very well673 61.7% Speak English less than very well65.0% of residents speak other language at home 3,406 71.7% Speak English very well1,347 28.3% Speak English less than very well
White (Caucasian) - Speak only English Native:
92.4% (5,664)Foreign-born:
10.6% (124)
White (Caucasian) - Speak another language Native:
7.7% (472)Foreign-born:
87.5% (1,020)
Black or African American - Speak only English Native:
91.8% (5,664)Foreign-born:
26.3% (625)
Black or African American - Speak another language Native:
7.7% (478)Foreign-born:
75.8% (1,804)
Asian - Speak only English Native:
55.5% (616)Foreign-born:
18.6% (431)
Asian - Speak another language Native:
44.1% (489)Foreign-born:
82.2% (1,903)
Other race - Speak only English Native:
10.7% (110)Foreign-born:
3.6% (49)
Other race - Speak another language Native:
100.0% (1,027)Foreign-born:
97.7% (1,346)
Two or more races - Speak only English Native:
66.7% (926)Foreign-born:
60.1% (243)
Two or more races - Speak another language Native:
34.5% (479)Foreign-born:
54.4% (220)
White alone - Speak only English Native:
94.5% (5,565)Foreign-born:
10.3% (128)
White alone - Speak another language Native:
6.0% (355)Foreign-born:
93.1% (1,164)
Hispanic or Latino - Speak only English Native:
19.3% (309)Foreign-born:
18.5% (212)
Hispanic or Latino - Speak another language Native:
94.2% (1,510)Foreign-born:
82.8% (951)
Foreign-born residents in North Laurel 7,359 residents are foreign born (10.4% Asia , 7.7% Africa , 6.4% Latin America , 3.4% Europe ).
This city:
29.8%Maryland:
15.7%
Marital status for residents in North Laurel Marital status - White (Caucasian) population 15 years and over
Males 36.4% Never married57.1% Now married0.9% Separated0.9% Widowed4.7% DivorcedFemales 24.5% Never married59.3% Now married0.0% Separated6.3% Widowed9.9% DivorcedWomen who gave birth in the past 12 months Now married:
62.2% (26)Unmarried:
37.8% (16)
Women who did not give birth in the past 12 months Now married:
60.4% (1,003)Unmarried:
39.6% (657)
Marital status - Black or African American population 15 years and over
Males 40.1% Never married56.1% Now married0.0% Separated0.0% Widowed3.8% DivorcedFemales 43.5% Never married35.2% Now married1.5% Separated2.2% Widowed17.6% DivorcedWomen who gave birth in the past 12 months Now married:
99.2% (135)Unmarried:
0.8% (1)
Women who did not give birth in the past 12 months Now married:
35.4% (894)Unmarried:
64.6% (1,629)
Marital status - American Indian / Alaska Native population 15 years and over
Males 0.0% Never married82.4% Now married17.6% Separated0.0% Widowed0.0% DivorcedFemales 0.0% Never married0.0% Now married62.5% Separated37.5% Widowed0.0% DivorcedWomen who did not give birth in the past 12 months Now married:
100.0% (3)Unmarried:
0.0% (0)
Marital status - Asian population 15 years and over
Males 25.2% Never married71.4% Now married0.0% Separated0.9% Widowed2.6% DivorcedFemales 23.4% Never married67.8% Now married1.5% Separated5.0% Widowed2.3% DivorcedWomen who gave birth in the past 12 months Now married:
100.0% (38)Unmarried:
0.0% (0)
Women who did not give birth in the past 12 months Now married:
61.6% (707)Unmarried:
38.4% (440)
Marital status - Other race population 15 years and over
Males 47.1% Never married47.9% Now married0.0% Separated2.9% Widowed2.1% DivorcedFemales 43.4% Never married28.2% Now married8.3% Separated7.0% Widowed13.1% DivorcedWomen who gave birth in the past 12 months Now married:
69.0% (31)Unmarried:
31.0% (14)
Women who did not give birth in the past 12 months Now married:
28.4% (218)Unmarried:
71.6% (548)
Marital status - Two or more races population 15 years and over
Males 50.1% Never married49.9% Now married0.0% Separated0.0% Widowed0.0% DivorcedFemales 20.6% Never married59.3% Now married5.1% Separated6.5% Widowed8.6% DivorcedWomen who gave birth in the past 12 months Now married:
100.0% (39)Unmarried:
0.0% (0)
Women who did not give birth in the past 12 months Now married:
55.0% (273)Unmarried:
45.0% (224)
Marital status - White alone, not Hispanic / Latino population 15 years and over
Males 34.1% Never married60.7% Now married0.0% Separated1.0% Widowed4.2% DivorcedFemales 22.8% Never married60.3% Now married0.0% Separated6.5% Widowed10.3% DivorcedWomen who gave birth in the past 12 months Now married:
62.2% (27)Unmarried:
37.8% (17)
Women who did not give birth in the past 12 months Now married:
62.9% (1,025)Unmarried:
37.1% (606)
Marital status - Hispanic or Latino population 15 years and over
Males 46.4% Never married44.2% Now married3.5% Separated1.4% Widowed4.4% DivorcedFemales 34.7% Never married44.0% Now married7.7% Separated4.5% Widowed9.1% DivorcedWomen who gave birth in the past 12 months Now married:
69.0% (22)Unmarried:
31.0% (10)
Women who did not give birth in the past 12 months Now married:
41.9% (405)Unmarried:
58.1% (562)
Ancestries in North Laurel
987 6.3% Nigerian932 5.9% African555 3.5% American460 2.9% Russian397 2.5% Ethiopian395 2.5% German387 2.5% Irish327 2.1% Brazilian287 1.8% English270 1.7% Italian247 1.6% Jamaican243 1.5% Swedish143 0.9% Ghanaian140 0.9% European138 0.9% Iranian136 0.9% Sierra Leonean64 0.4% Egyptian62 0.4% Romanian56 0.4% Palestinian56 0.4% Eastern European56 0.4% Haitian53 0.3% Jordanian53 0.3% Scottish51 0.3% Scandinavian48 0.3% French Canadian45 0.3% Polish42 0.3% Sudanese35 0.2% Australian33 0.2% French31 0.2% Lithuanian30 0.2% Norwegian27 0.2% Guyanese27 0.2% South African26 0.2% Northern European25 0.2% Syrian22 0.1% West Indian21 0.1% Hungarian18 0.1% Czech13 0.08% Slovak11 0.07% Austrian10 0.06% Liberian9 0.06% British8 0.05% Afghan6 0.04% Lebanese
Geographical mobility in North Laurel Same house 1 year ago 6,992 90.6% White (Caucasian)7,586 83.4% Black or African American44 98.9% American Indian / Alaska Native3,347 92.2% Asian2,859 100.0% Other race1,720 86.8% Two or more races6,730 90.5% White alone, not Hispanic / Latino2,949 98.6% Hispanic or LatinoMoved within same county 81 1.0% White / Caucasian221 2.4% Black or African American64 1.8% Asian60 0.8% White alone, not Hispanic / Latino19 0.7% Hispanic or LatinoMoved within same state 87 1.1% White / Caucasian1,160 12.8% Black or African American60 1.6% Asian64 2.3% Other race105 5.3% Two or more races87 1.2% White alone, not Hispanic / Latino116 3.9% Hispanic or LatinoMoved from different state 322 4.2% White / Caucasian62 0.7% Black or African American102 2.8% Asian15 0.6% Other race161 8.1% Two or more races337 4.5% White alone, not Hispanic / Latino36 1.2% Hispanic or LatinoMoved from abroad 305 4.0% White180 2.0% Black or African American46 1.3% Asian321 4.3% White alone, not Hispanic / Latino
Children Nativity (place of birth) in North Laurel
Children under 6 years - Living with two parents Both parents native 558 100.0% NativeBoth parents foreign-born 584 98.9% Native6 1.1% Foreign-bornOne native, one foreign-born parent 669 100.0% NativeChildren under 6 years - Living with one parent Native parent 192 100.0% NativeForeign-born parent 20 100.0% NativeChildren 6 to 17 years - Living with two parents Both parents native 879 100.0% NativeBoth parents foreign-born 699 82.1% Native153 17.9% Foreign-bornOne native, one foreign-born parent 693 97.3% Native19 2.7% Foreign-bornChildren 6 to 17 years - Living with one parent Foreign-born parent 1,127 61.5% Native706 38.5% Foreign-born
Grandparents responsible for own grandchildren in North Laurel
Grandparents (30 to 59 years) Black or African American 26 71.4% Responsible for grandchildren10 28.6% Not responsible for grandchildrenAsian 10 100.0% Not responsible for grandchildrenGrandparents (60 years and over) Black or African American 166 100.0% Not responsible for grandchildrenAsian 20 13.5% Responsible for grandchildren127 86.5% Not responsible for grandchildren