Races in North Logan, Utah (UT) Detailed Stats
Data:
Races - White alone (%)
Races - White alone (% change since 2000)
Races - Black alone (%)
Races - Black alone (% change since 2000)
Races - American Indian alone (%)
Races - American Indian alone (% change since 2000)
Races - Asian alone (%)
Races - Asian alone (% change since 2000)
Races - Hispanic (%)
Races - Hispanic (% change since 2000)
Races - Native Hawaiian and Other Pacific Islander alone (%)
Races - Native Hawaiian and Other Pacific Islander alone (% change since 2000)
Races - Two or more races(%)
Races - Two or more races(% change since 2000)
Races - Other race alone (%)
Races - Other race alone (% change since 2000)
Racial diversity
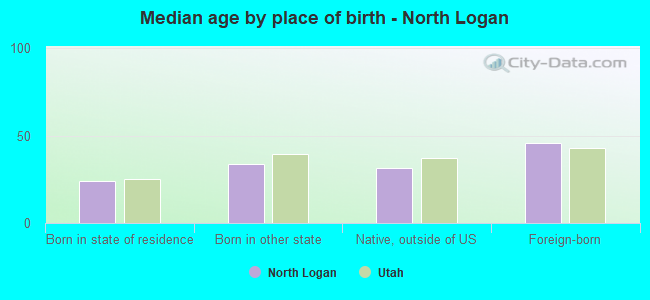
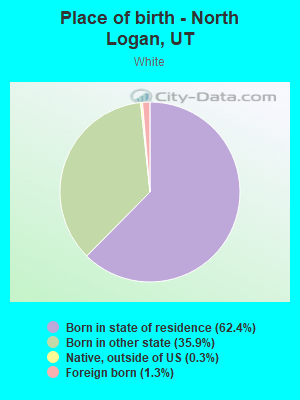
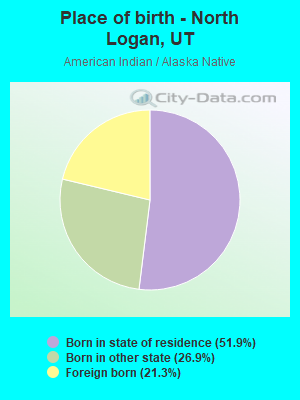
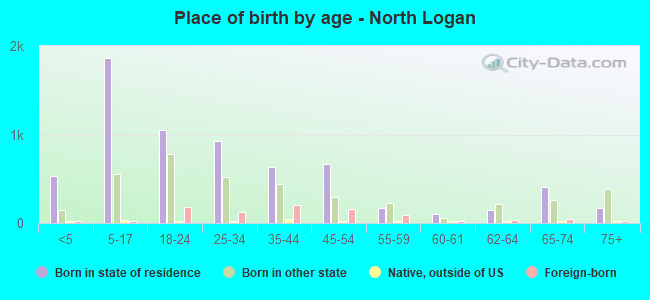
Place of birth - Born in state of residence (%)
Place of birth - Born in state of residence (%) - White
Place of birth - Born in state of residence (%) - Black or African American
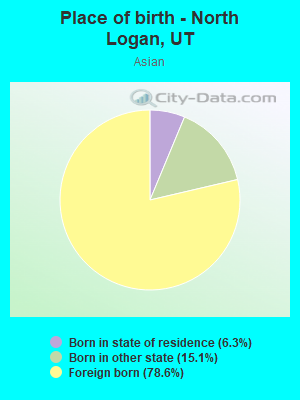
Place of birth - Born in state of residence (%) - Asian
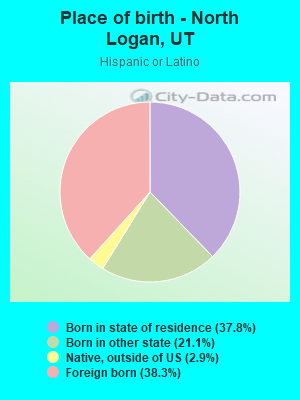
Place of birth - Born in state of residence (%) - Hispanic or Latino
Place of birth - Born in state of residence (%) - American Indian and Alaska Native
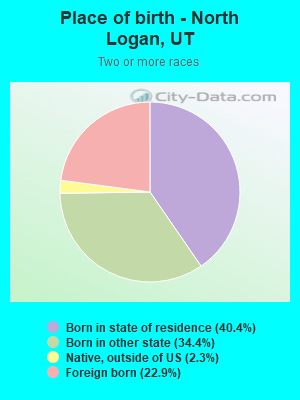
Place of birth - Born in state of residence (%) - Multirace
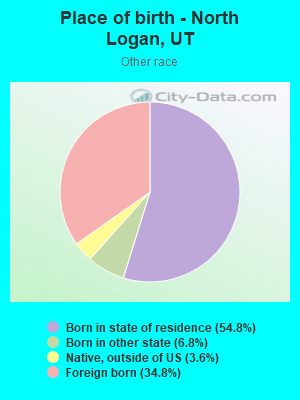
Place of birth - Born in state of residence (%) - Other Race
Place of birth - Born in other state (%)
Place of birth - Born in other state (%) - White
Place of birth - Born in other state (%) - Black or African American
Place of birth - Born in other state (%) - Asian
Place of birth - Born in other state (%) - Hispanic or Latino
Place of birth - Born in other state (%) - American Indian and Alaska Native
Place of birth - Born in other state (%) - Multirace
Place of birth - Born in other state (%) - Other Race
Place of birth - Native, outside of US (%)
Place of birth - Native, outside of US (%) - White
Place of birth - Native, outside of US (%) - Black or African American
Place of birth - Native, outside of US (%) - Asian
Place of birth - Native, outside of US (%) - Hispanic or Latino
Place of birth - Native, outside of US (%) - American Indian and Alaska Native
Place of birth - Native, outside of US (%) - Multirace
Place of birth - Native, outside of US (%) - Other Race
Place of birth - Foreign born (%)
Place of birth - Foreign born (%) - White
Place of birth - Foreign born (%) - Black or African American
Place of birth - Foreign born (%) - Asian
Place of birth - Foreign born (%) - Hispanic or Latino
Place of birth - Foreign born (%) - American Indian and Alaska Native
Place of birth - Foreign born (%) - Multirace
Place of birth - Foreign born (%) - Other Race
Residents speaking English at home (%)
Residents speaking English at home - Born in the United States (%)
Residents speaking English at home - Native, born elsewhere (%)
Residents speaking English at home - Foreign born (%)
Residents speaking Spanish at home (%)
Residents speaking Spanish at home - Born in the United States (%)
Residents speaking Spanish at home - Native, born elsewhere (%)
Residents speaking Spanish at home - Foreign born (%)
Residents speaking other language at home (%)
Residents speaking other language at home - Born in the United States (%)
Residents speaking other language at home - Native, born elsewhere (%)
Residents speaking other language at home - Foreign born (%)
Marital status - Never married (%)
Marital status - Now married (%)
Marital status - Separated (%)
Marital status - Widowed (%)
Marital status - Divorced (%)
Ancestries Reported - Arab (%)
Ancestries Reported - Czech (%)
Ancestries Reported - Danish (%)
Ancestries Reported - Dutch (%)
Ancestries Reported - English (%)
Ancestries Reported - French (%)
Ancestries Reported - French Canadian (%)
Ancestries Reported - German (%)
Ancestries Reported - Greek (%)
Ancestries Reported - Hungarian (%)
Ancestries Reported - Irish (%)
Ancestries Reported - Italian (%)
Ancestries Reported - Lithuanian (%)
Ancestries Reported - Norwegian (%)
Ancestries Reported - Polish (%)
Ancestries Reported - Portuguese (%)
Ancestries Reported - Russian (%)
Ancestries Reported - Scotch-Irish (%)
Ancestries Reported - Scottish (%)
Ancestries Reported - Slovak (%)
Ancestries Reported - Subsaharan African (%)
Ancestries Reported - Swedish (%)
Ancestries Reported - Swiss (%)
Ancestries Reported - Ukrainian (%)
Ancestries Reported - United States (%)
Ancestries Reported - Welsh (%)
Ancestries Reported - West Indian (%)
Ancestries Reported - Other (%)
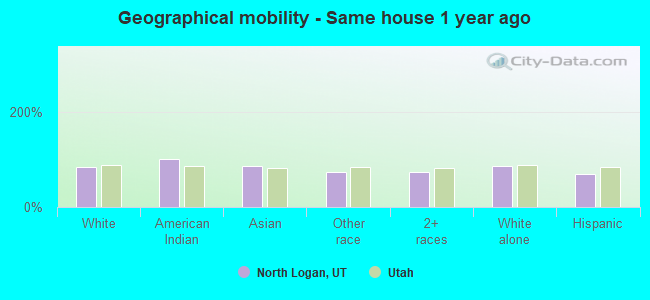
Geographical mobility - Same house 1 year ago (%)
Geographical mobility - Same house 1 year ago (%) - White
Geographical mobility - Same house 1 year ago (%) - Black or African American
Geographical mobility - Same house 1 year ago (%) - Asian
Geographical mobility - Same house 1 year ago (%) - Hispanic or Latino
Geographical mobility - Same house 1 year ago (%) - American Indian and Alaska Native
Geographical mobility - Same house 1 year ago (%) - Multirace
Geographical mobility - Same house 1 year ago (%) - Other Race
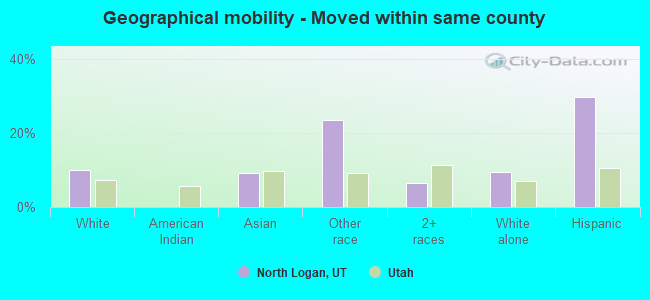
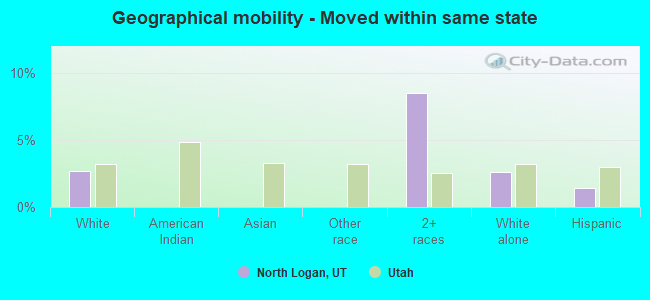
Geographical mobility - Moved within same county (%)
Geographical mobility - Moved within same county (%) - White
Geographical mobility - Moved within same county (%) - Black or African American
Geographical mobility - Moved within same county (%) - Asian
Geographical mobility - Moved within same county (%) - Hispanic or Latino
Geographical mobility - Moved within same county (%) - American Indian and Alaska Native
Geographical mobility - Moved within same county (%) - Multirace
Geographical mobility - Moved within same county (%) - Other Race
Geographical mobility - Moved from different county within same state (%)
Geographical mobility - Moved from different county within same state (%) - White
Geographical mobility - Moved from different county within same state (%) - Black or African American
Geographical mobility - Moved from different county within same state (%) - Asian
Geographical mobility - Moved from different county within same state (%) - Hispanic or Latino
Geographical mobility - Moved from different county within same state (%) - American Indian and Alaska Native
Geographical mobility - Moved from different county within same state (%) - Multirace
Geographical mobility - Moved from different county within same state (%) - Other Race
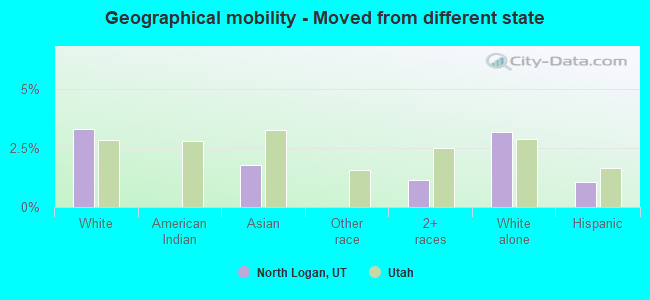
Geographical mobility - Moved from different state (%)
Geographical mobility - Moved from different state (%) - White
Geographical mobility - Moved from different state (%) - Black or African American
Geographical mobility - Moved from different state (%) - Asian
Geographical mobility - Moved from different state (%) - Hispanic or Latino
Geographical mobility - Moved from different state (%) - American Indian and Alaska Native
Geographical mobility - Moved from different state (%) - Multirace
Geographical mobility - Moved from different state (%) - Other Race
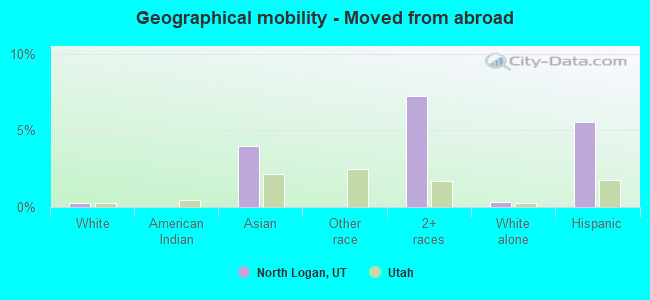
Geographical mobility - Moved from abroad (%)
Geographical mobility - Moved from abroad (%) - White
Geographical mobility - Moved from abroad (%) - Black or African American
Geographical mobility - Moved from abroad (%) - Asian
Geographical mobility - Moved from abroad (%) - Hispanic or Latino
Geographical mobility - Moved from abroad (%) - American Indian and Alaska Native
Geographical mobility - Moved from abroad (%) - Multirace
Geographical mobility - Moved from abroad (%) - Other Race
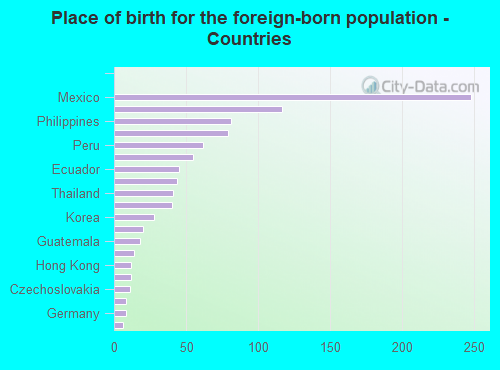
Place of birth for the foreign-born population - Ireland (%)
Place of birth for the foreign-born population - Denmark (%)
Place of birth for the foreign-born population - Norway (%)
Place of birth for the foreign-born population - Sweden (%)
Place of birth for the foreign-born population - United Kingdom (%)
Place of birth for the foreign-born population - England (%)
Place of birth for the foreign-born population - Scotland (%)
Place of birth for the foreign-born population - Other Northern Europe (%)
Place of birth for the foreign-born population - Austria (%)
Place of birth for the foreign-born population - Belgium (%)
Place of birth for the foreign-born population - France (%)
Place of birth for the foreign-born population - Germany (%)
Place of birth for the foreign-born population - Netherlands (%)
Place of birth for the foreign-born population - Switzerland (%)
Place of birth for the foreign-born population - Other Western Europe (%)
Place of birth for the foreign-born population - Greece (%)
Place of birth for the foreign-born population - Italy (%)
Place of birth for the foreign-born population - Portugal (%)
Place of birth for the foreign-born population - Spain (%)
Place of birth for the foreign-born population - Other Southern Europe (%)
Place of birth for the foreign-born population - Albania (%)
Place of birth for the foreign-born population - Belarus (%)
Place of birth for the foreign-born population - Bosnia and Herzegovina (%)
Place of birth for the foreign-born population - Bulgaria (%)
Place of birth for the foreign-born population - Croatia (%)
Place of birth for the foreign-born population - Czechoslovakia (%)
Place of birth for the foreign-born population - Hungary (%)
Place of birth for the foreign-born population - Latvia (%)
Place of birth for the foreign-born population - Lithuania (%)
Place of birth for the foreign-born population - North Macedonia (Macedonia) (%)
Place of birth for the foreign-born population - Moldova (%)
Place of birth for the foreign-born population - Poland (%)
Place of birth for the foreign-born population - Romania (%)
Place of birth for the foreign-born population - Russia (%)
Place of birth for the foreign-born population - Serbia (%)
Place of birth for the foreign-born population - Ukraine (%)
Place of birth for the foreign-born population - Other Eastern Europe (%)
Place of birth for the foreign-born population - China (%)
Place of birth for the foreign-born population - Hong Kong (%)
Place of birth for the foreign-born population - Taiwan (%)
Place of birth for the foreign-born population - Japan (%)
Place of birth for the foreign-born population - Korea (%)
Place of birth for the foreign-born population - Other Eastern Asia (%)
Place of birth for the foreign-born population - Afghanistan (%)
Place of birth for the foreign-born population - Bangladesh (%)
Place of birth for the foreign-born population - India (%)
Place of birth for the foreign-born population - Iran (%)
Place of birth for the foreign-born population - Kazakhstan (%)
Place of birth for the foreign-born population - Nepal (%)
Place of birth for the foreign-born population - Pakistan (%)
Place of birth for the foreign-born population - Sri Lanka (%)
Place of birth for the foreign-born population - Uzbekistan (%)
Place of birth for the foreign-born population - Other South Central Asia (%)
Place of birth for the foreign-born population - Burma (%)
Place of birth for the foreign-born population - Cambodia (%)
Place of birth for the foreign-born population - Indonesia (%)
Place of birth for the foreign-born population - Laos (%)
Place of birth for the foreign-born population - Malaysia (%)
Place of birth for the foreign-born population - Philippines (%)
Place of birth for the foreign-born population - Singapore (%)
Place of birth for the foreign-born population - Thailand (%)
Place of birth for the foreign-born population - Vietnam (%)
Place of birth for the foreign-born population - Other South Eastern Asia (%)
Place of birth for the foreign-born population - Armenia (%)
Place of birth for the foreign-born population - Iraq (%)
Place of birth for the foreign-born population - Israel (%)
Place of birth for the foreign-born population - Jordan (%)
Place of birth for the foreign-born population - Kuwait (%)
Place of birth for the foreign-born population - Lebanon (%)
Place of birth for the foreign-born population - Saudi Arabia (%)
Place of birth for the foreign-born population - Syria (%)
Place of birth for the foreign-born population - Turkey (%)
Place of birth for the foreign-born population - Yemen (%)
Place of birth for the foreign-born population - Other Western Asia (%)
Place of birth for the foreign-born population - Eritrea (%)
Place of birth for the foreign-born population - Ethiopia (%)
Place of birth for the foreign-born population - Kenya (%)
Place of birth for the foreign-born population - Somalia (%)
Place of birth for the foreign-born population - Uganda (%)
Place of birth for the foreign-born population - Zimbabwe (%)
Place of birth for the foreign-born population - Other Eastern Africa (%)
Place of birth for the foreign-born population - Cameroon (%)
Place of birth for the foreign-born population - Congo (%)
Place of birth for the foreign-born population - Democratic Republic of Congo (Zaire) (%)
Place of birth for the foreign-born population - Other Middle Africa (%)
Place of birth for the foreign-born population - Egypt (%)
Place of birth for the foreign-born population - Morocco (%)
Place of birth for the foreign-born population - Sudan (%)
Place of birth for the foreign-born population - Other Northern Africa (%)
Place of birth for the foreign-born population - South Africa (%)
Place of birth for the foreign-born population - Other Southern Africa (%)
Place of birth for the foreign-born population - Cabo Verde (%)
Place of birth for the foreign-born population - Ghana (%)
Place of birth for the foreign-born population - Liberia (%)
Place of birth for the foreign-born population - Nigeria (%)
Place of birth for the foreign-born population - Senegal (%)
Place of birth for the foreign-born population - Sierra Leone (%)
Place of birth for the foreign-born population - Other Western Africa (%)
Place of birth for the foreign-born population - Australia (%)
Place of birth for the foreign-born population - New Zealand (%)
Place of birth for the foreign-born population - Fiji (%)
Place of birth for the foreign-born population - Micronesia (%)
Place of birth for the foreign-born population - Bahamas (%)
Place of birth for the foreign-born population - Barbados (%)
Place of birth for the foreign-born population - Cuba (%)
Place of birth for the foreign-born population - Dominica (%)
Place of birth for the foreign-born population - Dominican Republic (%)
Place of birth for the foreign-born population - Grenada (%)
Place of birth for the foreign-born population - Haiti (%)
Place of birth for the foreign-born population - Jamaica (%)
Place of birth for the foreign-born population - St. Vincent and the Grenadines (%)
Place of birth for the foreign-born population - Trinidad and Tobago (%)
Place of birth for the foreign-born population - West Indies (%)
Place of birth for the foreign-born population - Other Caribbean (%)
Place of birth for the foreign-born population - Belize (%)
Place of birth for the foreign-born population - Costa Rica (%)
Place of birth for the foreign-born population - El Salvador (%)
Place of birth for the foreign-born population - Guatemala (%)
Place of birth for the foreign-born population - Honduras (%)
Place of birth for the foreign-born population - Mexico (%)
Place of birth for the foreign-born population - Nicaragua (%)
Place of birth for the foreign-born population - Panama (%)
Place of birth for the foreign-born population - Other Central America (%)
Place of birth for the foreign-born population - Argentina (%)
Place of birth for the foreign-born population - Bolivia (%)
Place of birth for the foreign-born population - Brazil (%)
Place of birth for the foreign-born population - Chile (%)
Place of birth for the foreign-born population - Colombia (%)
Place of birth for the foreign-born population - Ecuador (%)
Place of birth for the foreign-born population - Guyana (%)
Place of birth for the foreign-born population - Peru (%)
Place of birth for the foreign-born population - Uruguay (%)
Place of birth for the foreign-born population - Venezuela (%)
Place of birth for the foreign-born population - Other South America (%)
Place of birth for the foreign-born population - Canada (%)
Place of birth for the foreign-born population - Other Northern America (%)
Place of birth for the foreign-born population - Other (%)
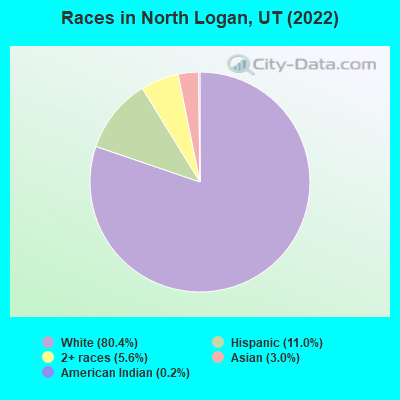
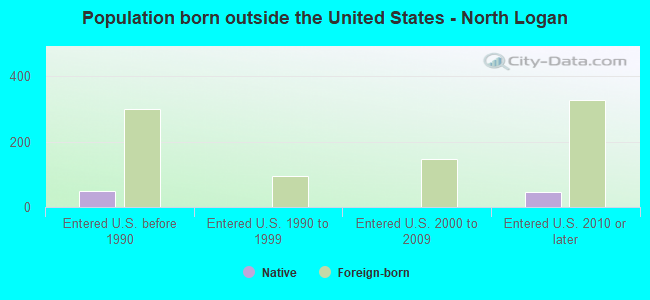
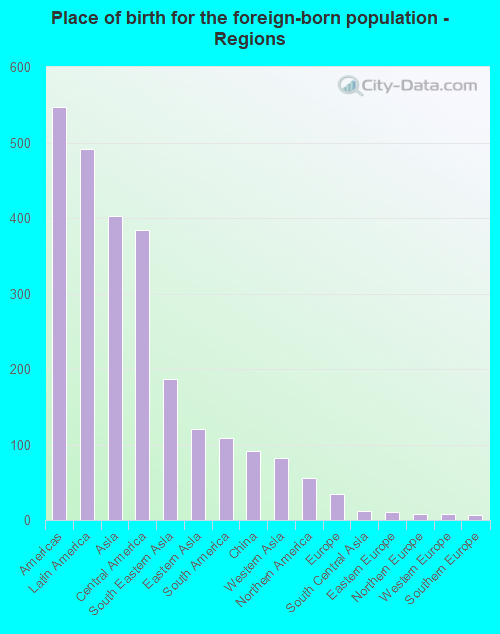
According to 2022 data, the most numerous races in North Logan, UT are White alone (9,203 residents), Hispanic (1,263 residents), and Two or more races (639 residents). 89.9% of North Logan residents speak English at home. 8.6% of North Logan, UT residents are foreign-born (4.2% born in Latin America, 3.5% born in Asia), which is 7.0% greater than the foreign-born rate of 8.0% across the entire state of Utah.
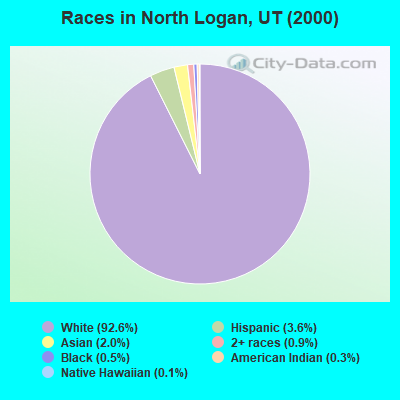
Race distribution in North Logan
2000 2022
1,904,265 85.3% White alone 201,559 9.0% Hispanic 36,483 1.6% Asian alone 31,308 1.4% Two or more races 26,663 1.2% American Indian alone 14,806 0.7% Native Hawaiian and Other 16,137 0.7% Black alone 1,948 0.09% Other race alone
2,557,466 75.6% White alone 512,086 15.1% Hispanic 119,308 3.5% Two or more races 82,388 2.4% Asian alone 36,978 1.1% Native Hawaiian and Other 34,873 1.0% Black alone 22,803 0.7% American Indian alone 14,898 0.4% Other race alone
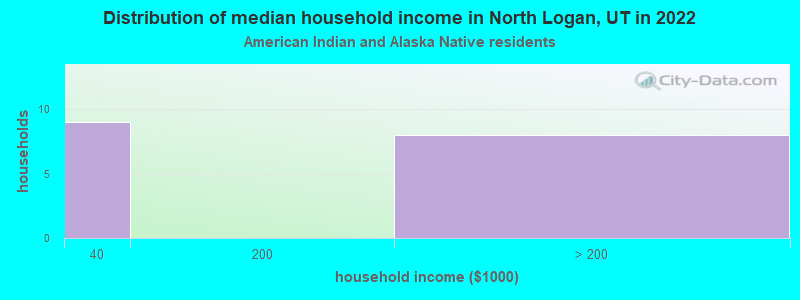
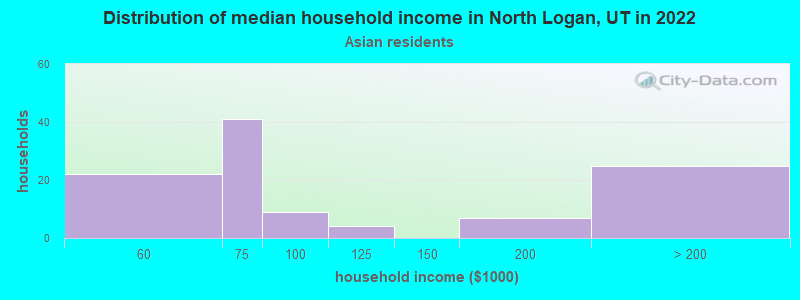
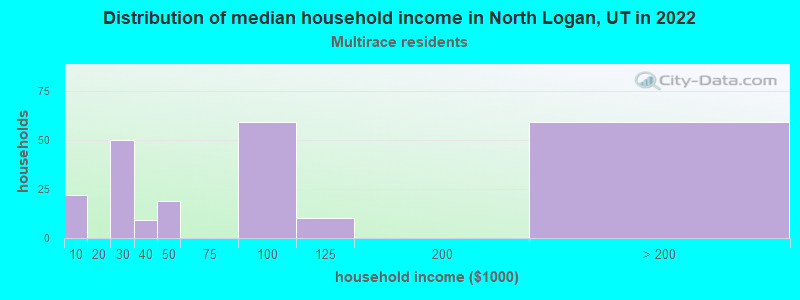
Income and house value in North Logan Median household income in 2022 $92,394 White non-Hispanic householders$80,505 Asian householders$70,319 Two or more races householdersMedian 2022 house value $537,408 White Non-Hispanic householders$574,154 Black or African American householders $426,817 Asian householders$485,822 Some other race householders$489,709 Hispanic or Latino householders
Median age by race in North Logan
28.8 Median age for White residents27.6 30.6 -503,105,589.6 Median age for Black or African American residents-656,596,172.6 -661,040,787.0 38.5 Median age for American Indian / Alaska Native residents-720,955,482.4 44.4 43.6 Median age for Asian residents58.2 40.0 -604,898,827.9 Median age for Native Hawaiian / Pacific Islander residents-1,076,305,219.8 -664,285,713.6 21.0 Median age for Other race residents19.0 23.5 24.1 Median age for Two or more races residents21.9 28.3 29.0 Median age for White alone residents28.2 30.6 23.5 Median age for Hispanic or Latino residents22.7 23.9
Owner/renter occupied households by race in North Logan
House owners and renters - White residents 1,978 61.7% Owner occupied1,227 38.3% Renter occupiedHouse owners and renters - American Indian / Alaska Native residents 14 100.0% Renter occupiedHouse owners and renters - Asian residents 95 100.0% Owner occupiedHouse owners and renters - Other race residents 23 10.7% Owner occupied190 89.3% Renter occupiedHouse owners and renters - Two or more races residents 121 41.9% Owner occupied168 58.1% Renter occupiedHouse owners and renters - White alone residents 2,022 62.7% Owner occupied1,204 37.3% Renter occupiedHouse owners and renters - Hispanic or Latino residents 60 19.1% Owner occupied254 80.9% Renter occupied
Language usage in North Logan
English speakers - Total 89.9% of residents of North Logan speak English at home.
7.1% of residents speak Spanish at home 582 76.0% Speak English very well184 24.0% Speak English less than very well2.7% of residents speak other language at home 233 78.5% Speak English very well64 21.5% Speak English less than very well
English speakers - Born in the United States 96.6% of residents of North Logan speak English at home.
2.6% of residents speak Spanish at home 97 100.0% Speak English very well2.0% of residents speak other language at home 74 100.0% Speak English very well
English speakers - Native, born elsewhere 70.1% of residents of North Logan speak English at home.
61.2% of residents speak Spanish at home 1 2.4% Speak English very well40 97.6% Speak English less than very well11.9% of residents speak other language at home 8 100.0% Speak English less than very well
English speakers - Foreign-born 22.1% of residents of North Logan speak English at home.
52.7% of residents speak Spanish at home 275 61.2% Speak English very well174 38.8% Speak English less than very well28.4% of residents speak other language at home 190 78.5% Speak English very well52 21.5% Speak English less than very well
White (Caucasian) - Speak only English Native:
97.9% (8,451)Foreign-born:
100.0% (123)
White (Caucasian) - Speak another language Native:
2.2% (186)Foreign-born:
29.1% (36)
American Indian / Alaska Native - Speak another language Native:
52.5% (17)Foreign-born:
96.1% (8)
Asian - Speak only English Native:
62.3% (65)Foreign-born:
16.8% (35)
Asian - Speak another language Native:
35.8% (37)Foreign-born:
83.2% (172)
Other race - Speak only English Native:
71.5% (163)Foreign-born:
8.1% (18)
Other race - Speak another language Native:
33.8% (77)Foreign-born:
87.8% (195)
Two or more races - Speak another language Native:
7.7% (79)Foreign-born:
100.0% (321)
White alone - Speak only English Native:
98.2% (8,498)Foreign-born:
95.3% (110)
White alone - Speak another language Native:
1.5% (132)Foreign-born:
10.5% (12)
Hispanic or Latino - Speak only English Native:
63.2% (349)Foreign-born:
8.1% (38)
Hispanic or Latino - Speak another language Native:
37.2% (205)Foreign-born:
93.2% (437)
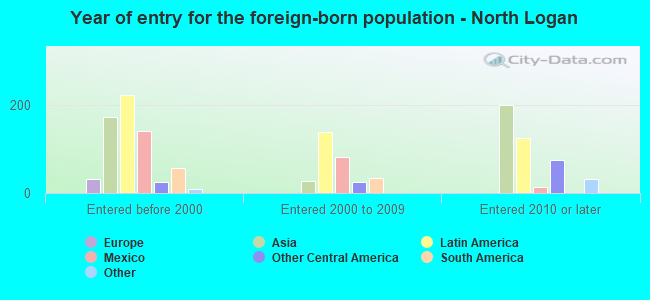
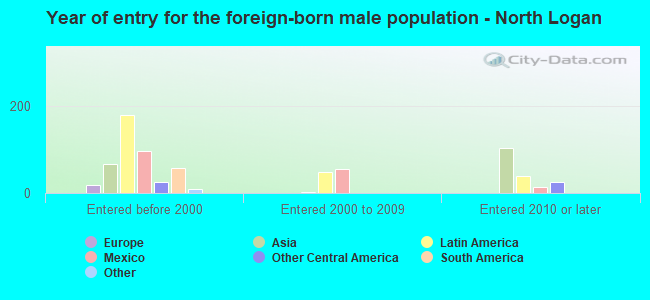
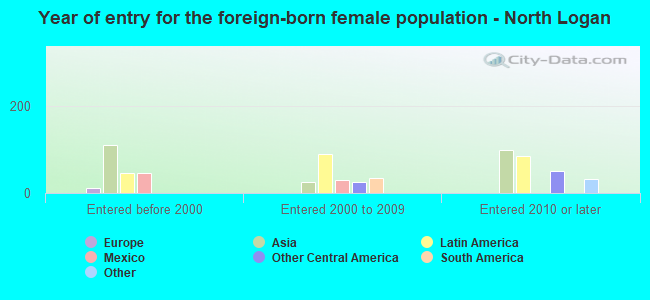
Foreign-born residents in North Logan 985 residents are foreign born (4.2% Latin America , 3.5% Asia ).
Marital status for residents in North Logan Marital status - White (Caucasian) population 15 years and over
Males 43.9% Never married48.6% Now married0.3% Separated1.6% Widowed5.7% DivorcedFemales 36.2% Never married45.1% Now married2.5% Separated9.0% Widowed7.3% DivorcedWomen who gave birth in the past 12 months Now married:
100.0% (54)Unmarried:
0.0% (0)
Women who did not give birth in the past 12 months Now married:
44.2% (1,014)Unmarried:
55.8% (1,279)
Marital status - American Indian / Alaska Native population 15 years and over
Males 60.0% Never married40.0% Now married0.0% Separated0.0% Widowed0.0% DivorcedFemales 100.0% Never married0.0% Now married0.0% Separated0.0% Widowed0.0% DivorcedWomen who did not give birth in the past 12 months Now married:
0.0% (0)Unmarried:
100.0% (15)
Marital status - Asian population 15 years and over
Males 38.0% Never married56.2% Now married0.0% Separated0.0% Widowed5.8% DivorcedFemales 11.7% Never married77.8% Now married0.0% Separated0.0% Widowed10.5% DivorcedWomen who did not give birth in the past 12 months Now married:
75.0% (63)Unmarried:
25.0% (21)
Marital status - Other race population 15 years and over
Males 22.4% Never married69.7% Now married0.0% Separated0.0% Widowed7.9% DivorcedFemales 51.2% Never married48.8% Now married0.0% Separated0.0% Widowed0.0% DivorcedWomen who gave birth in the past 12 months Now married:
61.1% (38)Unmarried:
38.9% (24)
Women who did not give birth in the past 12 months Now married:
42.5% (75)Unmarried:
57.5% (101)
Marital status - Two or more races population 15 years and over
Males 57.2% Never married40.8% Now married2.0% Separated0.0% Widowed0.0% DivorcedFemales 31.8% Never married52.7% Now married9.5% Separated5.0% Widowed0.9% DivorcedWomen who gave birth in the past 12 months Now married:
100.0% (11)Unmarried:
0.0% (0)
Women who did not give birth in the past 12 months Now married:
53.6% (78)Unmarried:
46.4% (68)
Marital status - White alone, not Hispanic / Latino population 15 years and over
Males 43.1% Never married49.2% Now married0.3% Separated1.6% Widowed5.8% DivorcedFemales 36.3% Never married44.6% Now married2.5% Separated9.2% Widowed7.4% DivorcedWomen who gave birth in the past 12 months Now married:
100.0% (55)Unmarried:
0.0% (0)
Women who did not give birth in the past 12 months Now married:
43.5% (989)Unmarried:
56.5% (1,285)
Marital status - Hispanic or Latino population 15 years and over
Males 47.0% Never married49.4% Now married0.0% Separated0.0% Widowed3.6% DivorcedFemales 43.2% Never married48.7% Now married5.0% Separated2.6% Widowed0.5% DivorcedWomen who gave birth in the past 12 months Now married:
61.1% (35)Unmarried:
38.9% (22)
Women who did not give birth in the past 12 months Now married:
48.4% (159)Unmarried:
51.6% (170)
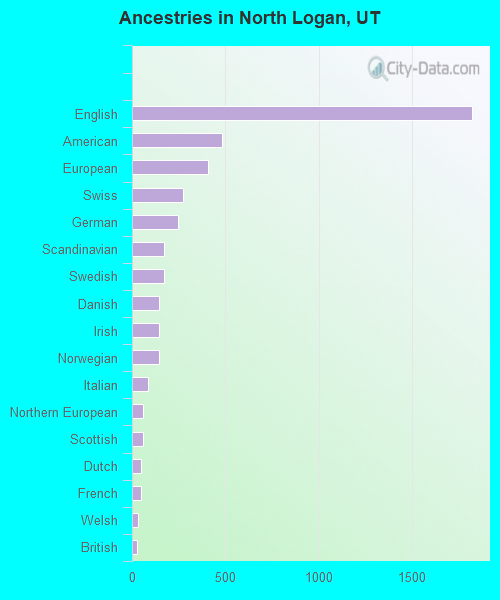
Ancestries in North Logan
1,822 31.6% English481 8.3% American408 7.1% European272 4.7% Swiss246 4.3% German173 3.0% Scandinavian172 3.0% Swedish147 2.6% Danish145 2.5% Irish145 2.5% Norwegian85 1.5% Italian61 1.1% Northern European57 1.0% Scottish50 0.9% Dutch50 0.9% French33 0.6% Welsh26 0.5% British12 0.2% Portuguese10 0.2% Palestinian8 0.1% Scotch-Irish7 0.1% French Canadian6 0.1% Czech6 0.1% Greek
Children Nativity (place of birth) in North Logan
Children under 6 years - Living with two parents Both parents native 567 99.9% Native1 0.1% Foreign-bornBoth parents foreign-born 27 74.5% Native9 25.5% Foreign-bornOne native, one foreign-born parent 38 100.0% NativeChildren under 6 years - Living with one parent Native parent 130 100.0% NativeChildren 6 to 17 years - Living with two parents Both parents native 1,681 100.0% NativeBoth parents foreign-born 47 48.9% Native49 51.1% Foreign-bornOne native, one foreign-born parent 85 100.0% NativeChildren 6 to 17 years - Living with one parent Native parent 327 100.0% NativeForeign-born parent 88 50.7% Native86 49.3% Foreign-born
Grandparents responsible for own grandchildren in North Logan
Grandparents (30 to 59 years) White / Caucasian 13 100.0% Not responsible for grandchildrenTwo or more races 56 100.0% Not responsible for grandchildrenWhite alone, not Hispanic / Latino 14 100.0% Not responsible for grandchildrenHispanic or Latino 39 100.0% Not responsible for grandchildren
Grandparents (60 years and over) White / Caucasian 40 100.0% Not responsible for grandchildrenWhite alone, not Hispanic / Latino 41 100.0% Not responsible for grandchildren