Races in North Lynnwood, Washington (WA) Detailed Stats
Data:
Races - White alone (%)
Races - White alone (% change since 2000)
Races - Black alone (%)
Races - Black alone (% change since 2000)
Races - American Indian alone (%)
Races - American Indian alone (% change since 2000)
Races - Asian alone (%)
Races - Asian alone (% change since 2000)
Races - Hispanic (%)
Races - Hispanic (% change since 2000)
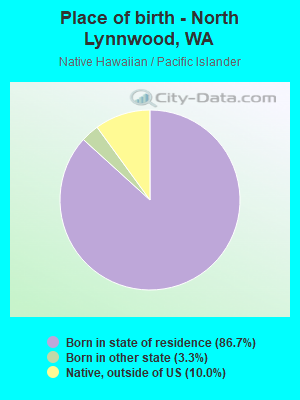
Races - Native Hawaiian and Other Pacific Islander alone (%)
Races - Native Hawaiian and Other Pacific Islander alone (% change since 2000)
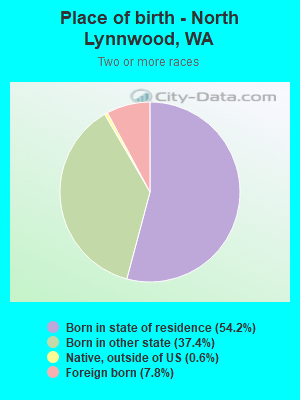
Races - Two or more races(%)
Races - Two or more races(% change since 2000)
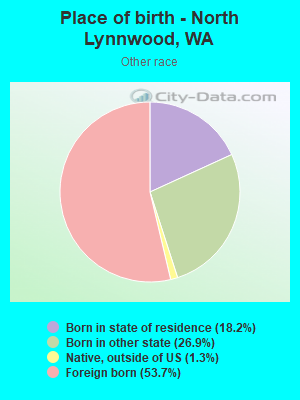
Races - Other race alone (%)
Races - Other race alone (% change since 2000)
Racial diversity
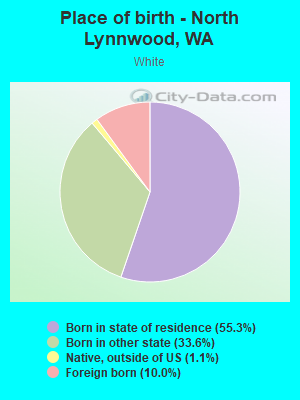
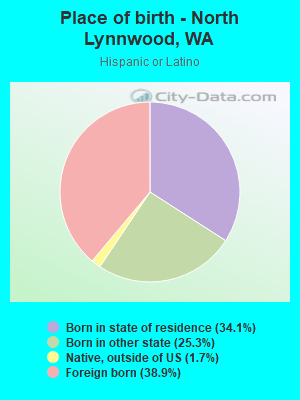
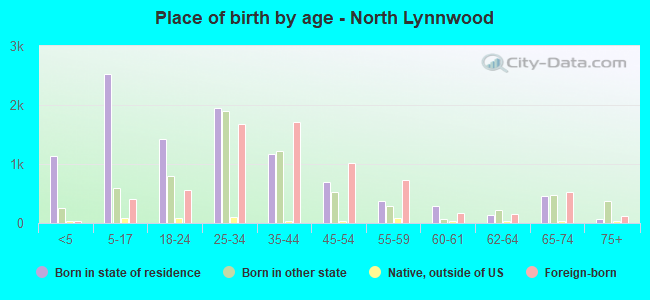
Place of birth - Born in state of residence (%)
Place of birth - Born in state of residence (%) - White
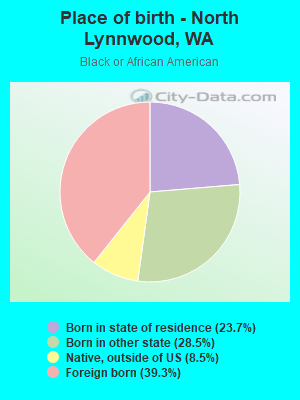
Place of birth - Born in state of residence (%) - Black or African American
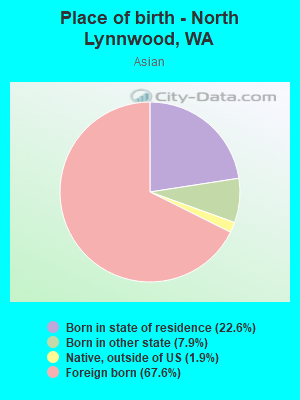
Place of birth - Born in state of residence (%) - Asian
Place of birth - Born in state of residence (%) - Hispanic or Latino
Place of birth - Born in state of residence (%) - American Indian and Alaska Native
Place of birth - Born in state of residence (%) - Multirace
Place of birth - Born in state of residence (%) - Other Race
Place of birth - Born in other state (%)
Place of birth - Born in other state (%) - White
Place of birth - Born in other state (%) - Black or African American
Place of birth - Born in other state (%) - Asian
Place of birth - Born in other state (%) - Hispanic or Latino
Place of birth - Born in other state (%) - American Indian and Alaska Native
Place of birth - Born in other state (%) - Multirace
Place of birth - Born in other state (%) - Other Race
Place of birth - Native, outside of US (%)
Place of birth - Native, outside of US (%) - White
Place of birth - Native, outside of US (%) - Black or African American
Place of birth - Native, outside of US (%) - Asian
Place of birth - Native, outside of US (%) - Hispanic or Latino
Place of birth - Native, outside of US (%) - American Indian and Alaska Native
Place of birth - Native, outside of US (%) - Multirace
Place of birth - Native, outside of US (%) - Other Race
Place of birth - Foreign born (%)
Place of birth - Foreign born (%) - White
Place of birth - Foreign born (%) - Black or African American
Place of birth - Foreign born (%) - Asian
Place of birth - Foreign born (%) - Hispanic or Latino
Place of birth - Foreign born (%) - American Indian and Alaska Native
Place of birth - Foreign born (%) - Multirace
Place of birth - Foreign born (%) - Other Race
Residents speaking English at home (%)
Residents speaking English at home - Born in the United States (%)
Residents speaking English at home - Native, born elsewhere (%)
Residents speaking English at home - Foreign born (%)
Residents speaking Spanish at home (%)
Residents speaking Spanish at home - Born in the United States (%)
Residents speaking Spanish at home - Native, born elsewhere (%)
Residents speaking Spanish at home - Foreign born (%)
Residents speaking other language at home (%)
Residents speaking other language at home - Born in the United States (%)
Residents speaking other language at home - Native, born elsewhere (%)
Residents speaking other language at home - Foreign born (%)
Marital status - Never married (%)
Marital status - Now married (%)
Marital status - Separated (%)
Marital status - Widowed (%)
Marital status - Divorced (%)
Ancestries Reported - Arab (%)
Ancestries Reported - Czech (%)
Ancestries Reported - Danish (%)
Ancestries Reported - Dutch (%)
Ancestries Reported - English (%)
Ancestries Reported - French (%)
Ancestries Reported - French Canadian (%)
Ancestries Reported - German (%)
Ancestries Reported - Greek (%)
Ancestries Reported - Hungarian (%)
Ancestries Reported - Irish (%)
Ancestries Reported - Italian (%)
Ancestries Reported - Lithuanian (%)
Ancestries Reported - Norwegian (%)
Ancestries Reported - Polish (%)
Ancestries Reported - Portuguese (%)
Ancestries Reported - Russian (%)
Ancestries Reported - Scotch-Irish (%)
Ancestries Reported - Scottish (%)
Ancestries Reported - Slovak (%)
Ancestries Reported - Subsaharan African (%)
Ancestries Reported - Swedish (%)
Ancestries Reported - Swiss (%)
Ancestries Reported - Ukrainian (%)
Ancestries Reported - United States (%)
Ancestries Reported - Welsh (%)
Ancestries Reported - West Indian (%)
Ancestries Reported - Other (%)
Geographical mobility - Same house 1 year ago (%)
Geographical mobility - Same house 1 year ago (%) - White
Geographical mobility - Same house 1 year ago (%) - Black or African American
Geographical mobility - Same house 1 year ago (%) - Asian
Geographical mobility - Same house 1 year ago (%) - Hispanic or Latino
Geographical mobility - Same house 1 year ago (%) - American Indian and Alaska Native
Geographical mobility - Same house 1 year ago (%) - Multirace
Geographical mobility - Same house 1 year ago (%) - Other Race
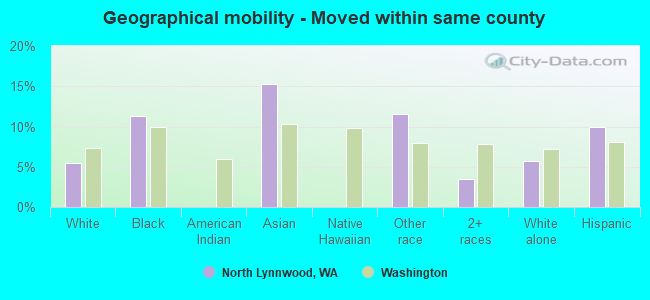
Geographical mobility - Moved within same county (%)
Geographical mobility - Moved within same county (%) - White
Geographical mobility - Moved within same county (%) - Black or African American
Geographical mobility - Moved within same county (%) - Asian
Geographical mobility - Moved within same county (%) - Hispanic or Latino
Geographical mobility - Moved within same county (%) - American Indian and Alaska Native
Geographical mobility - Moved within same county (%) - Multirace
Geographical mobility - Moved within same county (%) - Other Race
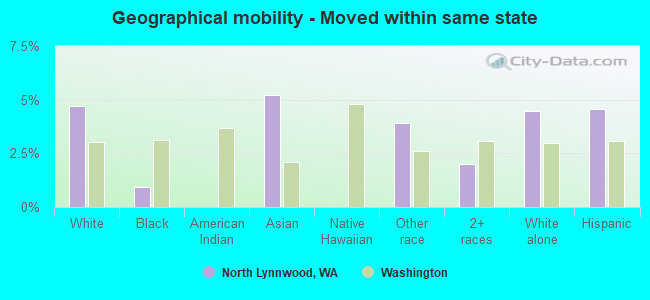
Geographical mobility - Moved from different county within same state (%)
Geographical mobility - Moved from different county within same state (%) - White
Geographical mobility - Moved from different county within same state (%) - Black or African American
Geographical mobility - Moved from different county within same state (%) - Asian
Geographical mobility - Moved from different county within same state (%) - Hispanic or Latino
Geographical mobility - Moved from different county within same state (%) - American Indian and Alaska Native
Geographical mobility - Moved from different county within same state (%) - Multirace
Geographical mobility - Moved from different county within same state (%) - Other Race
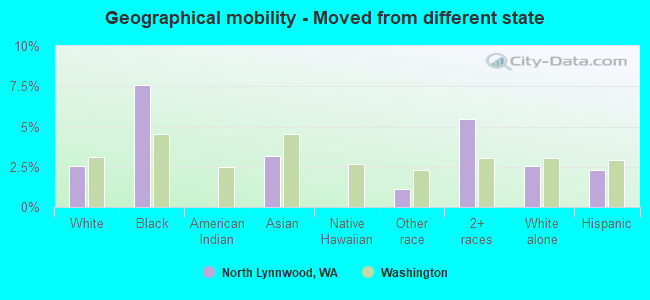
Geographical mobility - Moved from different state (%)
Geographical mobility - Moved from different state (%) - White
Geographical mobility - Moved from different state (%) - Black or African American
Geographical mobility - Moved from different state (%) - Asian
Geographical mobility - Moved from different state (%) - Hispanic or Latino
Geographical mobility - Moved from different state (%) - American Indian and Alaska Native
Geographical mobility - Moved from different state (%) - Multirace
Geographical mobility - Moved from different state (%) - Other Race
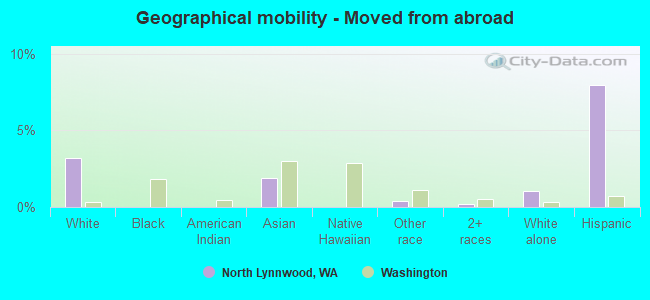
Geographical mobility - Moved from abroad (%)
Geographical mobility - Moved from abroad (%) - White
Geographical mobility - Moved from abroad (%) - Black or African American
Geographical mobility - Moved from abroad (%) - Asian
Geographical mobility - Moved from abroad (%) - Hispanic or Latino
Geographical mobility - Moved from abroad (%) - American Indian and Alaska Native
Geographical mobility - Moved from abroad (%) - Multirace
Geographical mobility - Moved from abroad (%) - Other Race
Place of birth for the foreign-born population - Ireland (%)
Place of birth for the foreign-born population - Denmark (%)
Place of birth for the foreign-born population - Norway (%)
Place of birth for the foreign-born population - Sweden (%)
Place of birth for the foreign-born population - United Kingdom (%)
Place of birth for the foreign-born population - England (%)
Place of birth for the foreign-born population - Scotland (%)
Place of birth for the foreign-born population - Other Northern Europe (%)
Place of birth for the foreign-born population - Austria (%)
Place of birth for the foreign-born population - Belgium (%)
Place of birth for the foreign-born population - France (%)
Place of birth for the foreign-born population - Germany (%)
Place of birth for the foreign-born population - Netherlands (%)
Place of birth for the foreign-born population - Switzerland (%)
Place of birth for the foreign-born population - Other Western Europe (%)
Place of birth for the foreign-born population - Greece (%)
Place of birth for the foreign-born population - Italy (%)
Place of birth for the foreign-born population - Portugal (%)
Place of birth for the foreign-born population - Spain (%)
Place of birth for the foreign-born population - Other Southern Europe (%)
Place of birth for the foreign-born population - Albania (%)
Place of birth for the foreign-born population - Belarus (%)
Place of birth for the foreign-born population - Bosnia and Herzegovina (%)
Place of birth for the foreign-born population - Bulgaria (%)
Place of birth for the foreign-born population - Croatia (%)
Place of birth for the foreign-born population - Czechoslovakia (%)
Place of birth for the foreign-born population - Hungary (%)
Place of birth for the foreign-born population - Latvia (%)
Place of birth for the foreign-born population - Lithuania (%)
Place of birth for the foreign-born population - North Macedonia (Macedonia) (%)
Place of birth for the foreign-born population - Moldova (%)
Place of birth for the foreign-born population - Poland (%)
Place of birth for the foreign-born population - Romania (%)
Place of birth for the foreign-born population - Russia (%)
Place of birth for the foreign-born population - Serbia (%)
Place of birth for the foreign-born population - Ukraine (%)
Place of birth for the foreign-born population - Other Eastern Europe (%)
Place of birth for the foreign-born population - China (%)
Place of birth for the foreign-born population - Hong Kong (%)
Place of birth for the foreign-born population - Taiwan (%)
Place of birth for the foreign-born population - Japan (%)
Place of birth for the foreign-born population - Korea (%)
Place of birth for the foreign-born population - Other Eastern Asia (%)
Place of birth for the foreign-born population - Afghanistan (%)
Place of birth for the foreign-born population - Bangladesh (%)
Place of birth for the foreign-born population - India (%)
Place of birth for the foreign-born population - Iran (%)
Place of birth for the foreign-born population - Kazakhstan (%)
Place of birth for the foreign-born population - Nepal (%)
Place of birth for the foreign-born population - Pakistan (%)
Place of birth for the foreign-born population - Sri Lanka (%)
Place of birth for the foreign-born population - Uzbekistan (%)
Place of birth for the foreign-born population - Other South Central Asia (%)
Place of birth for the foreign-born population - Burma (%)
Place of birth for the foreign-born population - Cambodia (%)
Place of birth for the foreign-born population - Indonesia (%)
Place of birth for the foreign-born population - Laos (%)
Place of birth for the foreign-born population - Malaysia (%)
Place of birth for the foreign-born population - Philippines (%)
Place of birth for the foreign-born population - Singapore (%)
Place of birth for the foreign-born population - Thailand (%)
Place of birth for the foreign-born population - Vietnam (%)
Place of birth for the foreign-born population - Other South Eastern Asia (%)
Place of birth for the foreign-born population - Armenia (%)
Place of birth for the foreign-born population - Iraq (%)
Place of birth for the foreign-born population - Israel (%)
Place of birth for the foreign-born population - Jordan (%)
Place of birth for the foreign-born population - Kuwait (%)
Place of birth for the foreign-born population - Lebanon (%)
Place of birth for the foreign-born population - Saudi Arabia (%)
Place of birth for the foreign-born population - Syria (%)
Place of birth for the foreign-born population - Turkey (%)
Place of birth for the foreign-born population - Yemen (%)
Place of birth for the foreign-born population - Other Western Asia (%)
Place of birth for the foreign-born population - Eritrea (%)
Place of birth for the foreign-born population - Ethiopia (%)
Place of birth for the foreign-born population - Kenya (%)
Place of birth for the foreign-born population - Somalia (%)
Place of birth for the foreign-born population - Uganda (%)
Place of birth for the foreign-born population - Zimbabwe (%)
Place of birth for the foreign-born population - Other Eastern Africa (%)
Place of birth for the foreign-born population - Cameroon (%)
Place of birth for the foreign-born population - Congo (%)
Place of birth for the foreign-born population - Democratic Republic of Congo (Zaire) (%)
Place of birth for the foreign-born population - Other Middle Africa (%)
Place of birth for the foreign-born population - Egypt (%)
Place of birth for the foreign-born population - Morocco (%)
Place of birth for the foreign-born population - Sudan (%)
Place of birth for the foreign-born population - Other Northern Africa (%)
Place of birth for the foreign-born population - South Africa (%)
Place of birth for the foreign-born population - Other Southern Africa (%)
Place of birth for the foreign-born population - Cabo Verde (%)
Place of birth for the foreign-born population - Ghana (%)
Place of birth for the foreign-born population - Liberia (%)
Place of birth for the foreign-born population - Nigeria (%)
Place of birth for the foreign-born population - Senegal (%)
Place of birth for the foreign-born population - Sierra Leone (%)
Place of birth for the foreign-born population - Other Western Africa (%)
Place of birth for the foreign-born population - Australia (%)
Place of birth for the foreign-born population - New Zealand (%)
Place of birth for the foreign-born population - Fiji (%)
Place of birth for the foreign-born population - Micronesia (%)
Place of birth for the foreign-born population - Bahamas (%)
Place of birth for the foreign-born population - Barbados (%)
Place of birth for the foreign-born population - Cuba (%)
Place of birth for the foreign-born population - Dominica (%)
Place of birth for the foreign-born population - Dominican Republic (%)
Place of birth for the foreign-born population - Grenada (%)
Place of birth for the foreign-born population - Haiti (%)
Place of birth for the foreign-born population - Jamaica (%)
Place of birth for the foreign-born population - St. Vincent and the Grenadines (%)
Place of birth for the foreign-born population - Trinidad and Tobago (%)
Place of birth for the foreign-born population - West Indies (%)
Place of birth for the foreign-born population - Other Caribbean (%)
Place of birth for the foreign-born population - Belize (%)
Place of birth for the foreign-born population - Costa Rica (%)
Place of birth for the foreign-born population - El Salvador (%)
Place of birth for the foreign-born population - Guatemala (%)
Place of birth for the foreign-born population - Honduras (%)
Place of birth for the foreign-born population - Mexico (%)
Place of birth for the foreign-born population - Nicaragua (%)
Place of birth for the foreign-born population - Panama (%)
Place of birth for the foreign-born population - Other Central America (%)
Place of birth for the foreign-born population - Argentina (%)
Place of birth for the foreign-born population - Bolivia (%)
Place of birth for the foreign-born population - Brazil (%)
Place of birth for the foreign-born population - Chile (%)
Place of birth for the foreign-born population - Colombia (%)
Place of birth for the foreign-born population - Ecuador (%)
Place of birth for the foreign-born population - Guyana (%)
Place of birth for the foreign-born population - Peru (%)
Place of birth for the foreign-born population - Uruguay (%)
Place of birth for the foreign-born population - Venezuela (%)
Place of birth for the foreign-born population - Other South America (%)
Place of birth for the foreign-born population - Canada (%)
Place of birth for the foreign-born population - Other Northern America (%)
Place of birth for the foreign-born population - Other (%)
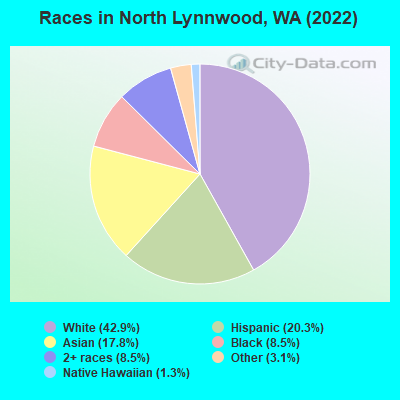
According to 2022 data, the most numerous races in North Lynnwood, WA are White alone (10,556 residents), Hispanic (4,987 residents), and Asian alone (4,373 residents). 63.6% of North Lynnwood residents speak English at home.
Race distribution in North Lynnwood 10,556 42.9% White alone 4,987 20.3% Hispanic 4,373 17.8% Asian alone 2,078 8.5% Two or more races 2,095 8.5% Black alone 772 3.1% Other race alone 324 1.3% Native Hawaiian and Other 11 0.04% American Indian alone
2000 2022
4,652,490 78.9% White alone 441,509 7.5% Hispanic 319,401 5.4% Asian alone 184,631 3.1% Black alone 175,926 3.0% Two or more races 85,396 1.4% American Indian alone 22,779 0.4% Native Hawaiian and Other 11,989 0.2% Other race alone
4,941,456 63.5% White alone 1,093,313 14.0% Hispanic 755,832 9.7% Asian alone 523,448 6.7% Two or more races 299,537 3.8% Black alone 69,024 0.9% American Indian alone 52,231 0.7% Native Hawaiian and Other 50,945 0.7% Other race alone
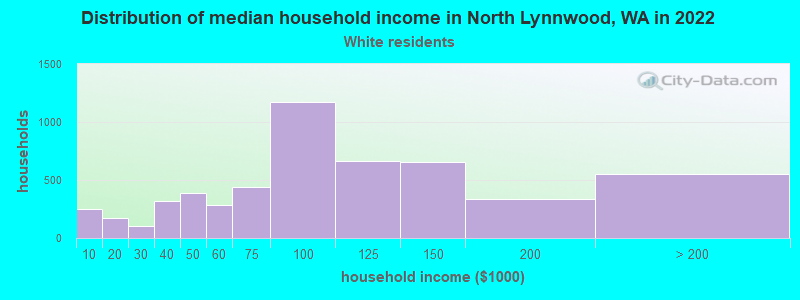
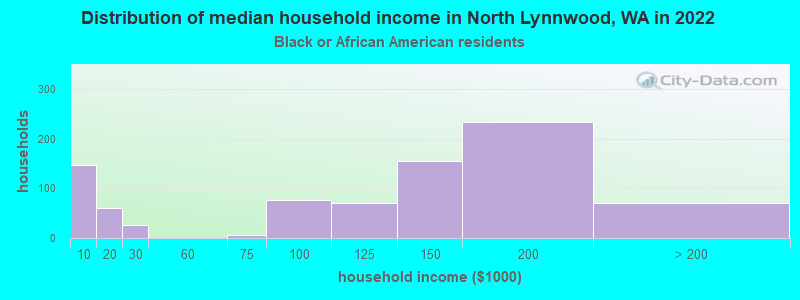
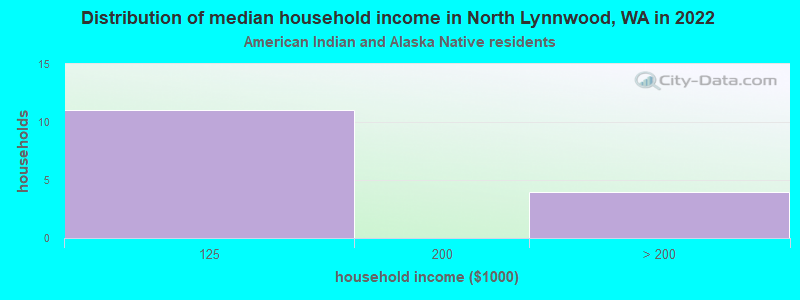
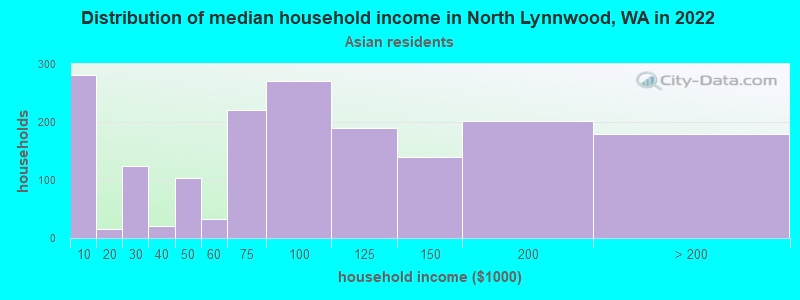
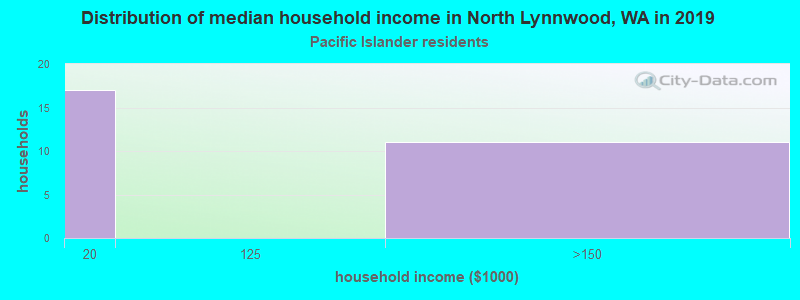
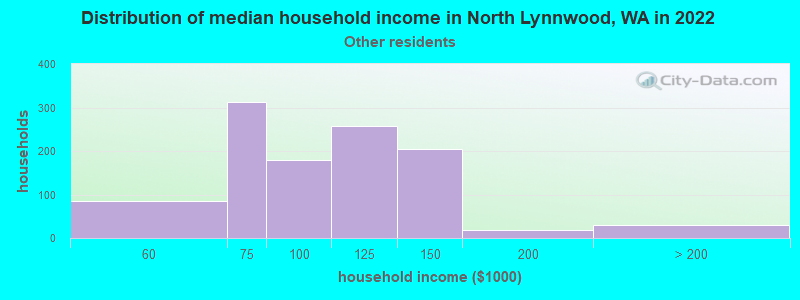
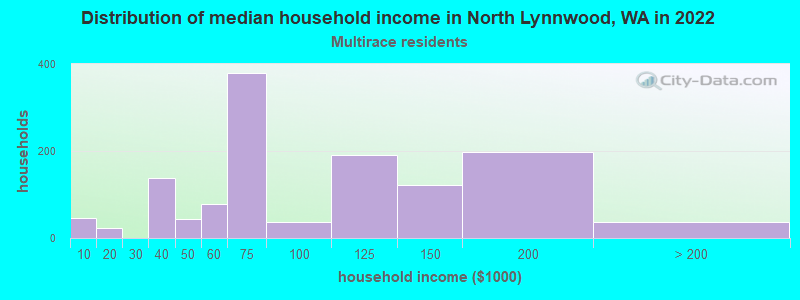
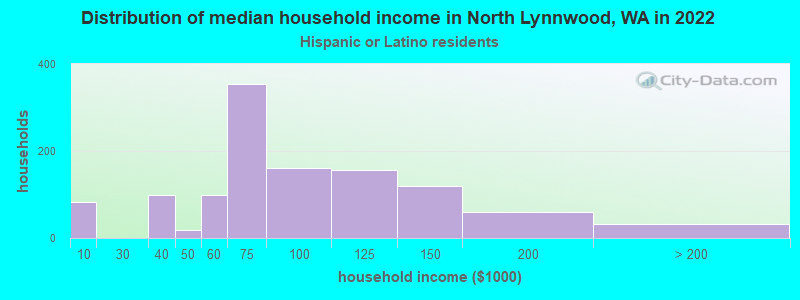
Income and house value in North Lynnwood Median household income in 2022 $90,234 White non-Hispanic householders$132,947 Black householders$82,987 Asian householders$96,750 Some other race householders$76,652 Two or more races householders$68,454 Hispanic or Latino race householders
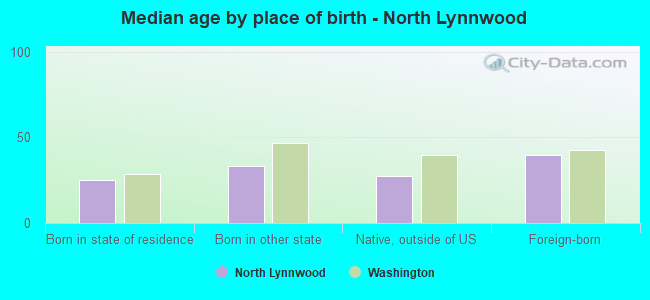
Median age by race in North Lynnwood
33.8 Median age for White residents32.3 36.9 32.9 Median age for Black or African American residents32.7 35.2 -644,308,942.4 Median age for American Indian / Alaska Native residents-736,637,511.4 -589,658,965.3 37.6 Median age for Asian residents36.5 39.0 50.2 Median age for Native Hawaiian / Pacific Islander residents55.4 41.0 28.4 Median age for Other race residents31.3 28.3 25.9 Median age for Two or more races residents27.4 25.7 35.1 Median age for White alone residents33.0 39.8 24.1 Median age for Hispanic or Latino residents24.5 23.5
Owner/renter occupied households by race in North Lynnwood
House owners and renters - White residents 2,233 41.3% Owner occupied3,170 58.7% Renter occupiedHouse owners and renters - Black or African American residents 254 33.2% Owner occupied512 66.8% Renter occupiedHouse owners and renters - American Indian / Alaska Native residents 3 29.2% Owner occupied8 70.8% Renter occupiedHouse owners and renters - Asian residents 1,304 72.9% Owner occupied485 27.1% Renter occupiedHouse owners and renters - Native Hawaiian / Pacific Islander residents 17 20.1% Owner occupied66 79.9% Renter occupiedHouse owners and renters - Other race residents 387 34.2% Owner occupied745 65.8% Renter occupiedHouse owners and renters - Two or more races residents 432 35.0% Owner occupied803 65.0% Renter occupiedHouse owners and renters - White alone residents 2,212 41.9% Owner occupied3,068 58.1% Renter occupiedHouse owners and renters - Hispanic or Latino residents 237 19.5% Owner occupied975 80.5% Renter occupied
Language usage in North Lynnwood
English speakers - Total 63.6% of residents of North Lynnwood speak English at home.
11.5% of residents speak Spanish at home 1,435 54.0% Speak English very well1,221 46.0% Speak English less than very well24.9% of residents speak other language at home 3,319 57.6% Speak English very well2,446 42.4% Speak English less than very well
English speakers - Born in the United States 88.7% of residents of North Lynnwood speak English at home.
7.2% of residents speak Spanish at home 457 97.0% Speak English very well14 3.0% Speak English less than very well4.0% of residents speak other language at home 262 100.0% Speak English very well
English speakers - Native, born elsewhere 47.4% of residents of North Lynnwood speak English at home.
22.3% of residents speak Spanish at home 18 16.5% Speak English very well91 83.5% Speak English less than very well35.6% of residents speak other language at home 174 100.0% Speak English very well
English speakers - Foreign-born 15.9% of residents of North Lynnwood speak English at home.
25.0% of residents speak Spanish at home 727 40.9% Speak English very well1,050 59.1% Speak English less than very well58.2% of residents speak other language at home 1,844 44.6% Speak English very well2,291 55.4% Speak English less than very well
White (Caucasian) - Speak only English Native:
93.2% (8,834)Foreign-born:
26.5% (292)
White (Caucasian) - Speak another language Native:
6.2% (586)Foreign-born:
73.3% (809)
Black or African American - Speak only English Native:
82.2% (919)Foreign-born:
60.0% (478)
Black or African American - Speak another language Native:
23.6% (263)Foreign-born:
56.6% (451)
Asian - Speak only English Native:
58.2% (703)Foreign-born:
10.5% (316)
Asian - Speak another language Native:
41.8% (505)Foreign-born:
89.1% (2,684)
Other race - Speak only English Native:
53.1% (924)Foreign-born:
4.8% (104)
Other race - Speak another language Native:
44.0% (765)Foreign-born:
93.3% (2,026)
Two or more races - Speak only English Native:
91.2% (2,679)Foreign-born:
34.5% (103)
Two or more races - Speak another language Native:
9.0% (264)Foreign-born:
68.8% (206)
White alone - Speak only English Native:
93.5% (8,522)Foreign-born:
28.1% (294)
White alone - Speak another language Native:
6.3% (579)Foreign-born:
72.2% (756)
Hispanic or Latino - Speak only English Native:
66.3% (1,639)Foreign-born:
7.5% (146)
Hispanic or Latino - Speak another language Native:
34.3% (848)Foreign-born:
92.3% (1,781)
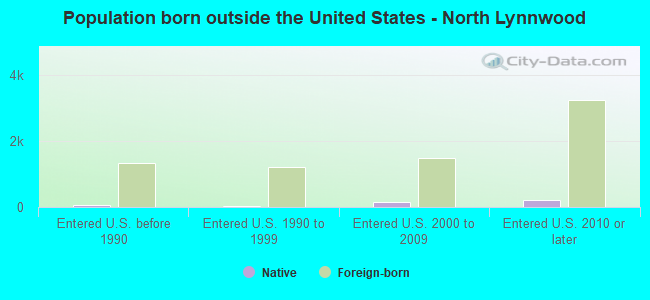
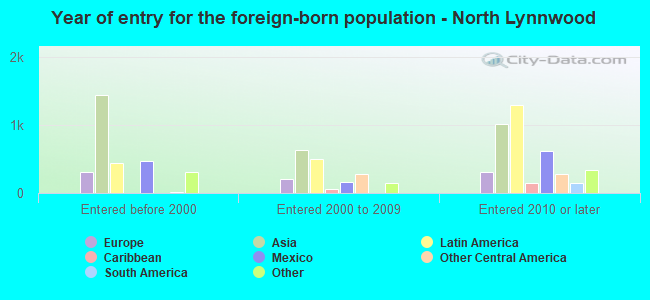
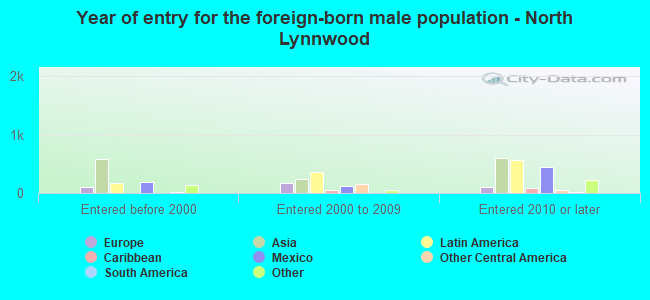
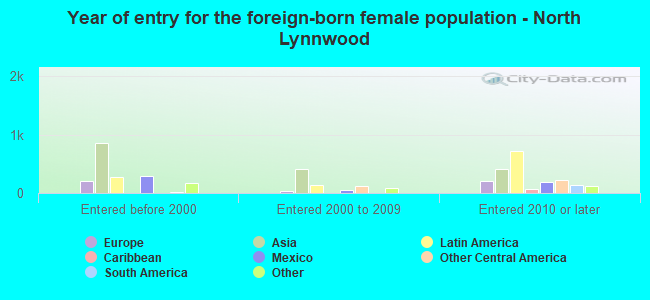
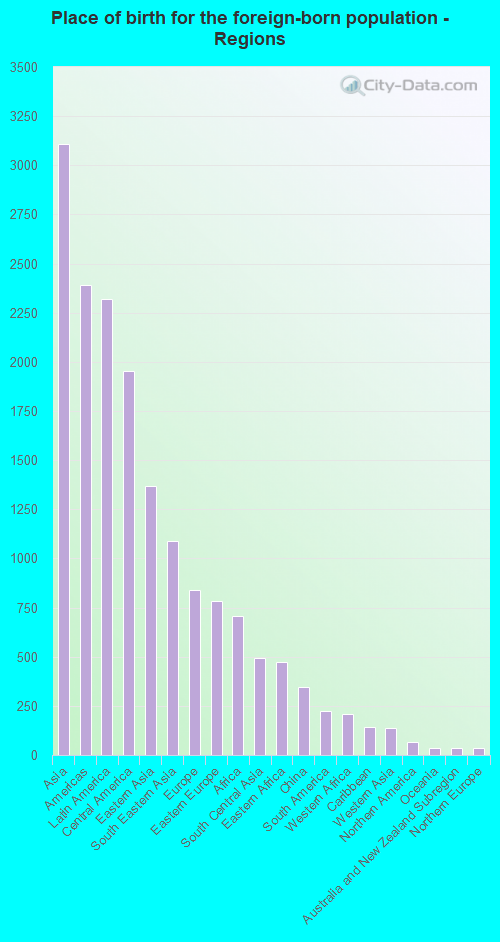
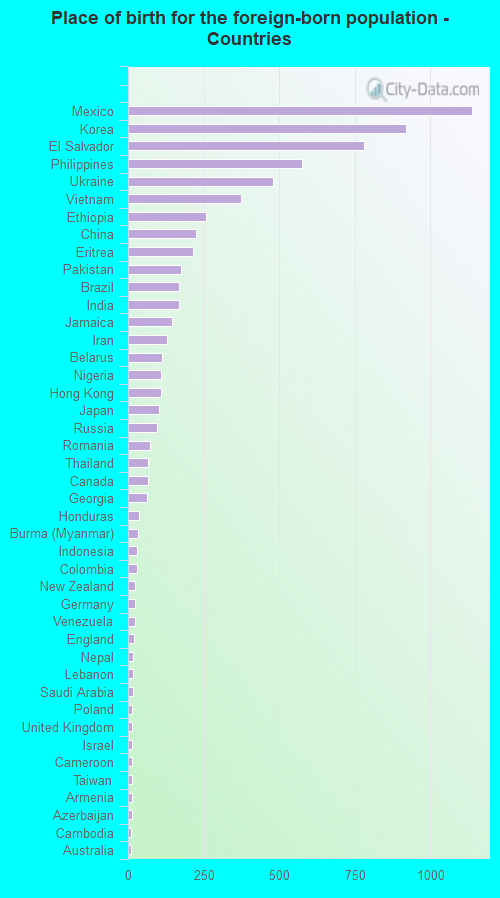
Foreign-born residents in North Lynnwood
Marital status for residents in North Lynnwood Marital status - White (Caucasian) population 15 years and over
Males 48.1% Never married38.8% Now married0.0% Separated1.1% Widowed12.0% DivorcedFemales 38.6% Never married36.3% Now married0.4% Separated4.6% Widowed20.2% DivorcedWomen who gave birth in the past 12 months Now married:
51.3% (114)Unmarried:
48.7% (108)
Women who did not give birth in the past 12 months Now married:
38.2% (974)Unmarried:
61.8% (1,577)
Marital status - Black or African American population 15 years and over
Males 56.9% Never married36.1% Now married0.0% Separated0.0% Widowed7.0% DivorcedFemales 46.9% Never married34.3% Now married0.7% Separated0.6% Widowed17.6% DivorcedWomen who gave birth in the past 12 months Now married:
100.0% (7)Unmarried:
0.0% (0)
Women who did not give birth in the past 12 months Now married:
31.6% (262)Unmarried:
68.4% (567)
Marital status - American Indian / Alaska Native population 15 years and over
Males 0.0% Never married100.0% Now married0.0% Separated0.0% Widowed0.0% DivorcedFemales 0.0% Never married0.0% Now married0.0% Separated0.0% Widowed100.0% DivorcedWomen who did not give birth in the past 12 months Now married:
0.0% (0)Unmarried:
100.0% (14)
Marital status - Asian population 15 years and over
Males 38.4% Never married54.3% Now married0.0% Separated2.1% Widowed5.2% DivorcedFemales 33.8% Never married46.0% Now married0.5% Separated8.6% Widowed11.1% DivorcedWomen who gave birth in the past 12 months Now married:
77.4% (54)Unmarried:
22.6% (16)
Women who did not give birth in the past 12 months Now married:
38.2% (594)Unmarried:
61.8% (962)
Marital status - Native Hawaiian / Pacific Islander population 15 years and over
Males 0.0% Never married100.0% Now married0.0% Separated0.0% Widowed0.0% DivorcedFemales 70.8% Never married29.2% Now married0.0% Separated0.0% Widowed0.0% DivorcedWomen who did not give birth in the past 12 months Now married:
29.2% (43)Unmarried:
70.8% (104)
Marital status - Other race population 15 years and over
Males 40.8% Never married57.0% Now married0.0% Separated0.0% Widowed2.3% DivorcedFemales 38.0% Never married46.2% Now married1.9% Separated0.0% Widowed13.9% DivorcedWomen who did not give birth in the past 12 months Now married:
44.5% (694)Unmarried:
55.5% (866)
Marital status - Two or more races population 15 years and over
Males 74.6% Never married14.4% Now married1.5% Separated1.4% Widowed8.0% DivorcedFemales 59.3% Never married21.9% Now married0.0% Separated0.0% Widowed18.8% DivorcedWomen who gave birth in the past 12 months Now married:
56.8% (27)Unmarried:
43.2% (21)
Women who did not give birth in the past 12 months Now married:
19.3% (197)Unmarried:
80.7% (825)
Marital status - White alone, not Hispanic / Latino population 15 years and over
Males 48.1% Never married38.0% Now married0.0% Separated1.2% Widowed12.7% DivorcedFemales 37.6% Never married35.9% Now married0.4% Separated4.8% Widowed21.2% DivorcedWomen who gave birth in the past 12 months Now married:
43.6% (85)Unmarried:
56.4% (110)
Women who did not give birth in the past 12 months Now married:
38.7% (934)Unmarried:
61.3% (1,479)
Marital status - Hispanic or Latino population 15 years and over
Males 52.2% Never married42.8% Now married1.1% Separated1.0% Widowed2.9% DivorcedFemales 53.6% Never married42.0% Now married1.5% Separated0.0% Widowed2.9% DivorcedWomen who gave birth in the past 12 months Now married:
100.0% (34)Unmarried:
0.0% (0)
Women who did not give birth in the past 12 months Now married:
39.2% (599)Unmarried:
60.8% (929)
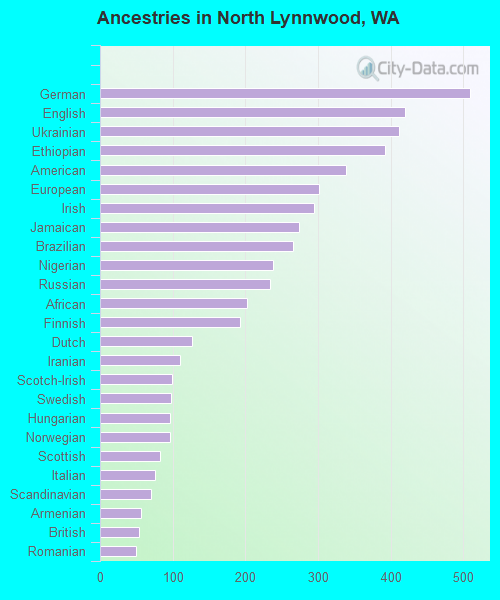
Ancestries in North Lynnwood
510 3.8% German420 3.1% English411 3.0% Ukrainian393 2.9% Ethiopian339 2.5% American302 2.2% European295 2.2% Irish274 2.0% Jamaican265 1.9% Brazilian238 1.8% Nigerian234 1.7% Russian203 1.5% African193 1.4% Finnish127 0.9% Dutch110 0.8% Iranian99 0.7% Scotch-Irish98 0.7% Swedish96 0.7% Hungarian96 0.7% Norwegian82 0.6% Scottish76 0.6% Italian70 0.5% Scandinavian57 0.4% Armenian53 0.4% British49 0.4% Romanian36 0.3% Icelander30 0.2% Polish25 0.2% Palestinian24 0.2% Belgian20 0.1% French15 0.1% Northern European12 0.09% Lebanese10 0.07% Canadian10 0.07% Welsh9 0.07% Portuguese9 0.07% Slovak8 0.06% French Canadian7 0.05% Eastern European
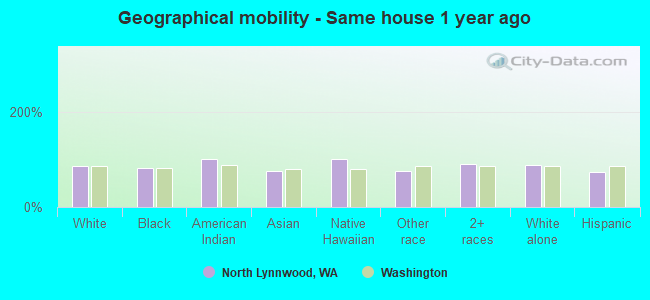
Geographical mobility in North Lynnwood Same house 1 year ago 9,281 85.1% White (Caucasian)1,680 81.3% Black or African American15 100.0% American Indian / Alaska Native3,354 76.2% Asian239 100.0% Native Hawaiian / Pacific Islander3,131 75.4% Other race3,325 90.6% Two or more races9,004 86.6% White alone, not Hispanic / Latino3,707 74.4% Hispanic or LatinoMoved within same county 597 5.5% White / Caucasian233 11.3% Black or African American675 15.3% Asian477 11.5% Other race125 3.4% Two or more races592 5.7% White alone, not Hispanic / Latino494 9.9% Hispanic or LatinoMoved within same state 512 4.7% White / Caucasian19 0.9% Black or African American229 5.2% Asian163 3.9% Other race73 2.0% Two or more races465 4.5% White alone, not Hispanic / Latino227 4.6% Hispanic or LatinoMoved from different state 279 2.6% White / Caucasian157 7.6% Black or African American138 3.1% Asian47 1.1% Other race200 5.4% Two or more races267 2.6% White alone, not Hispanic / Latino116 2.3% Hispanic or LatinoMoved from abroad 350 3.2% White83 1.9% Asian17 0.4% Other race7 0.2% Two or more races109 1.0% White alone, not Hispanic / Latino397 8.0% Hispanic or Latino
Children Nativity (place of birth) in North Lynnwood
Children under 6 years - Living with two parents Both parents native 285 100.0% NativeBoth parents foreign-born 359 90.0% Native40 10.0% Foreign-bornOne native, one foreign-born parent 446 100.0% NativeChildren under 6 years - Living with one parent Native parent 240 100.0% NativeForeign-born parent 74 100.0% NativeChildren 6 to 17 years - Living with two parents Both parents native 979 100.0% NativeBoth parents foreign-born 1,018 71.1% Native414 28.9% Foreign-bornOne native, one foreign-born parent 179 100.0% NativeChildren 6 to 17 years - Living with one parent Native parent 489 100.0% NativeForeign-born parent 302 51.3% Native287 48.7% Foreign-born
Grandparents responsible for own grandchildren in North Lynnwood
Grandparents (30 to 59 years) Asian 6 9.8% Responsible for grandchildren53 90.2% Not responsible for grandchildrenGrandparents (60 years and over) Asian 24 51.9% Responsible for grandchildren23 48.1% Not responsible for grandchildren