Races in North Mankato, Minnesota (MN) Detailed Stats
Data:
Races - White alone (%)
Races - White alone (% change since 2000)
Races - Black alone (%)
Races - Black alone (% change since 2000)
Races - American Indian alone (%)
Races - American Indian alone (% change since 2000)
Races - Asian alone (%)
Races - Asian alone (% change since 2000)
Races - Hispanic (%)
Races - Hispanic (% change since 2000)
Races - Native Hawaiian and Other Pacific Islander alone (%)
Races - Native Hawaiian and Other Pacific Islander alone (% change since 2000)
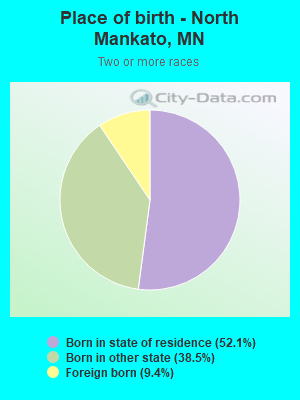
Races - Two or more races(%)
Races - Two or more races(% change since 2000)
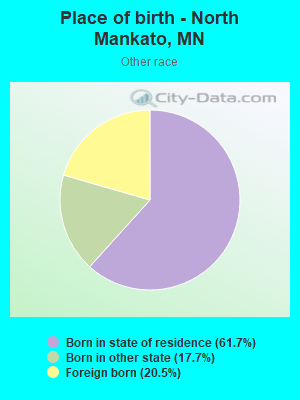
Races - Other race alone (%)
Races - Other race alone (% change since 2000)
Racial diversity
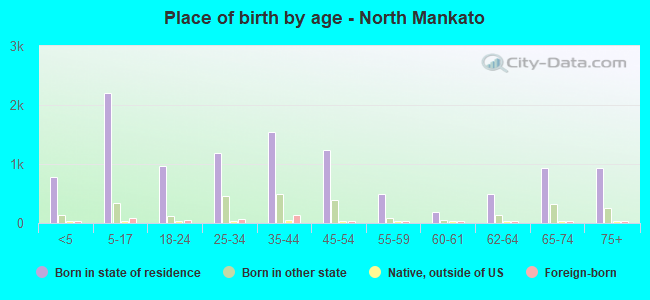
Place of birth - Born in state of residence (%)
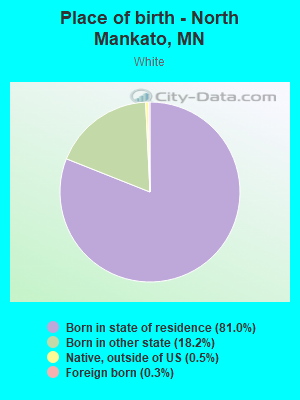
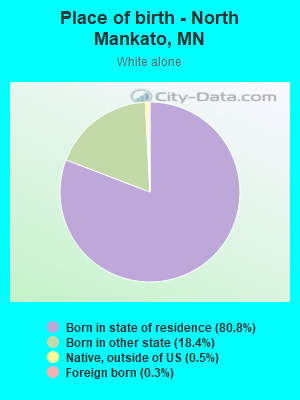
Place of birth - Born in state of residence (%) - White
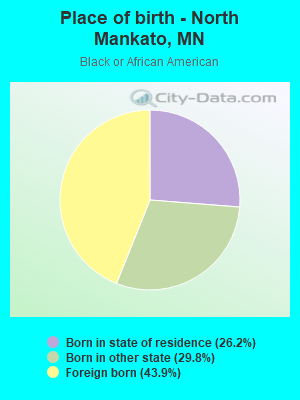
Place of birth - Born in state of residence (%) - Black or African American
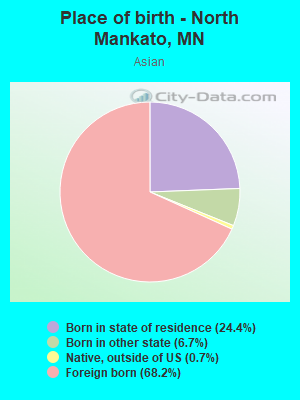
Place of birth - Born in state of residence (%) - Asian
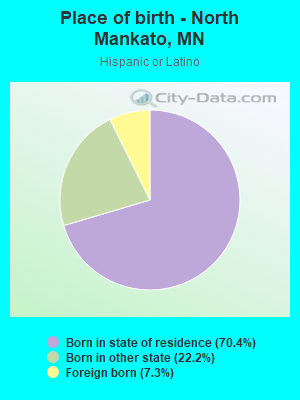
Place of birth - Born in state of residence (%) - Hispanic or Latino
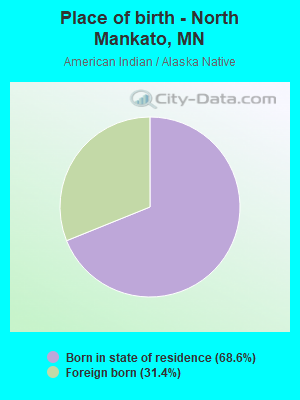
Place of birth - Born in state of residence (%) - American Indian and Alaska Native
Place of birth - Born in state of residence (%) - Multirace
Place of birth - Born in state of residence (%) - Other Race
Place of birth - Born in other state (%)
Place of birth - Born in other state (%) - White
Place of birth - Born in other state (%) - Black or African American
Place of birth - Born in other state (%) - Asian
Place of birth - Born in other state (%) - Hispanic or Latino
Place of birth - Born in other state (%) - American Indian and Alaska Native
Place of birth - Born in other state (%) - Multirace
Place of birth - Born in other state (%) - Other Race
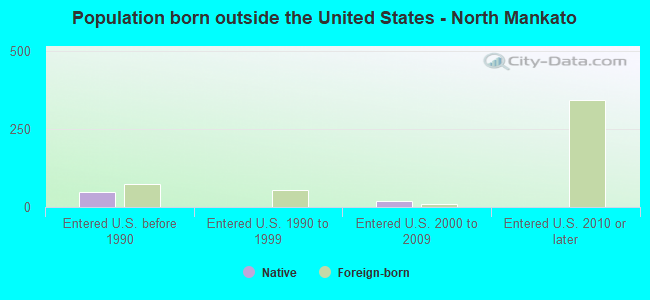
Place of birth - Native, outside of US (%)
Place of birth - Native, outside of US (%) - White
Place of birth - Native, outside of US (%) - Black or African American
Place of birth - Native, outside of US (%) - Asian
Place of birth - Native, outside of US (%) - Hispanic or Latino
Place of birth - Native, outside of US (%) - American Indian and Alaska Native
Place of birth - Native, outside of US (%) - Multirace
Place of birth - Native, outside of US (%) - Other Race
Place of birth - Foreign born (%)
Place of birth - Foreign born (%) - White
Place of birth - Foreign born (%) - Black or African American
Place of birth - Foreign born (%) - Asian
Place of birth - Foreign born (%) - Hispanic or Latino
Place of birth - Foreign born (%) - American Indian and Alaska Native
Place of birth - Foreign born (%) - Multirace
Place of birth - Foreign born (%) - Other Race
Residents speaking English at home (%)
Residents speaking English at home - Born in the United States (%)
Residents speaking English at home - Native, born elsewhere (%)
Residents speaking English at home - Foreign born (%)
Residents speaking Spanish at home (%)
Residents speaking Spanish at home - Born in the United States (%)
Residents speaking Spanish at home - Native, born elsewhere (%)
Residents speaking Spanish at home - Foreign born (%)
Residents speaking other language at home (%)
Residents speaking other language at home - Born in the United States (%)
Residents speaking other language at home - Native, born elsewhere (%)
Residents speaking other language at home - Foreign born (%)
Marital status - Never married (%)
Marital status - Now married (%)
Marital status - Separated (%)
Marital status - Widowed (%)
Marital status - Divorced (%)
Ancestries Reported - Arab (%)
Ancestries Reported - Czech (%)
Ancestries Reported - Danish (%)
Ancestries Reported - Dutch (%)
Ancestries Reported - English (%)
Ancestries Reported - French (%)
Ancestries Reported - French Canadian (%)
Ancestries Reported - German (%)
Ancestries Reported - Greek (%)
Ancestries Reported - Hungarian (%)
Ancestries Reported - Irish (%)
Ancestries Reported - Italian (%)
Ancestries Reported - Lithuanian (%)
Ancestries Reported - Norwegian (%)
Ancestries Reported - Polish (%)
Ancestries Reported - Portuguese (%)
Ancestries Reported - Russian (%)
Ancestries Reported - Scotch-Irish (%)
Ancestries Reported - Scottish (%)
Ancestries Reported - Slovak (%)
Ancestries Reported - Subsaharan African (%)
Ancestries Reported - Swedish (%)
Ancestries Reported - Swiss (%)
Ancestries Reported - Ukrainian (%)
Ancestries Reported - United States (%)
Ancestries Reported - Welsh (%)
Ancestries Reported - West Indian (%)
Ancestries Reported - Other (%)
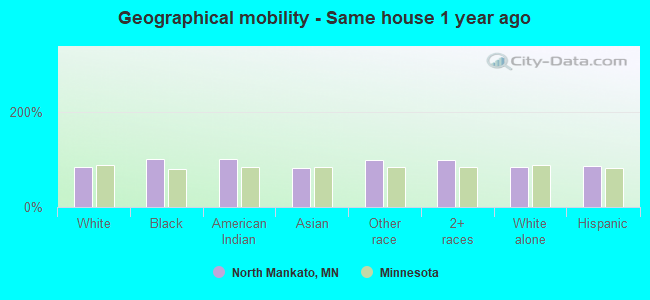
Geographical mobility - Same house 1 year ago (%)
Geographical mobility - Same house 1 year ago (%) - White
Geographical mobility - Same house 1 year ago (%) - Black or African American
Geographical mobility - Same house 1 year ago (%) - Asian
Geographical mobility - Same house 1 year ago (%) - Hispanic or Latino
Geographical mobility - Same house 1 year ago (%) - American Indian and Alaska Native
Geographical mobility - Same house 1 year ago (%) - Multirace
Geographical mobility - Same house 1 year ago (%) - Other Race
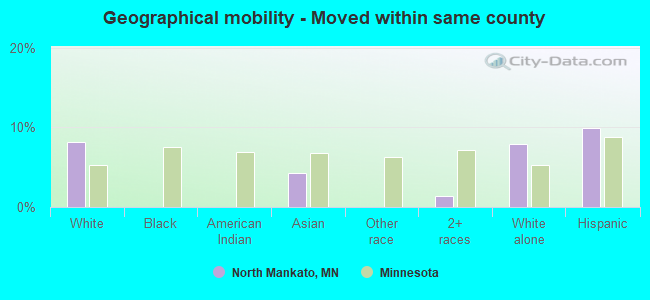
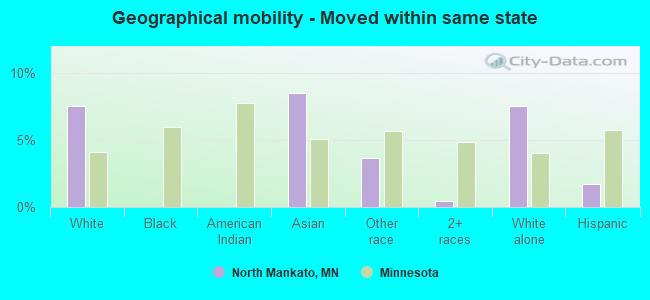
Geographical mobility - Moved within same county (%)
Geographical mobility - Moved within same county (%) - White
Geographical mobility - Moved within same county (%) - Black or African American
Geographical mobility - Moved within same county (%) - Asian
Geographical mobility - Moved within same county (%) - Hispanic or Latino
Geographical mobility - Moved within same county (%) - American Indian and Alaska Native
Geographical mobility - Moved within same county (%) - Multirace
Geographical mobility - Moved within same county (%) - Other Race
Geographical mobility - Moved from different county within same state (%)
Geographical mobility - Moved from different county within same state (%) - White
Geographical mobility - Moved from different county within same state (%) - Black or African American
Geographical mobility - Moved from different county within same state (%) - Asian
Geographical mobility - Moved from different county within same state (%) - Hispanic or Latino
Geographical mobility - Moved from different county within same state (%) - American Indian and Alaska Native
Geographical mobility - Moved from different county within same state (%) - Multirace
Geographical mobility - Moved from different county within same state (%) - Other Race
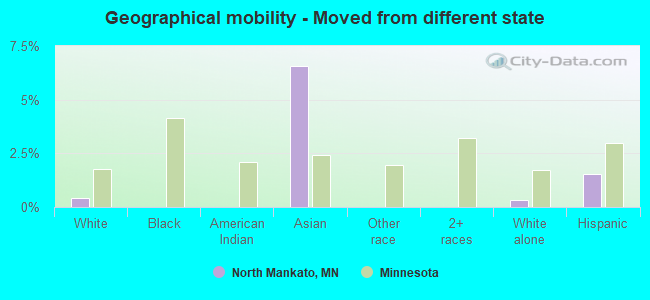
Geographical mobility - Moved from different state (%)
Geographical mobility - Moved from different state (%) - White
Geographical mobility - Moved from different state (%) - Black or African American
Geographical mobility - Moved from different state (%) - Asian
Geographical mobility - Moved from different state (%) - Hispanic or Latino
Geographical mobility - Moved from different state (%) - American Indian and Alaska Native
Geographical mobility - Moved from different state (%) - Multirace
Geographical mobility - Moved from different state (%) - Other Race
Geographical mobility - Moved from abroad (%)
Geographical mobility - Moved from abroad (%) - White
Geographical mobility - Moved from abroad (%) - Black or African American
Geographical mobility - Moved from abroad (%) - Asian
Geographical mobility - Moved from abroad (%) - Hispanic or Latino
Geographical mobility - Moved from abroad (%) - American Indian and Alaska Native
Geographical mobility - Moved from abroad (%) - Multirace
Geographical mobility - Moved from abroad (%) - Other Race
Place of birth for the foreign-born population - Ireland (%)
Place of birth for the foreign-born population - Denmark (%)
Place of birth for the foreign-born population - Norway (%)
Place of birth for the foreign-born population - Sweden (%)
Place of birth for the foreign-born population - United Kingdom (%)
Place of birth for the foreign-born population - England (%)
Place of birth for the foreign-born population - Scotland (%)
Place of birth for the foreign-born population - Other Northern Europe (%)
Place of birth for the foreign-born population - Austria (%)
Place of birth for the foreign-born population - Belgium (%)
Place of birth for the foreign-born population - France (%)
Place of birth for the foreign-born population - Germany (%)
Place of birth for the foreign-born population - Netherlands (%)
Place of birth for the foreign-born population - Switzerland (%)
Place of birth for the foreign-born population - Other Western Europe (%)
Place of birth for the foreign-born population - Greece (%)
Place of birth for the foreign-born population - Italy (%)
Place of birth for the foreign-born population - Portugal (%)
Place of birth for the foreign-born population - Spain (%)
Place of birth for the foreign-born population - Other Southern Europe (%)
Place of birth for the foreign-born population - Albania (%)
Place of birth for the foreign-born population - Belarus (%)
Place of birth for the foreign-born population - Bosnia and Herzegovina (%)
Place of birth for the foreign-born population - Bulgaria (%)
Place of birth for the foreign-born population - Croatia (%)
Place of birth for the foreign-born population - Czechoslovakia (%)
Place of birth for the foreign-born population - Hungary (%)
Place of birth for the foreign-born population - Latvia (%)
Place of birth for the foreign-born population - Lithuania (%)
Place of birth for the foreign-born population - North Macedonia (Macedonia) (%)
Place of birth for the foreign-born population - Moldova (%)
Place of birth for the foreign-born population - Poland (%)
Place of birth for the foreign-born population - Romania (%)
Place of birth for the foreign-born population - Russia (%)
Place of birth for the foreign-born population - Serbia (%)
Place of birth for the foreign-born population - Ukraine (%)
Place of birth for the foreign-born population - Other Eastern Europe (%)
Place of birth for the foreign-born population - China (%)
Place of birth for the foreign-born population - Hong Kong (%)
Place of birth for the foreign-born population - Taiwan (%)
Place of birth for the foreign-born population - Japan (%)
Place of birth for the foreign-born population - Korea (%)
Place of birth for the foreign-born population - Other Eastern Asia (%)
Place of birth for the foreign-born population - Afghanistan (%)
Place of birth for the foreign-born population - Bangladesh (%)
Place of birth for the foreign-born population - India (%)
Place of birth for the foreign-born population - Iran (%)
Place of birth for the foreign-born population - Kazakhstan (%)
Place of birth for the foreign-born population - Nepal (%)
Place of birth for the foreign-born population - Pakistan (%)
Place of birth for the foreign-born population - Sri Lanka (%)
Place of birth for the foreign-born population - Uzbekistan (%)
Place of birth for the foreign-born population - Other South Central Asia (%)
Place of birth for the foreign-born population - Burma (%)
Place of birth for the foreign-born population - Cambodia (%)
Place of birth for the foreign-born population - Indonesia (%)
Place of birth for the foreign-born population - Laos (%)
Place of birth for the foreign-born population - Malaysia (%)
Place of birth for the foreign-born population - Philippines (%)
Place of birth for the foreign-born population - Singapore (%)
Place of birth for the foreign-born population - Thailand (%)
Place of birth for the foreign-born population - Vietnam (%)
Place of birth for the foreign-born population - Other South Eastern Asia (%)
Place of birth for the foreign-born population - Armenia (%)
Place of birth for the foreign-born population - Iraq (%)
Place of birth for the foreign-born population - Israel (%)
Place of birth for the foreign-born population - Jordan (%)
Place of birth for the foreign-born population - Kuwait (%)
Place of birth for the foreign-born population - Lebanon (%)
Place of birth for the foreign-born population - Saudi Arabia (%)
Place of birth for the foreign-born population - Syria (%)
Place of birth for the foreign-born population - Turkey (%)
Place of birth for the foreign-born population - Yemen (%)
Place of birth for the foreign-born population - Other Western Asia (%)
Place of birth for the foreign-born population - Eritrea (%)
Place of birth for the foreign-born population - Ethiopia (%)
Place of birth for the foreign-born population - Kenya (%)
Place of birth for the foreign-born population - Somalia (%)
Place of birth for the foreign-born population - Uganda (%)
Place of birth for the foreign-born population - Zimbabwe (%)
Place of birth for the foreign-born population - Other Eastern Africa (%)
Place of birth for the foreign-born population - Cameroon (%)
Place of birth for the foreign-born population - Congo (%)
Place of birth for the foreign-born population - Democratic Republic of Congo (Zaire) (%)
Place of birth for the foreign-born population - Other Middle Africa (%)
Place of birth for the foreign-born population - Egypt (%)
Place of birth for the foreign-born population - Morocco (%)
Place of birth for the foreign-born population - Sudan (%)
Place of birth for the foreign-born population - Other Northern Africa (%)
Place of birth for the foreign-born population - South Africa (%)
Place of birth for the foreign-born population - Other Southern Africa (%)
Place of birth for the foreign-born population - Cabo Verde (%)
Place of birth for the foreign-born population - Ghana (%)
Place of birth for the foreign-born population - Liberia (%)
Place of birth for the foreign-born population - Nigeria (%)
Place of birth for the foreign-born population - Senegal (%)
Place of birth for the foreign-born population - Sierra Leone (%)
Place of birth for the foreign-born population - Other Western Africa (%)
Place of birth for the foreign-born population - Australia (%)
Place of birth for the foreign-born population - New Zealand (%)
Place of birth for the foreign-born population - Fiji (%)
Place of birth for the foreign-born population - Micronesia (%)
Place of birth for the foreign-born population - Bahamas (%)
Place of birth for the foreign-born population - Barbados (%)
Place of birth for the foreign-born population - Cuba (%)
Place of birth for the foreign-born population - Dominica (%)
Place of birth for the foreign-born population - Dominican Republic (%)
Place of birth for the foreign-born population - Grenada (%)
Place of birth for the foreign-born population - Haiti (%)
Place of birth for the foreign-born population - Jamaica (%)
Place of birth for the foreign-born population - St. Vincent and the Grenadines (%)
Place of birth for the foreign-born population - Trinidad and Tobago (%)
Place of birth for the foreign-born population - West Indies (%)
Place of birth for the foreign-born population - Other Caribbean (%)
Place of birth for the foreign-born population - Belize (%)
Place of birth for the foreign-born population - Costa Rica (%)
Place of birth for the foreign-born population - El Salvador (%)
Place of birth for the foreign-born population - Guatemala (%)
Place of birth for the foreign-born population - Honduras (%)
Place of birth for the foreign-born population - Mexico (%)
Place of birth for the foreign-born population - Nicaragua (%)
Place of birth for the foreign-born population - Panama (%)
Place of birth for the foreign-born population - Other Central America (%)
Place of birth for the foreign-born population - Argentina (%)
Place of birth for the foreign-born population - Bolivia (%)
Place of birth for the foreign-born population - Brazil (%)
Place of birth for the foreign-born population - Chile (%)
Place of birth for the foreign-born population - Colombia (%)
Place of birth for the foreign-born population - Ecuador (%)
Place of birth for the foreign-born population - Guyana (%)
Place of birth for the foreign-born population - Peru (%)
Place of birth for the foreign-born population - Uruguay (%)
Place of birth for the foreign-born population - Venezuela (%)
Place of birth for the foreign-born population - Other South America (%)
Place of birth for the foreign-born population - Canada (%)
Place of birth for the foreign-born population - Other Northern America (%)
Place of birth for the foreign-born population - Other (%)
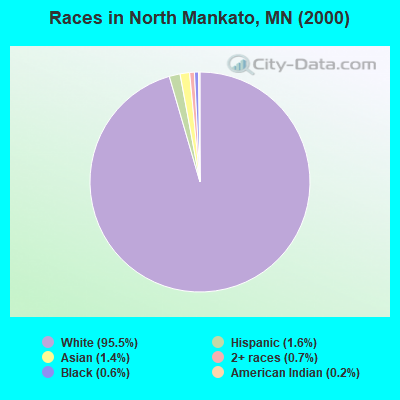
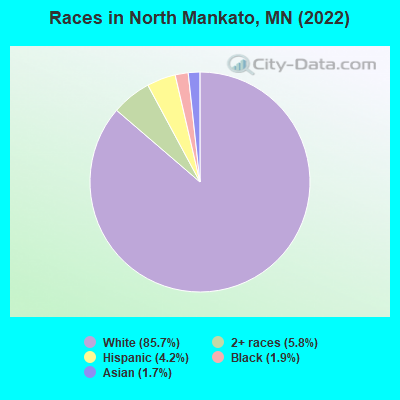
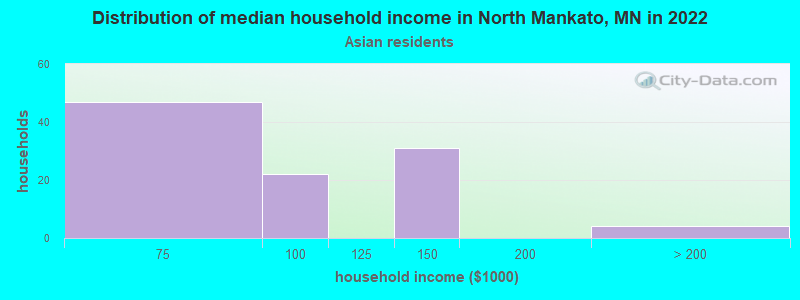
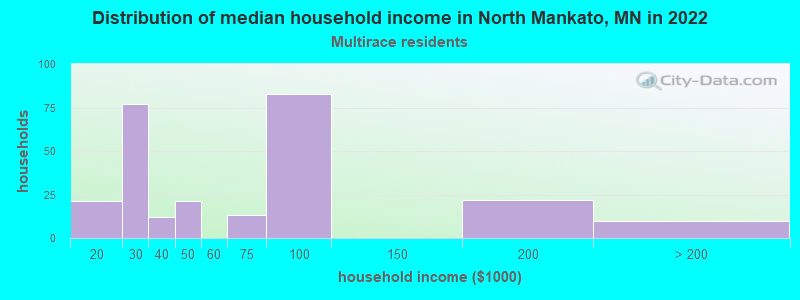
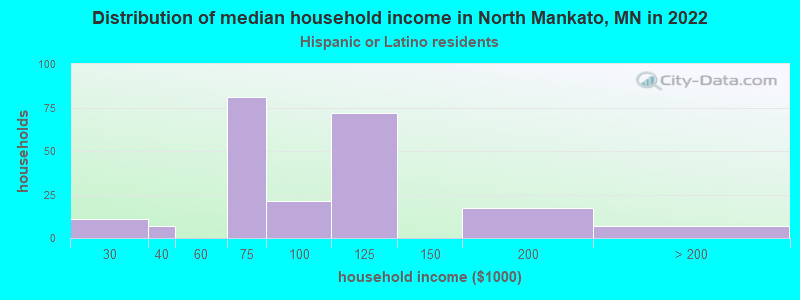
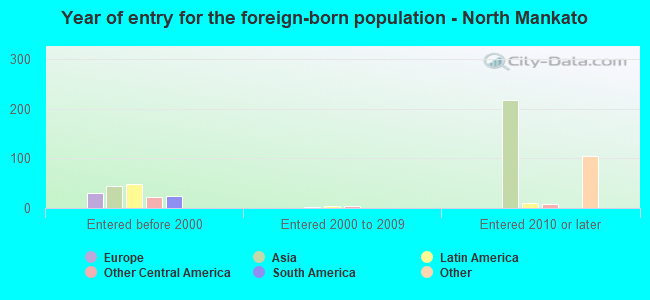
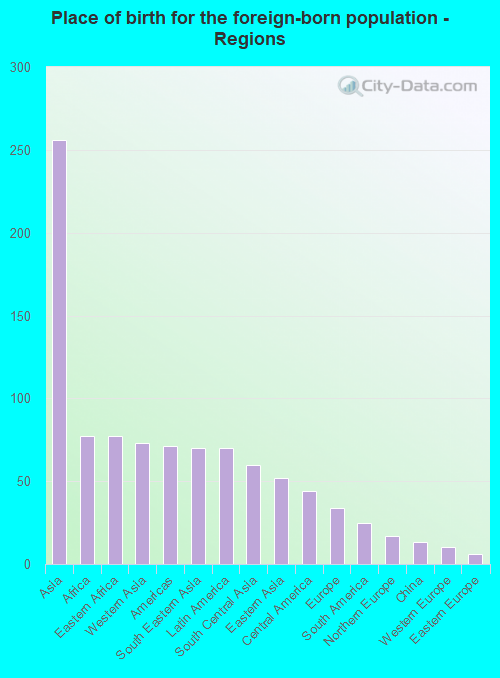
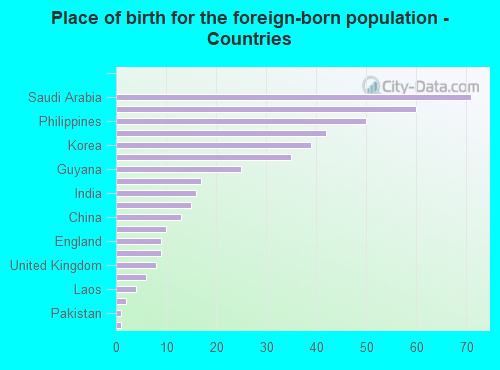
According to 2022 data, the most numerous races in North Mankato, MN are White alone (12,255 residents), Black alone (273 residents), and Hispanic (607 residents). 97.0% of North Mankato residents speak English at home. 3.1% of North Mankato, MN residents are foreign-born (1.7% born in Asia, 0.5% born in Africa, 0.5% born in Latin America), which is 160.5% less than the foreign-born rate of 8.0% across the entire state of Minnesota.
Race distribution in North Mankato
2000 2022
4,337,143 88.2% White alone 168,813 3.4% Black alone 143,382 2.9% Hispanic 141,083 2.9% Asian alone 70,304 1.4% Two or more races 52,009 1.1% American Indian alone 5,031 0.1% Other race alone 1,714 0.03% Native Hawaiian and Other
4,356,347 76.2% White alone 395,179 6.9% Black alone 333,830 5.8% Hispanic 294,800 5.2% Asian alone 259,649 4.5% Two or more races 42,125 0.7% American Indian alone 32,976 0.6% Other race alone 2,278 0.04% Native Hawaiian and Other
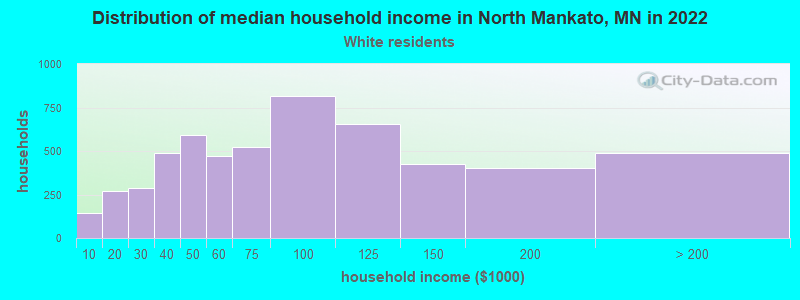
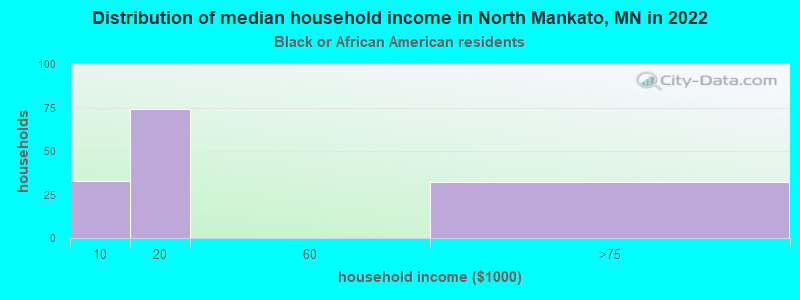
Income and house value in North Mankato Median household income in 2022 $74,079 White non-Hispanic householders$14,663 Black householders$66,729 Two or more races householders$97,551 Hispanic or Latino race householdersMedian 2022 house value $270,863 White Non-Hispanic householders$251,835 Black or African American householders$363,762 American Indian or Alaska Native householders $195,200 Asian householders$39,174 Some other race householders$466,287 Two or more races householders$100,734 Hispanic or Latino householders
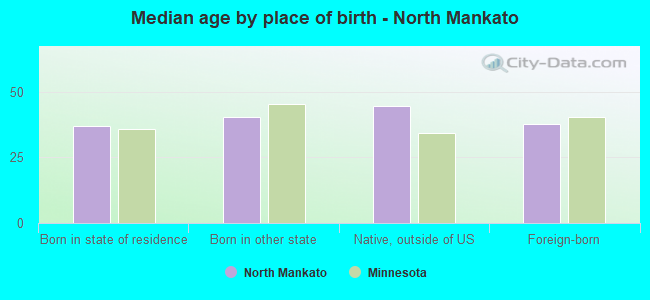
Median age by race in North Mankato
40.3 Median age for White residents39.7 40.9 26.0 Median age for Black or African American residents15.1 28.7 -673,400,672.7 Median age for American Indian / Alaska Native residents-666,666,666.0 -677,852,348.3 39.7 Median age for Asian residents36.4 39.8 -744,336,568.8 Median age for Native Hawaiian / Pacific Islander residents-856,799,036.4 -534,959,349.1 28.2 Median age for Other race residents24.8 28.2 12.7 Median age for Two or more races residents16.3 11.8 40.1 Median age for White alone residents39.6 40.6 20.1 Median age for Hispanic or Latino residents21.6 20.5
Owner/renter occupied households by race in North Mankato
House owners and renters - White residents 4,274 77.1% Owner occupied1,267 22.9% Renter occupiedHouse owners and renters - Black or African American residents 32 23.0% Owner occupied105 77.0% Renter occupiedHouse owners and renters - Asian residents 76 80.8% Owner occupied18 19.2% Renter occupiedHouse owners and renters - Other race residents 9 100.0% Owner occupiedHouse owners and renters - Two or more races residents 105 44.3% Owner occupied131 55.7% Renter occupiedHouse owners and renters - White alone residents 4,209 77.6% Owner occupied1,216 22.4% Renter occupiedHouse owners and renters - Hispanic or Latino residents 151 66.9% Owner occupied75 33.1% Renter occupied
Language usage in North Mankato
English speakers - Total 97.0% of residents of North Mankato speak English at home.
1.1% of residents speak Spanish at home 104 71.7% Speak English very well41 28.3% Speak English less than very well1.7% of residents speak other language at home 151 67.1% Speak English very well74 32.9% Speak English less than very well
English speakers - Born in the United States 96.3% of residents of North Mankato speak English at home.
3.0% of residents speak Spanish at home 81 100.0% Speak English very well0.3% of residents speak other language at home 8 100.0% Speak English very well
English speakers - Native, born elsewhere 73.6% of residents of North Mankato speak English at home.
22.2% of residents speak other language at home 14 87.5% Speak English very well2 12.5% Speak English less than very well
English speakers - Foreign-born 58.6% of residents of North Mankato speak English at home.
6.4% of residents speak Spanish at home 13 46.4% Speak English very well15 53.6% Speak English less than very well34.1% of residents speak other language at home 104 69.3% Speak English very well46 30.7% Speak English less than very well
White (Caucasian) - Speak only English Native:
99.7% (11,652)Foreign-born:
82.2% (26)
White (Caucasian) - Speak another language Native:
0.6% (75)Foreign-born:
31.1% (10)
Black or African American - Speak only English Native:
97.2% (103)Foreign-born:
26.9% (32)
American Indian / Alaska Native - Speak only English Native:
100.0% (3)Foreign-born:
62.1% (1)
Asian - Speak only English Native:
89.3% (71)Foreign-born:
62.0% (106)
Asian - Speak another language Native:
16.6% (13)Foreign-born:
36.0% (61)
Other race - Speak only English Native:
52.5% (59)Foreign-born:
10.2% (3)
Other race - Speak another language Native:
47.7% (54)Foreign-born:
89.0% (25)
Two or more races - Speak only English Native:
94.0% (806)Foreign-born:
86.9% (104)
White alone - Speak only English Native:
99.4% (11,521)Foreign-born:
86.8% (27)
White alone - Speak another language Native:
0.7% (80)Foreign-born:
17.4% (6)
Hispanic or Latino - Speak only English Native:
84.3% (444)Foreign-born:
38.3% (17)
Hispanic or Latino - Speak another language Native:
18.0% (95)Foreign-born:
67.6% (30)
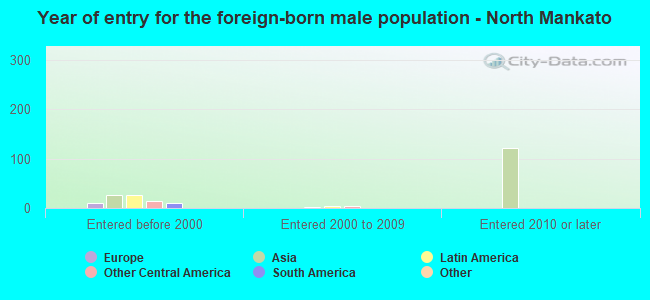
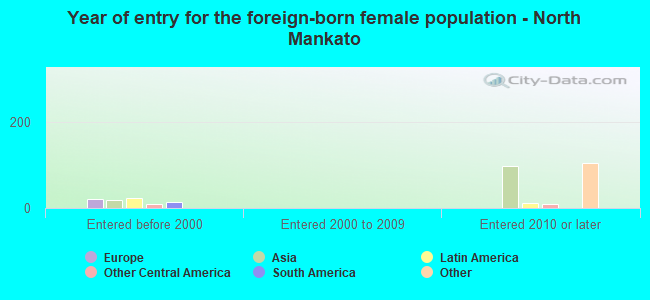
Foreign-born residents in North Mankato 439 residents are foreign born (1.7% Asia , 0.5% Africa , 0.5% Latin America ).
This city:
3.1%Minnesota:
8.5%
Marital status for residents in North Mankato Marital status - White (Caucasian) population 15 years and over
Males 32.9% Never married51.4% Now married2.6% Separated3.1% Widowed10.0% DivorcedFemales 27.7% Never married50.2% Now married0.1% Separated9.1% Widowed12.9% DivorcedWomen who gave birth in the past 12 months Now married:
58.9% (80)Unmarried:
41.1% (56)
Women who did not give birth in the past 12 months Now married:
44.0% (1,262)Unmarried:
56.0% (1,606)
Marital status - Black or African American population 15 years and over
Males 100.0% Never married0.0% Now married0.0% Separated0.0% Widowed0.0% DivorcedFemales 83.7% Never married0.0% Now married0.0% Separated0.0% Widowed16.3% DivorcedWomen who gave birth in the past 12 months Now married:
0.0% (0)Unmarried:
100.0% (18)
Women who did not give birth in the past 12 months Now married:
0.0% (0)Unmarried:
100.0% (134)
Marital status - American Indian / Alaska Native population 15 years and over
Males 100.0% Never married0.0% Now married0.0% Separated0.0% Widowed0.0% DivorcedFemales 100.0% Never married0.0% Now married0.0% Separated0.0% Widowed0.0% DivorcedWomen who did not give birth in the past 12 months Now married:
0.0% (0)Unmarried:
100.0% (3)
Marital status - Asian population 15 years and over
Males 42.7% Never married35.5% Now married0.0% Separated0.0% Widowed21.8% DivorcedFemales 19.8% Never married80.2% Now married0.0% Separated0.0% Widowed0.0% DivorcedWomen who did not give birth in the past 12 months Now married:
78.8% (65)Unmarried:
21.2% (18)
Marital status - Other race population 15 years and over
Males 43.9% Never married21.1% Now married0.0% Separated0.0% Widowed35.1% DivorcedFemales 25.6% Never married20.5% Now married0.0% Separated0.0% Widowed53.8% DivorcedWomen who did not give birth in the past 12 months Now married:
0.0% (0)Unmarried:
100.0% (41)
Marital status - Two or more races population 15 years and over
Males 57.8% Never married42.2% Now married0.0% Separated0.0% Widowed0.0% DivorcedFemales 53.3% Never married18.3% Now married0.0% Separated5.8% Widowed22.5% DivorcedWomen who gave birth in the past 12 months Now married:
0.0% (0)Unmarried:
100.0% (14)
Women who did not give birth in the past 12 months Now married:
29.3% (29)Unmarried:
70.7% (69)
Marital status - White alone, not Hispanic / Latino population 15 years and over
Males 32.8% Never married51.5% Now married2.6% Separated3.1% Widowed10.0% DivorcedFemales 27.4% Never married49.9% Now married0.1% Separated9.4% Widowed13.1% DivorcedWomen who gave birth in the past 12 months Now married:
58.9% (81)Unmarried:
41.1% (57)
Women who did not give birth in the past 12 months Now married:
43.1% (1,186)Unmarried:
56.9% (1,567)
Marital status - Hispanic or Latino population 15 years and over
Males 35.2% Never married46.3% Now married0.0% Separated0.0% Widowed18.5% DivorcedFemales 33.7% Never married48.4% Now married0.0% Separated0.0% Widowed17.9% DivorcedWomen who gave birth in the past 12 months Now married:
0.0% (0)Unmarried:
100.0% (12)
Women who did not give birth in the past 12 months Now married:
52.1% (118)Unmarried:
47.9% (109)
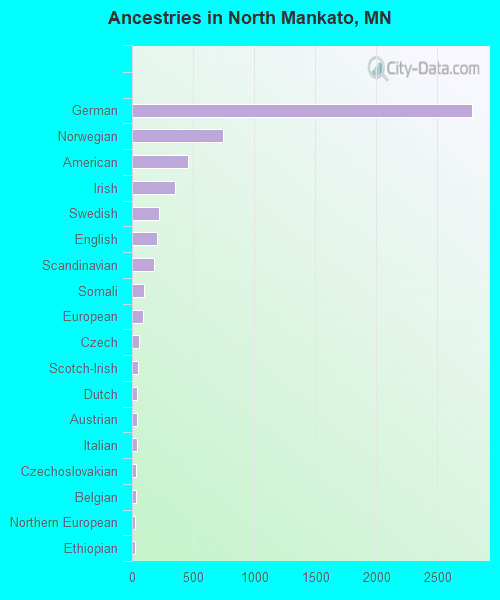
Ancestries in North Mankato
2,786 43.8% German746 11.7% Norwegian458 7.2% American354 5.6% Irish221 3.5% Swedish206 3.2% English180 2.8% Scandinavian95 1.5% Somali91 1.4% European56 0.9% Czech51 0.8% Scotch-Irish42 0.7% Dutch39 0.6% Austrian37 0.6% Italian34 0.5% Czechoslovakian30 0.5% Belgian27 0.4% Northern European26 0.4% Ethiopian24 0.4% Polish18 0.3% Welsh15 0.2% Arab13 0.2% Danish9 0.1% British
Children Nativity (place of birth) in North Mankato
Children under 6 years - Living with two parents Both parents native 676 100.0% NativeBoth parents foreign-born 37 100.0% NativeOne native, one foreign-born parent 127 100.0% NativeChildren under 6 years - Living with one parent Native parent 194 100.0% NativeForeign-born parent 30 100.0% NativeChildren 6 to 17 years - Living with two parents Both parents native 1,213 97.2% Native35 2.8% Foreign-bornBoth parents foreign-born 58 90.2% Native6 9.8% Foreign-bornChildren 6 to 17 years - Living with one parent Native parent 947 96.7% Native32 3.3% Foreign-bornForeign-born parent 30 100.0% Native
Grandparents responsible for own grandchildren in North Mankato
Grandparents (30 to 59 years) White / Caucasian 9 100.0% Responsible for grandchildrenWhite alone, not Hispanic / Latino 9 100.0% Responsible for grandchildrenGrandparents (60 years and over) White / Caucasian 17 18.0% Responsible for grandchildren76 82.0% Not responsible for grandchildrenWhite alone, not Hispanic / Latino 17 18.1% Responsible for grandchildren77 81.9% Not responsible for grandchildren