Races in North Merrick, New York (NY) Detailed Stats
Data:
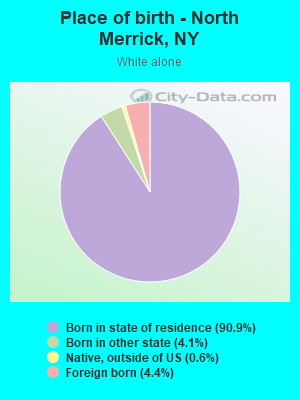
Races - White alone (%)
Races - White alone (% change since 2000)
Races - Black alone (%)
Races - Black alone (% change since 2000)
Races - American Indian alone (%)
Races - American Indian alone (% change since 2000)
Races - Asian alone (%)
Races - Asian alone (% change since 2000)
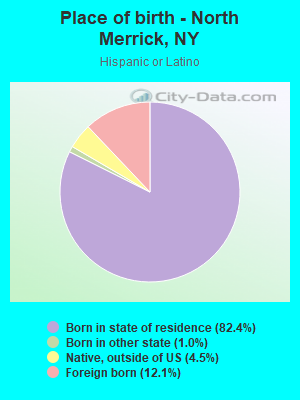
Races - Hispanic (%)
Races - Hispanic (% change since 2000)
Races - Native Hawaiian and Other Pacific Islander alone (%)
Races - Native Hawaiian and Other Pacific Islander alone (% change since 2000)
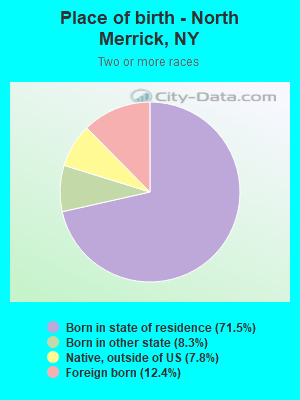
Races - Two or more races(%)
Races - Two or more races(% change since 2000)
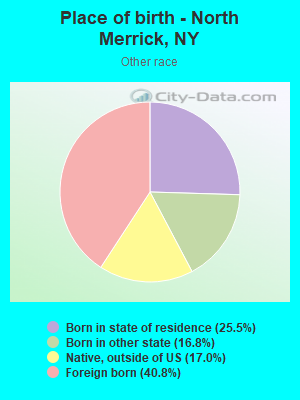
Races - Other race alone (%)
Races - Other race alone (% change since 2000)
Racial diversity
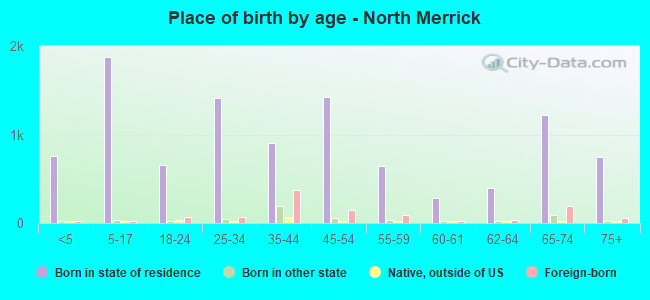
Place of birth - Born in state of residence (%)
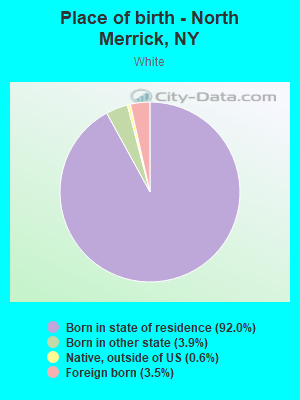
Place of birth - Born in state of residence (%) - White
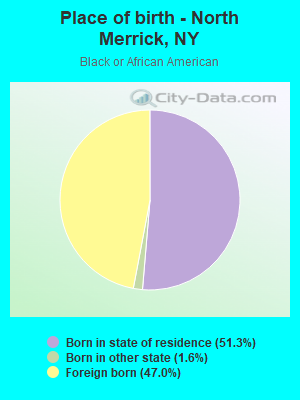
Place of birth - Born in state of residence (%) - Black or African American
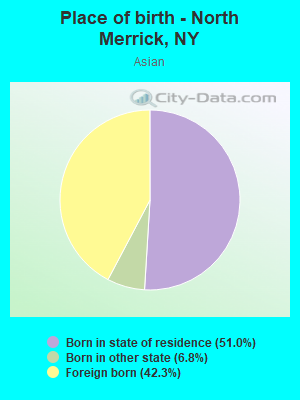
Place of birth - Born in state of residence (%) - Asian
Place of birth - Born in state of residence (%) - Hispanic or Latino
Place of birth - Born in state of residence (%) - American Indian and Alaska Native
Place of birth - Born in state of residence (%) - Multirace
Place of birth - Born in state of residence (%) - Other Race
Place of birth - Born in other state (%)
Place of birth - Born in other state (%) - White
Place of birth - Born in other state (%) - Black or African American
Place of birth - Born in other state (%) - Asian
Place of birth - Born in other state (%) - Hispanic or Latino
Place of birth - Born in other state (%) - American Indian and Alaska Native
Place of birth - Born in other state (%) - Multirace
Place of birth - Born in other state (%) - Other Race
Place of birth - Native, outside of US (%)
Place of birth - Native, outside of US (%) - White
Place of birth - Native, outside of US (%) - Black or African American
Place of birth - Native, outside of US (%) - Asian
Place of birth - Native, outside of US (%) - Hispanic or Latino
Place of birth - Native, outside of US (%) - American Indian and Alaska Native
Place of birth - Native, outside of US (%) - Multirace
Place of birth - Native, outside of US (%) - Other Race
Place of birth - Foreign born (%)
Place of birth - Foreign born (%) - White
Place of birth - Foreign born (%) - Black or African American
Place of birth - Foreign born (%) - Asian
Place of birth - Foreign born (%) - Hispanic or Latino
Place of birth - Foreign born (%) - American Indian and Alaska Native
Place of birth - Foreign born (%) - Multirace
Place of birth - Foreign born (%) - Other Race
Residents speaking English at home (%)
Residents speaking English at home - Born in the United States (%)
Residents speaking English at home - Native, born elsewhere (%)
Residents speaking English at home - Foreign born (%)
Residents speaking Spanish at home (%)
Residents speaking Spanish at home - Born in the United States (%)
Residents speaking Spanish at home - Native, born elsewhere (%)
Residents speaking Spanish at home - Foreign born (%)
Residents speaking other language at home (%)
Residents speaking other language at home - Born in the United States (%)
Residents speaking other language at home - Native, born elsewhere (%)
Residents speaking other language at home - Foreign born (%)
Marital status - Never married (%)
Marital status - Now married (%)
Marital status - Separated (%)
Marital status - Widowed (%)
Marital status - Divorced (%)
Ancestries Reported - Arab (%)
Ancestries Reported - Czech (%)
Ancestries Reported - Danish (%)
Ancestries Reported - Dutch (%)
Ancestries Reported - English (%)
Ancestries Reported - French (%)
Ancestries Reported - French Canadian (%)
Ancestries Reported - German (%)
Ancestries Reported - Greek (%)
Ancestries Reported - Hungarian (%)
Ancestries Reported - Irish (%)
Ancestries Reported - Italian (%)
Ancestries Reported - Lithuanian (%)
Ancestries Reported - Norwegian (%)
Ancestries Reported - Polish (%)
Ancestries Reported - Portuguese (%)
Ancestries Reported - Russian (%)
Ancestries Reported - Scotch-Irish (%)
Ancestries Reported - Scottish (%)
Ancestries Reported - Slovak (%)
Ancestries Reported - Subsaharan African (%)
Ancestries Reported - Swedish (%)
Ancestries Reported - Swiss (%)
Ancestries Reported - Ukrainian (%)
Ancestries Reported - United States (%)
Ancestries Reported - Welsh (%)
Ancestries Reported - West Indian (%)
Ancestries Reported - Other (%)
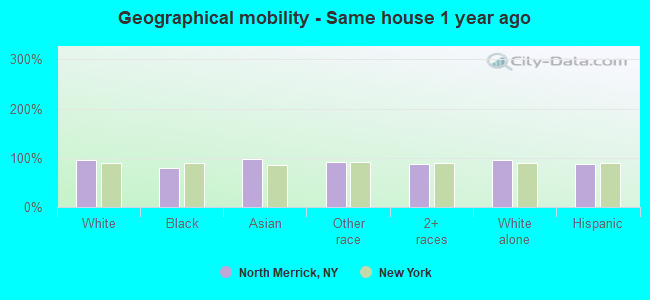
Geographical mobility - Same house 1 year ago (%)
Geographical mobility - Same house 1 year ago (%) - White
Geographical mobility - Same house 1 year ago (%) - Black or African American
Geographical mobility - Same house 1 year ago (%) - Asian
Geographical mobility - Same house 1 year ago (%) - Hispanic or Latino
Geographical mobility - Same house 1 year ago (%) - American Indian and Alaska Native
Geographical mobility - Same house 1 year ago (%) - Multirace
Geographical mobility - Same house 1 year ago (%) - Other Race
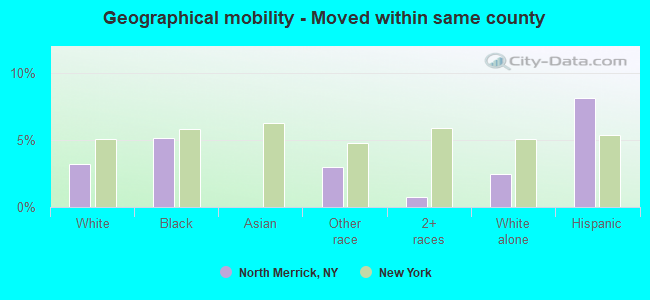
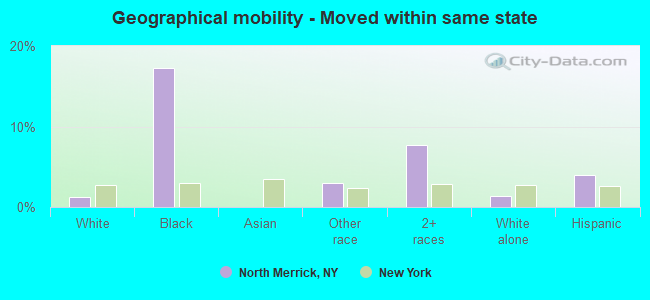
Geographical mobility - Moved within same county (%)
Geographical mobility - Moved within same county (%) - White
Geographical mobility - Moved within same county (%) - Black or African American
Geographical mobility - Moved within same county (%) - Asian
Geographical mobility - Moved within same county (%) - Hispanic or Latino
Geographical mobility - Moved within same county (%) - American Indian and Alaska Native
Geographical mobility - Moved within same county (%) - Multirace
Geographical mobility - Moved within same county (%) - Other Race
Geographical mobility - Moved from different county within same state (%)
Geographical mobility - Moved from different county within same state (%) - White
Geographical mobility - Moved from different county within same state (%) - Black or African American
Geographical mobility - Moved from different county within same state (%) - Asian
Geographical mobility - Moved from different county within same state (%) - Hispanic or Latino
Geographical mobility - Moved from different county within same state (%) - American Indian and Alaska Native
Geographical mobility - Moved from different county within same state (%) - Multirace
Geographical mobility - Moved from different county within same state (%) - Other Race
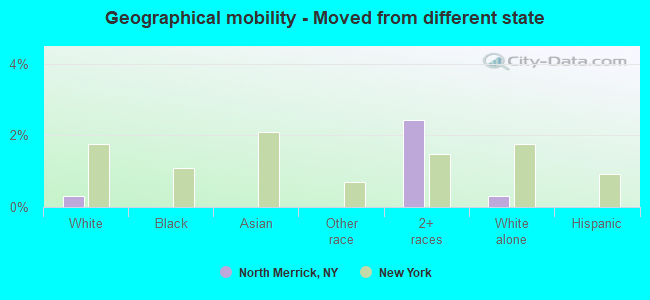
Geographical mobility - Moved from different state (%)
Geographical mobility - Moved from different state (%) - White
Geographical mobility - Moved from different state (%) - Black or African American
Geographical mobility - Moved from different state (%) - Asian
Geographical mobility - Moved from different state (%) - Hispanic or Latino
Geographical mobility - Moved from different state (%) - American Indian and Alaska Native
Geographical mobility - Moved from different state (%) - Multirace
Geographical mobility - Moved from different state (%) - Other Race
Geographical mobility - Moved from abroad (%)
Geographical mobility - Moved from abroad (%) - White
Geographical mobility - Moved from abroad (%) - Black or African American
Geographical mobility - Moved from abroad (%) - Asian
Geographical mobility - Moved from abroad (%) - Hispanic or Latino
Geographical mobility - Moved from abroad (%) - American Indian and Alaska Native
Geographical mobility - Moved from abroad (%) - Multirace
Geographical mobility - Moved from abroad (%) - Other Race
Place of birth for the foreign-born population - Ireland (%)
Place of birth for the foreign-born population - Denmark (%)
Place of birth for the foreign-born population - Norway (%)
Place of birth for the foreign-born population - Sweden (%)
Place of birth for the foreign-born population - United Kingdom (%)
Place of birth for the foreign-born population - England (%)
Place of birth for the foreign-born population - Scotland (%)
Place of birth for the foreign-born population - Other Northern Europe (%)
Place of birth for the foreign-born population - Austria (%)
Place of birth for the foreign-born population - Belgium (%)
Place of birth for the foreign-born population - France (%)
Place of birth for the foreign-born population - Germany (%)
Place of birth for the foreign-born population - Netherlands (%)
Place of birth for the foreign-born population - Switzerland (%)
Place of birth for the foreign-born population - Other Western Europe (%)
Place of birth for the foreign-born population - Greece (%)
Place of birth for the foreign-born population - Italy (%)
Place of birth for the foreign-born population - Portugal (%)
Place of birth for the foreign-born population - Spain (%)
Place of birth for the foreign-born population - Other Southern Europe (%)
Place of birth for the foreign-born population - Albania (%)
Place of birth for the foreign-born population - Belarus (%)
Place of birth for the foreign-born population - Bosnia and Herzegovina (%)
Place of birth for the foreign-born population - Bulgaria (%)
Place of birth for the foreign-born population - Croatia (%)
Place of birth for the foreign-born population - Czechoslovakia (%)
Place of birth for the foreign-born population - Hungary (%)
Place of birth for the foreign-born population - Latvia (%)
Place of birth for the foreign-born population - Lithuania (%)
Place of birth for the foreign-born population - North Macedonia (Macedonia) (%)
Place of birth for the foreign-born population - Moldova (%)
Place of birth for the foreign-born population - Poland (%)
Place of birth for the foreign-born population - Romania (%)
Place of birth for the foreign-born population - Russia (%)
Place of birth for the foreign-born population - Serbia (%)
Place of birth for the foreign-born population - Ukraine (%)
Place of birth for the foreign-born population - Other Eastern Europe (%)
Place of birth for the foreign-born population - China (%)
Place of birth for the foreign-born population - Hong Kong (%)
Place of birth for the foreign-born population - Taiwan (%)
Place of birth for the foreign-born population - Japan (%)
Place of birth for the foreign-born population - Korea (%)
Place of birth for the foreign-born population - Other Eastern Asia (%)
Place of birth for the foreign-born population - Afghanistan (%)
Place of birth for the foreign-born population - Bangladesh (%)
Place of birth for the foreign-born population - India (%)
Place of birth for the foreign-born population - Iran (%)
Place of birth for the foreign-born population - Kazakhstan (%)
Place of birth for the foreign-born population - Nepal (%)
Place of birth for the foreign-born population - Pakistan (%)
Place of birth for the foreign-born population - Sri Lanka (%)
Place of birth for the foreign-born population - Uzbekistan (%)
Place of birth for the foreign-born population - Other South Central Asia (%)
Place of birth for the foreign-born population - Burma (%)
Place of birth for the foreign-born population - Cambodia (%)
Place of birth for the foreign-born population - Indonesia (%)
Place of birth for the foreign-born population - Laos (%)
Place of birth for the foreign-born population - Malaysia (%)
Place of birth for the foreign-born population - Philippines (%)
Place of birth for the foreign-born population - Singapore (%)
Place of birth for the foreign-born population - Thailand (%)
Place of birth for the foreign-born population - Vietnam (%)
Place of birth for the foreign-born population - Other South Eastern Asia (%)
Place of birth for the foreign-born population - Armenia (%)
Place of birth for the foreign-born population - Iraq (%)
Place of birth for the foreign-born population - Israel (%)
Place of birth for the foreign-born population - Jordan (%)
Place of birth for the foreign-born population - Kuwait (%)
Place of birth for the foreign-born population - Lebanon (%)
Place of birth for the foreign-born population - Saudi Arabia (%)
Place of birth for the foreign-born population - Syria (%)
Place of birth for the foreign-born population - Turkey (%)
Place of birth for the foreign-born population - Yemen (%)
Place of birth for the foreign-born population - Other Western Asia (%)
Place of birth for the foreign-born population - Eritrea (%)
Place of birth for the foreign-born population - Ethiopia (%)
Place of birth for the foreign-born population - Kenya (%)
Place of birth for the foreign-born population - Somalia (%)
Place of birth for the foreign-born population - Uganda (%)
Place of birth for the foreign-born population - Zimbabwe (%)
Place of birth for the foreign-born population - Other Eastern Africa (%)
Place of birth for the foreign-born population - Cameroon (%)
Place of birth for the foreign-born population - Congo (%)
Place of birth for the foreign-born population - Democratic Republic of Congo (Zaire) (%)
Place of birth for the foreign-born population - Other Middle Africa (%)
Place of birth for the foreign-born population - Egypt (%)
Place of birth for the foreign-born population - Morocco (%)
Place of birth for the foreign-born population - Sudan (%)
Place of birth for the foreign-born population - Other Northern Africa (%)
Place of birth for the foreign-born population - South Africa (%)
Place of birth for the foreign-born population - Other Southern Africa (%)
Place of birth for the foreign-born population - Cabo Verde (%)
Place of birth for the foreign-born population - Ghana (%)
Place of birth for the foreign-born population - Liberia (%)
Place of birth for the foreign-born population - Nigeria (%)
Place of birth for the foreign-born population - Senegal (%)
Place of birth for the foreign-born population - Sierra Leone (%)
Place of birth for the foreign-born population - Other Western Africa (%)
Place of birth for the foreign-born population - Australia (%)
Place of birth for the foreign-born population - New Zealand (%)
Place of birth for the foreign-born population - Fiji (%)
Place of birth for the foreign-born population - Micronesia (%)
Place of birth for the foreign-born population - Bahamas (%)
Place of birth for the foreign-born population - Barbados (%)
Place of birth for the foreign-born population - Cuba (%)
Place of birth for the foreign-born population - Dominica (%)
Place of birth for the foreign-born population - Dominican Republic (%)
Place of birth for the foreign-born population - Grenada (%)
Place of birth for the foreign-born population - Haiti (%)
Place of birth for the foreign-born population - Jamaica (%)
Place of birth for the foreign-born population - St. Vincent and the Grenadines (%)
Place of birth for the foreign-born population - Trinidad and Tobago (%)
Place of birth for the foreign-born population - West Indies (%)
Place of birth for the foreign-born population - Other Caribbean (%)
Place of birth for the foreign-born population - Belize (%)
Place of birth for the foreign-born population - Costa Rica (%)
Place of birth for the foreign-born population - El Salvador (%)
Place of birth for the foreign-born population - Guatemala (%)
Place of birth for the foreign-born population - Honduras (%)
Place of birth for the foreign-born population - Mexico (%)
Place of birth for the foreign-born population - Nicaragua (%)
Place of birth for the foreign-born population - Panama (%)
Place of birth for the foreign-born population - Other Central America (%)
Place of birth for the foreign-born population - Argentina (%)
Place of birth for the foreign-born population - Bolivia (%)
Place of birth for the foreign-born population - Brazil (%)
Place of birth for the foreign-born population - Chile (%)
Place of birth for the foreign-born population - Colombia (%)
Place of birth for the foreign-born population - Ecuador (%)
Place of birth for the foreign-born population - Guyana (%)
Place of birth for the foreign-born population - Peru (%)
Place of birth for the foreign-born population - Uruguay (%)
Place of birth for the foreign-born population - Venezuela (%)
Place of birth for the foreign-born population - Other South America (%)
Place of birth for the foreign-born population - Canada (%)
Place of birth for the foreign-born population - Other Northern America (%)
Place of birth for the foreign-born population - Other (%)
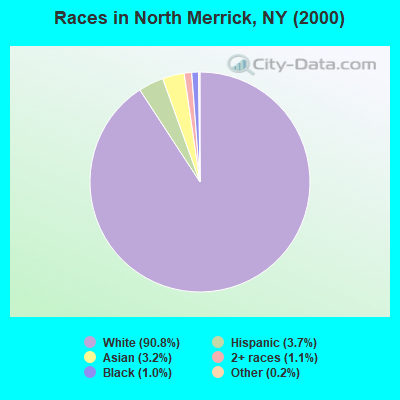
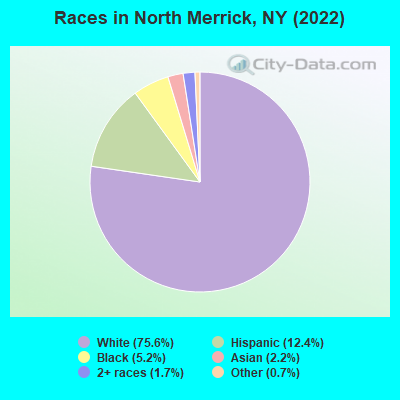
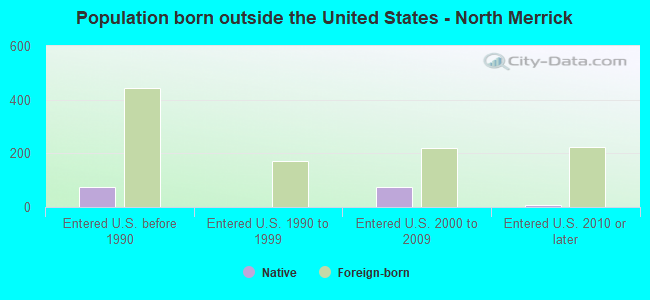
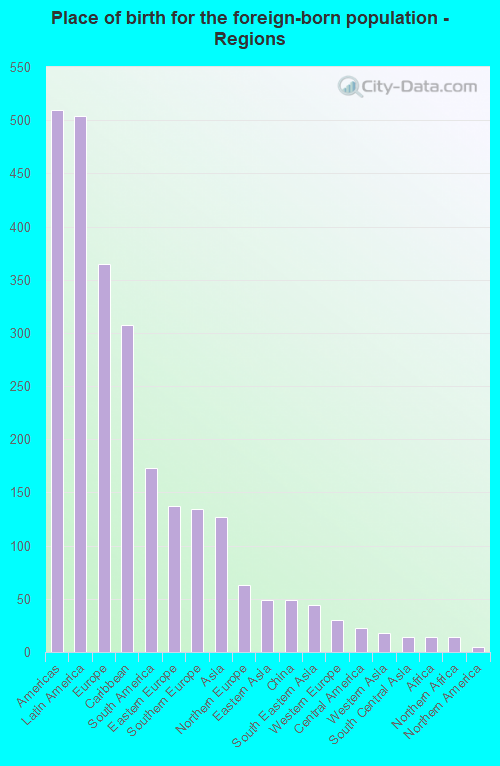
According to 2022 data, the most numerous races in North Merrick, NY are White alone (9,177 residents), Hispanic (1,510 residents), and Black alone (629 residents). 85.8% of North Merrick residents speak English at home. 8.4% of North Merrick, NY residents are foreign-born (4.2% born in Latin America, 3.0% born in Europe, 1.1% born in Asia), which is 162.4% less than the foreign-born rate of 22.0% across the entire state of New York.
Race distribution in North Merrick
2000 2022
11,760,981 62.0% White alone 2,867,583 15.1% Hispanic 2,812,623 14.8% Black alone 1,035,926 5.5% Asian alone 366,116 1.9% Two or more races 75,499 0.4% Other race alone 52,499 0.3% American Indian alone 5,230 0.03% Native Hawaiian and Other
10,408,933 52.9% White alone 3,867,299 19.7% Hispanic 2,633,840 13.4% Black alone 1,776,286 9.0% Asian alone 732,670 3.7% Two or more races 216,110 1.1% Other race alone 35,082 0.2% American Indian alone 6,931 0.04% Native Hawaiian and Other
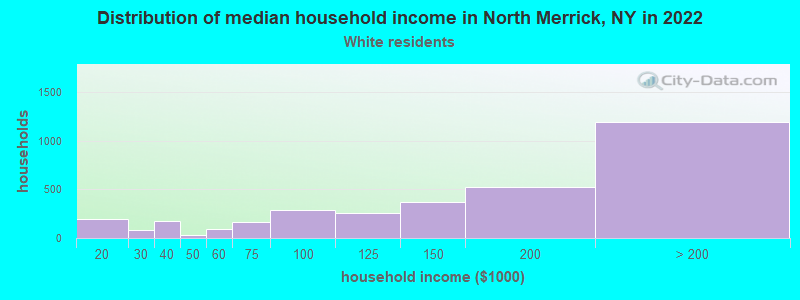
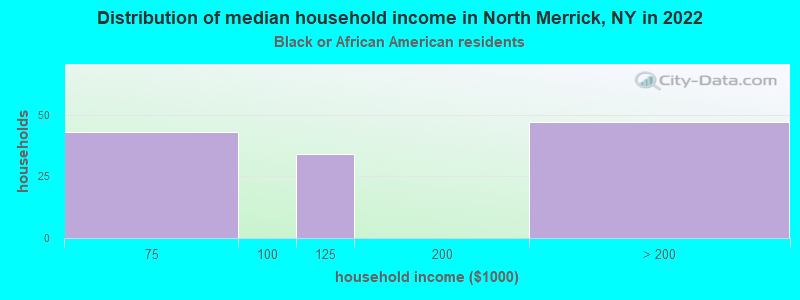
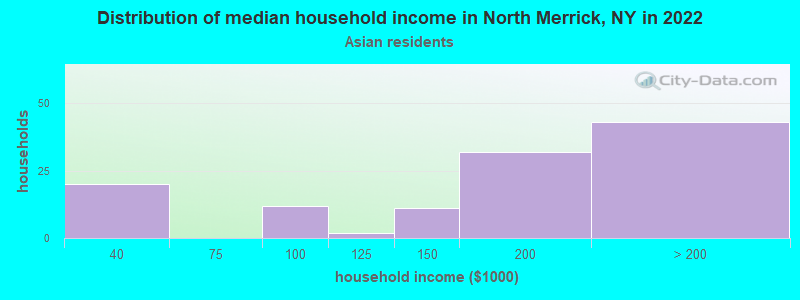
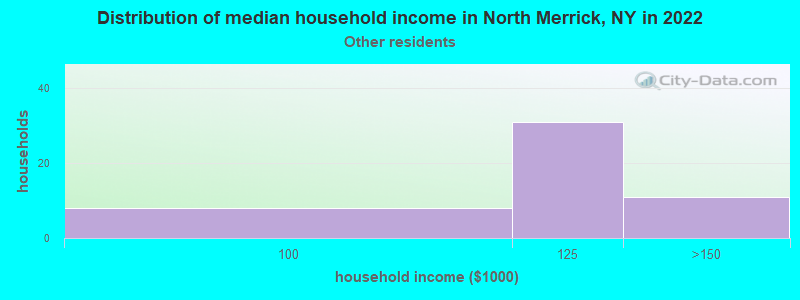
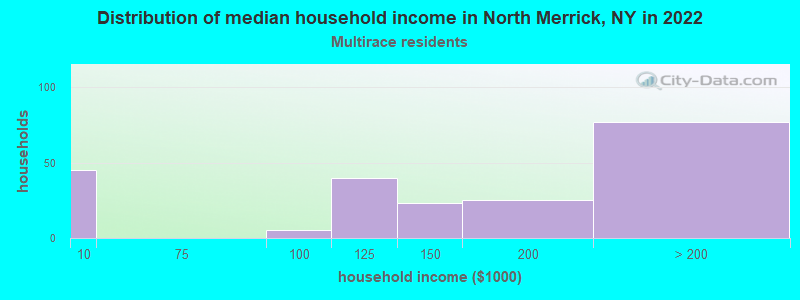
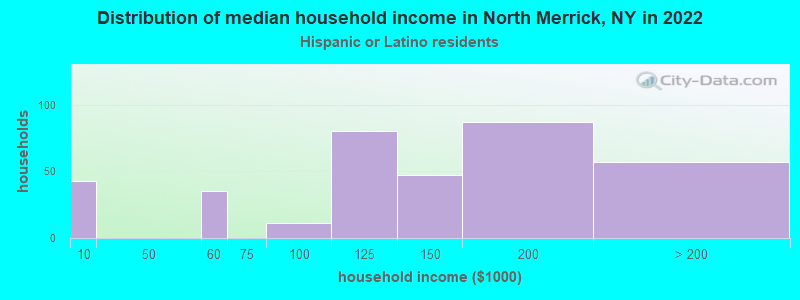
Income and house value in North Merrick Median household income in 2022 $151,687 White non-Hispanic householders$156,881 Asian householders$117,401 Some other race householders$131,602 Two or more races householders$134,548 Hispanic or Latino race householdersMedian 2022 house value $640,604 White Non-Hispanic householders$750,921 Black or African American householders $680,198 Asian householders$546,124 Some other race householders$546,124 Two or more races householders$602,921 Hispanic or Latino householders
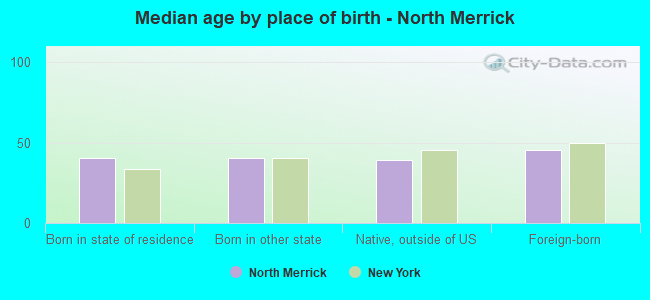
Median age by race in North Merrick
46.1 Median age for White residents43.7 48.8 41.0 Median age for Black or African American residents45.4 25.6 -855,158,729.3 Median age for American Indian / Alaska Native residents-607,543,322.5 -837,121,211.3 35.6 Median age for Asian residents37.2 35.0 -487,992,314.6 Median age for Native Hawaiian / Pacific Islander residents-477,502,295.2 -497,387,669.3 43.4 Median age for Other race residents42.3 59.7 19.3 Median age for Two or more races residents30.2 12.6 47.5 Median age for White alone residents45.4 48.7 29.2 Median age for Hispanic or Latino residents28.7 37.2
Owner/renter occupied households by race in North Merrick
House owners and renters - White residents 3,215 95.2% Owner occupied161 4.8% Renter occupiedHouse owners and renters - Black or African American residents 129 100.0% Owner occupiedHouse owners and renters - Asian residents 103 91.0% Owner occupied10 9.0% Renter occupiedHouse owners and renters - Other race residents 56 100.0% Owner occupiedHouse owners and renters - Two or more races residents 172 77.4% Owner occupied50 22.6% Renter occupiedHouse owners and renters - White alone residents 3,220 96.3% Owner occupied123 3.7% Renter occupiedHouse owners and renters - Hispanic or Latino residents 260 75.4% Owner occupied85 24.6% Renter occupied
Language usage in North Merrick
English speakers - Total 85.8% of residents of North Merrick speak English at home.
4.5% of residents speak Spanish at home 431 83.9% Speak English very well83 16.1% Speak English less than very well9.1% of residents speak other language at home 688 67.1% Speak English very well338 32.9% Speak English less than very well
English speakers - Born in the United States 88.3% of residents of North Merrick speak English at home.
1.9% of residents speak Spanish at home 9 100.0% Speak English very well8.3% of residents speak other language at home 39 100.0% Speak English very well
English speakers - Native, born elsewhere 55.0% of residents of North Merrick speak English at home.
40.9% of residents speak Spanish at home 45 73.8% Speak English very well16 26.2% Speak English less than very well
English speakers - Foreign-born 29.8% of residents of North Merrick speak English at home.
14.4% of residents speak Spanish at home 96 63.6% Speak English very well55 36.4% Speak English less than very well55.6% of residents speak other language at home 321 54.9% Speak English very well264 45.1% Speak English less than very well
White (Caucasian) - Speak only English Native:
96.4% (8,256)Foreign-born:
59.2% (196)
White (Caucasian) - Speak another language Native:
4.2% (360)Foreign-born:
47.3% (156)
Black or African American - Speak only English Native:
99.1% (254)Foreign-born:
27.8% (80)
Asian - Speak only English Native:
50.4% (73)Foreign-born:
7.3% (9)
Asian - Speak another language Native:
49.7% (72)Foreign-born:
93.9% (110)
Other race - Speak only English Native:
51.6% (62)Foreign-born:
4.3% (4)
Other race - Speak another language Native:
50.2% (61)Foreign-born:
96.5% (93)
Two or more races - Speak only English Native:
68.8% (677)Foreign-born:
13.9% (20)
Two or more races - Speak another language Native:
30.5% (300)Foreign-born:
86.8% (126)
White alone - Speak only English Native:
96.0% (7,978)Foreign-born:
45.5% (183)
White alone - Speak another language Native:
4.2% (345)Foreign-born:
54.1% (218)
Hispanic or Latino - Speak only English Native:
68.7% (755)Foreign-born:
24.6% (45)
Hispanic or Latino - Speak another language Native:
30.8% (338)Foreign-born:
75.4% (139)
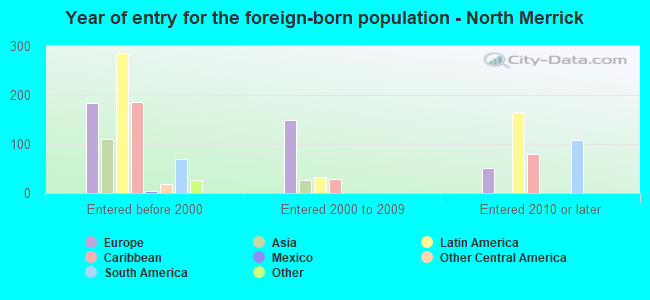
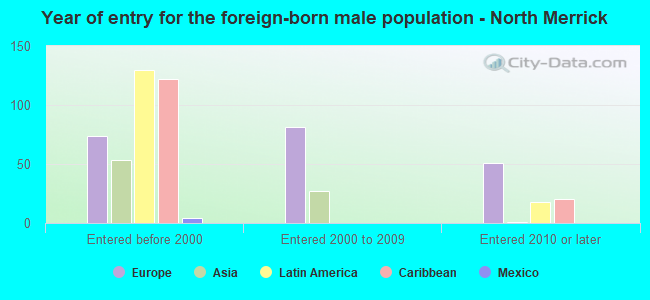
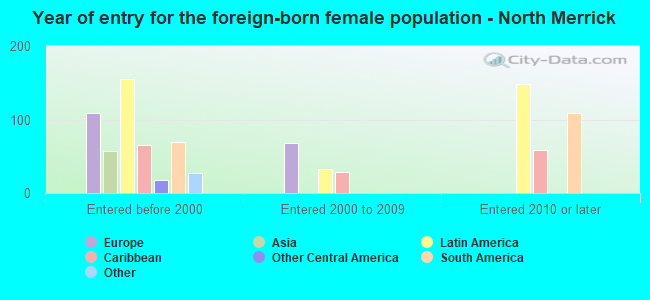
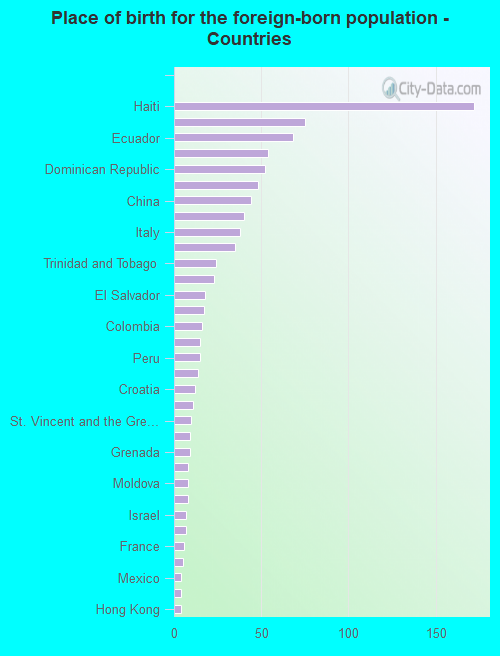
Foreign-born residents in North Merrick 1,018 residents are foreign born (4.2% Latin America , 3.0% Europe , 1.1% Asia ).
This city:
8.4%New York:
22.6%
Marital status for residents in North Merrick Marital status - White (Caucasian) population 15 years and over
Males 36.4% Never married57.8% Now married0.6% Separated2.6% Widowed2.5% DivorcedFemales 21.9% Never married59.8% Now married1.4% Separated10.3% Widowed6.6% DivorcedWomen who gave birth in the past 12 months Now married:
100.0% (132)Unmarried:
0.0% (0)
Women who did not give birth in the past 12 months Now married:
59.1% (930)Unmarried:
40.9% (643)
Marital status - Black or African American population 15 years and over
Males 46.7% Never married53.3% Now married0.0% Separated0.0% Widowed0.0% DivorcedFemales 61.2% Never married38.8% Now married0.0% Separated0.0% Widowed0.0% DivorcedWomen who did not give birth in the past 12 months Now married:
29.1% (52)Unmarried:
70.9% (126)
Marital status - Asian population 15 years and over
Males 16.7% Never married73.3% Now married0.0% Separated0.0% Widowed10.0% DivorcedFemales 4.0% Never married77.4% Now married0.0% Separated9.7% Widowed8.9% DivorcedWomen who did not give birth in the past 12 months Now married:
94.8% (100)Unmarried:
5.2% (6)
Marital status - Other race population 15 years and over
Males 60.4% Never married39.6% Now married0.0% Separated0.0% Widowed0.0% DivorcedFemales 37.5% Never married43.4% Now married0.0% Separated14.7% Widowed4.4% DivorcedWomen who gave birth in the past 12 months Now married:
100.0% (14)Unmarried:
0.0% (0)
Women who did not give birth in the past 12 months Now married:
29.4% (17)Unmarried:
70.6% (41)
Marital status - Two or more races population 15 years and over
Males 54.2% Never married39.5% Now married0.0% Separated0.0% Widowed6.3% DivorcedFemales 24.1% Never married73.6% Now married0.0% Separated2.3% Widowed0.0% DivorcedWomen who gave birth in the past 12 months Now married:
100.0% (39)Unmarried:
0.0% (0)
Women who did not give birth in the past 12 months Now married:
73.3% (145)Unmarried:
26.7% (53)
Marital status - White alone, not Hispanic / Latino population 15 years and over
Males 34.9% Never married58.9% Now married0.7% Separated2.7% Widowed2.7% DivorcedFemales 21.3% Never married60.3% Now married1.2% Separated10.7% Widowed6.6% DivorcedWomen who gave birth in the past 12 months Now married:
100.0% (131)Unmarried:
0.0% (0)
Women who did not give birth in the past 12 months Now married:
60.1% (952)Unmarried:
39.9% (632)
Marital status - Hispanic or Latino population 15 years and over
Males 52.5% Never married43.7% Now married0.0% Separated0.0% Widowed3.7% DivorcedFemales 24.2% Never married63.6% Now married2.1% Separated5.3% Widowed4.8% DivorcedWomen who gave birth in the past 12 months Now married:
100.0% (49)Unmarried:
0.0% (0)
Women who did not give birth in the past 12 months Now married:
67.5% (155)Unmarried:
32.5% (74)
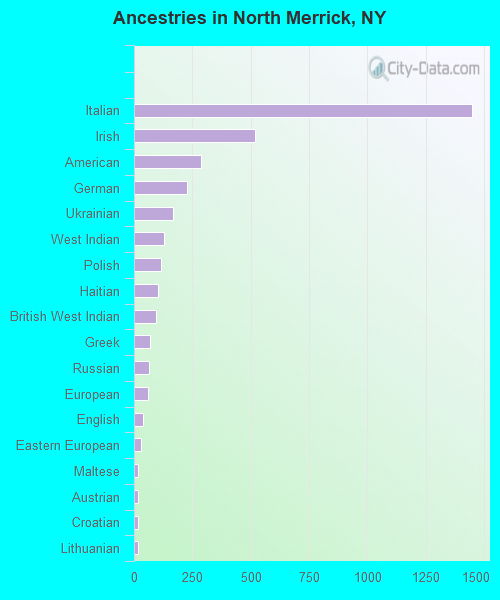
Ancestries in North Merrick
1,448 34.5% Italian520 12.4% Irish287 6.8% American227 5.4% German166 4.0% Ukrainian130 3.1% West Indian117 2.8% Polish104 2.5% Haitian96 2.3% British West Indian69 1.6% Greek64 1.5% Russian60 1.4% European40 1.0% English32 0.8% Eastern European19 0.5% Maltese15 0.4% Austrian15 0.4% Croatian15 0.4% Lithuanian13 0.3% Portuguese13 0.3% Romanian13 0.3% Scottish11 0.3% Israeli10 0.2% Swedish9 0.2% Egyptian8 0.2% Armenian8 0.2% Slovak6 0.1% French4 0.10% Cypriot
Children Nativity (place of birth) in North Merrick
Children under 6 years - Living with two parents Both parents native 555 100.0% NativeBoth parents foreign-born 145 100.0% NativeOne native, one foreign-born parent 52 100.0% NativeChildren under 6 years - Living with one parent Native parent 90 100.0% NativeChildren 6 to 17 years - Living with two parents Both parents native 1,091 100.0% NativeBoth parents foreign-born 81 100.0% NativeOne native, one foreign-born parent 168 100.0% NativeChildren 6 to 17 years - Living with one parent Native parent 281 100.0% NativeForeign-born parent 36 64.1% Native20 35.9% Foreign-born
Grandparents responsible for own grandchildren in North Merrick
Grandparents (30 to 59 years) Other race 16 100.0% Not responsible for grandchildrenHispanic or Latino 5 100.0% Not responsible for grandchildrenGrandparents (60 years and over) Other race 7 67.3% Responsible for grandchildren3 32.7% Not responsible for grandchildrenHispanic or Latino 5 100.0% Not responsible for grandchildren