Races in North Miami, Florida (FL) Detailed Stats
Data:
Races - White alone (%)
Races - White alone (% change since 2000)
Races - Black alone (%)
Races - Black alone (% change since 2000)
Races - American Indian alone (%)
Races - American Indian alone (% change since 2000)
Races - Asian alone (%)
Races - Asian alone (% change since 2000)
Races - Hispanic (%)
Races - Hispanic (% change since 2000)
Races - Native Hawaiian and Other Pacific Islander alone (%)
Races - Native Hawaiian and Other Pacific Islander alone (% change since 2000)
Races - Two or more races(%)
Races - Two or more races(% change since 2000)
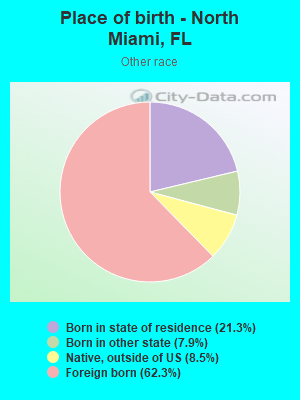
Races - Other race alone (%)
Races - Other race alone (% change since 2000)
Racial diversity
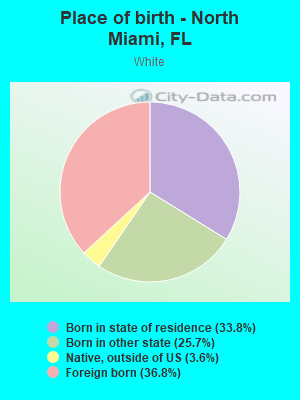
Place of birth - Born in state of residence (%)
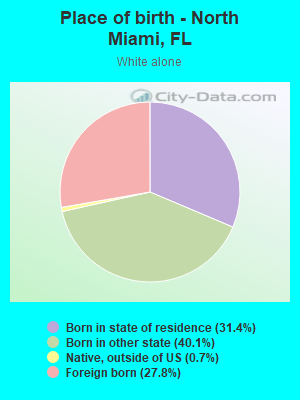
Place of birth - Born in state of residence (%) - White
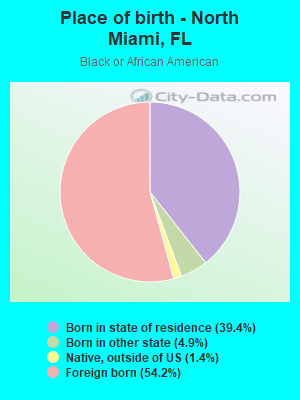
Place of birth - Born in state of residence (%) - Black or African American
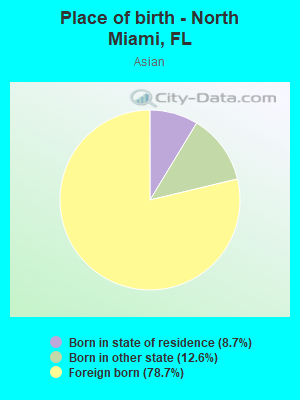
Place of birth - Born in state of residence (%) - Asian
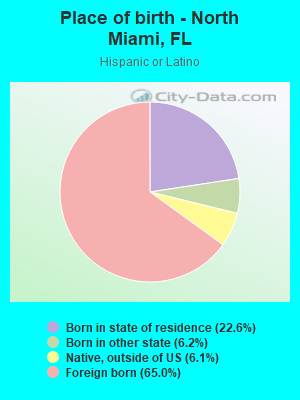
Place of birth - Born in state of residence (%) - Hispanic or Latino
Place of birth - Born in state of residence (%) - American Indian and Alaska Native
Place of birth - Born in state of residence (%) - Multirace
Place of birth - Born in state of residence (%) - Other Race
Place of birth - Born in other state (%)
Place of birth - Born in other state (%) - White
Place of birth - Born in other state (%) - Black or African American
Place of birth - Born in other state (%) - Asian
Place of birth - Born in other state (%) - Hispanic or Latino
Place of birth - Born in other state (%) - American Indian and Alaska Native
Place of birth - Born in other state (%) - Multirace
Place of birth - Born in other state (%) - Other Race
Place of birth - Native, outside of US (%)
Place of birth - Native, outside of US (%) - White
Place of birth - Native, outside of US (%) - Black or African American
Place of birth - Native, outside of US (%) - Asian
Place of birth - Native, outside of US (%) - Hispanic or Latino
Place of birth - Native, outside of US (%) - American Indian and Alaska Native
Place of birth - Native, outside of US (%) - Multirace
Place of birth - Native, outside of US (%) - Other Race
Place of birth - Foreign born (%)
Place of birth - Foreign born (%) - White
Place of birth - Foreign born (%) - Black or African American
Place of birth - Foreign born (%) - Asian
Place of birth - Foreign born (%) - Hispanic or Latino
Place of birth - Foreign born (%) - American Indian and Alaska Native
Place of birth - Foreign born (%) - Multirace
Place of birth - Foreign born (%) - Other Race
Residents speaking English at home (%)
Residents speaking English at home - Born in the United States (%)
Residents speaking English at home - Native, born elsewhere (%)
Residents speaking English at home - Foreign born (%)
Residents speaking Spanish at home (%)
Residents speaking Spanish at home - Born in the United States (%)
Residents speaking Spanish at home - Native, born elsewhere (%)
Residents speaking Spanish at home - Foreign born (%)
Residents speaking other language at home (%)
Residents speaking other language at home - Born in the United States (%)
Residents speaking other language at home - Native, born elsewhere (%)
Residents speaking other language at home - Foreign born (%)
Marital status - Never married (%)
Marital status - Now married (%)
Marital status - Separated (%)
Marital status - Widowed (%)
Marital status - Divorced (%)
Ancestries Reported - Arab (%)
Ancestries Reported - Czech (%)
Ancestries Reported - Danish (%)
Ancestries Reported - Dutch (%)
Ancestries Reported - English (%)
Ancestries Reported - French (%)
Ancestries Reported - French Canadian (%)
Ancestries Reported - German (%)
Ancestries Reported - Greek (%)
Ancestries Reported - Hungarian (%)
Ancestries Reported - Irish (%)
Ancestries Reported - Italian (%)
Ancestries Reported - Lithuanian (%)
Ancestries Reported - Norwegian (%)
Ancestries Reported - Polish (%)
Ancestries Reported - Portuguese (%)
Ancestries Reported - Russian (%)
Ancestries Reported - Scotch-Irish (%)
Ancestries Reported - Scottish (%)
Ancestries Reported - Slovak (%)
Ancestries Reported - Subsaharan African (%)
Ancestries Reported - Swedish (%)
Ancestries Reported - Swiss (%)
Ancestries Reported - Ukrainian (%)
Ancestries Reported - United States (%)
Ancestries Reported - Welsh (%)
Ancestries Reported - West Indian (%)
Ancestries Reported - Other (%)
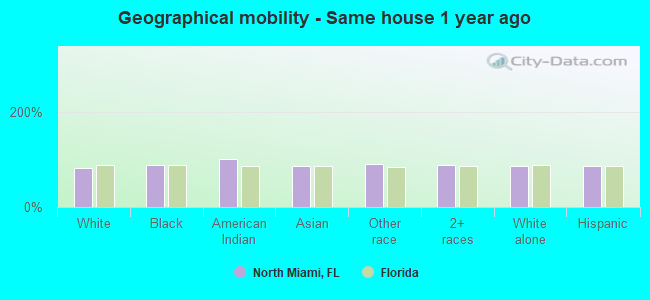
Geographical mobility - Same house 1 year ago (%)
Geographical mobility - Same house 1 year ago (%) - White
Geographical mobility - Same house 1 year ago (%) - Black or African American
Geographical mobility - Same house 1 year ago (%) - Asian
Geographical mobility - Same house 1 year ago (%) - Hispanic or Latino
Geographical mobility - Same house 1 year ago (%) - American Indian and Alaska Native
Geographical mobility - Same house 1 year ago (%) - Multirace
Geographical mobility - Same house 1 year ago (%) - Other Race
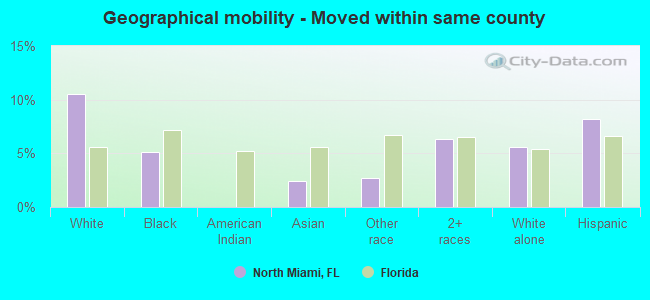
Geographical mobility - Moved within same county (%)
Geographical mobility - Moved within same county (%) - White
Geographical mobility - Moved within same county (%) - Black or African American
Geographical mobility - Moved within same county (%) - Asian
Geographical mobility - Moved within same county (%) - Hispanic or Latino
Geographical mobility - Moved within same county (%) - American Indian and Alaska Native
Geographical mobility - Moved within same county (%) - Multirace
Geographical mobility - Moved within same county (%) - Other Race
Geographical mobility - Moved from different county within same state (%)
Geographical mobility - Moved from different county within same state (%) - White
Geographical mobility - Moved from different county within same state (%) - Black or African American
Geographical mobility - Moved from different county within same state (%) - Asian
Geographical mobility - Moved from different county within same state (%) - Hispanic or Latino
Geographical mobility - Moved from different county within same state (%) - American Indian and Alaska Native
Geographical mobility - Moved from different county within same state (%) - Multirace
Geographical mobility - Moved from different county within same state (%) - Other Race
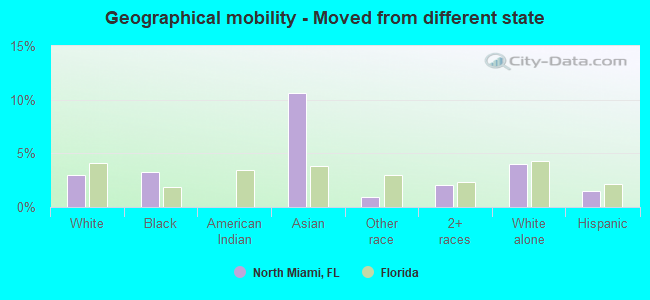
Geographical mobility - Moved from different state (%)
Geographical mobility - Moved from different state (%) - White
Geographical mobility - Moved from different state (%) - Black or African American
Geographical mobility - Moved from different state (%) - Asian
Geographical mobility - Moved from different state (%) - Hispanic or Latino
Geographical mobility - Moved from different state (%) - American Indian and Alaska Native
Geographical mobility - Moved from different state (%) - Multirace
Geographical mobility - Moved from different state (%) - Other Race
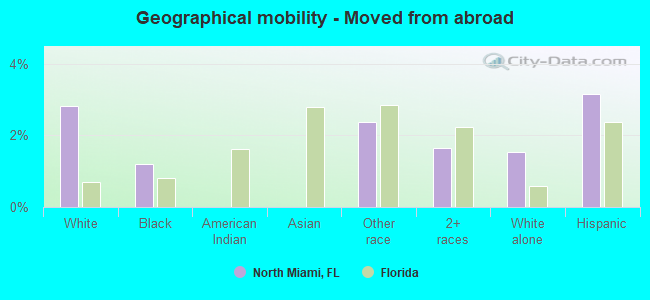
Geographical mobility - Moved from abroad (%)
Geographical mobility - Moved from abroad (%) - White
Geographical mobility - Moved from abroad (%) - Black or African American
Geographical mobility - Moved from abroad (%) - Asian
Geographical mobility - Moved from abroad (%) - Hispanic or Latino
Geographical mobility - Moved from abroad (%) - American Indian and Alaska Native
Geographical mobility - Moved from abroad (%) - Multirace
Geographical mobility - Moved from abroad (%) - Other Race
Place of birth for the foreign-born population - Ireland (%)
Place of birth for the foreign-born population - Denmark (%)
Place of birth for the foreign-born population - Norway (%)
Place of birth for the foreign-born population - Sweden (%)
Place of birth for the foreign-born population - United Kingdom (%)
Place of birth for the foreign-born population - England (%)
Place of birth for the foreign-born population - Scotland (%)
Place of birth for the foreign-born population - Other Northern Europe (%)
Place of birth for the foreign-born population - Austria (%)
Place of birth for the foreign-born population - Belgium (%)
Place of birth for the foreign-born population - France (%)
Place of birth for the foreign-born population - Germany (%)
Place of birth for the foreign-born population - Netherlands (%)
Place of birth for the foreign-born population - Switzerland (%)
Place of birth for the foreign-born population - Other Western Europe (%)
Place of birth for the foreign-born population - Greece (%)
Place of birth for the foreign-born population - Italy (%)
Place of birth for the foreign-born population - Portugal (%)
Place of birth for the foreign-born population - Spain (%)
Place of birth for the foreign-born population - Other Southern Europe (%)
Place of birth for the foreign-born population - Albania (%)
Place of birth for the foreign-born population - Belarus (%)
Place of birth for the foreign-born population - Bosnia and Herzegovina (%)
Place of birth for the foreign-born population - Bulgaria (%)
Place of birth for the foreign-born population - Croatia (%)
Place of birth for the foreign-born population - Czechoslovakia (%)
Place of birth for the foreign-born population - Hungary (%)
Place of birth for the foreign-born population - Latvia (%)
Place of birth for the foreign-born population - Lithuania (%)
Place of birth for the foreign-born population - North Macedonia (Macedonia) (%)
Place of birth for the foreign-born population - Moldova (%)
Place of birth for the foreign-born population - Poland (%)
Place of birth for the foreign-born population - Romania (%)
Place of birth for the foreign-born population - Russia (%)
Place of birth for the foreign-born population - Serbia (%)
Place of birth for the foreign-born population - Ukraine (%)
Place of birth for the foreign-born population - Other Eastern Europe (%)
Place of birth for the foreign-born population - China (%)
Place of birth for the foreign-born population - Hong Kong (%)
Place of birth for the foreign-born population - Taiwan (%)
Place of birth for the foreign-born population - Japan (%)
Place of birth for the foreign-born population - Korea (%)
Place of birth for the foreign-born population - Other Eastern Asia (%)
Place of birth for the foreign-born population - Afghanistan (%)
Place of birth for the foreign-born population - Bangladesh (%)
Place of birth for the foreign-born population - India (%)
Place of birth for the foreign-born population - Iran (%)
Place of birth for the foreign-born population - Kazakhstan (%)
Place of birth for the foreign-born population - Nepal (%)
Place of birth for the foreign-born population - Pakistan (%)
Place of birth for the foreign-born population - Sri Lanka (%)
Place of birth for the foreign-born population - Uzbekistan (%)
Place of birth for the foreign-born population - Other South Central Asia (%)
Place of birth for the foreign-born population - Burma (%)
Place of birth for the foreign-born population - Cambodia (%)
Place of birth for the foreign-born population - Indonesia (%)
Place of birth for the foreign-born population - Laos (%)
Place of birth for the foreign-born population - Malaysia (%)
Place of birth for the foreign-born population - Philippines (%)
Place of birth for the foreign-born population - Singapore (%)
Place of birth for the foreign-born population - Thailand (%)
Place of birth for the foreign-born population - Vietnam (%)
Place of birth for the foreign-born population - Other South Eastern Asia (%)
Place of birth for the foreign-born population - Armenia (%)
Place of birth for the foreign-born population - Iraq (%)
Place of birth for the foreign-born population - Israel (%)
Place of birth for the foreign-born population - Jordan (%)
Place of birth for the foreign-born population - Kuwait (%)
Place of birth for the foreign-born population - Lebanon (%)
Place of birth for the foreign-born population - Saudi Arabia (%)
Place of birth for the foreign-born population - Syria (%)
Place of birth for the foreign-born population - Turkey (%)
Place of birth for the foreign-born population - Yemen (%)
Place of birth for the foreign-born population - Other Western Asia (%)
Place of birth for the foreign-born population - Eritrea (%)
Place of birth for the foreign-born population - Ethiopia (%)
Place of birth for the foreign-born population - Kenya (%)
Place of birth for the foreign-born population - Somalia (%)
Place of birth for the foreign-born population - Uganda (%)
Place of birth for the foreign-born population - Zimbabwe (%)
Place of birth for the foreign-born population - Other Eastern Africa (%)
Place of birth for the foreign-born population - Cameroon (%)
Place of birth for the foreign-born population - Congo (%)
Place of birth for the foreign-born population - Democratic Republic of Congo (Zaire) (%)
Place of birth for the foreign-born population - Other Middle Africa (%)
Place of birth for the foreign-born population - Egypt (%)
Place of birth for the foreign-born population - Morocco (%)
Place of birth for the foreign-born population - Sudan (%)
Place of birth for the foreign-born population - Other Northern Africa (%)
Place of birth for the foreign-born population - South Africa (%)
Place of birth for the foreign-born population - Other Southern Africa (%)
Place of birth for the foreign-born population - Cabo Verde (%)
Place of birth for the foreign-born population - Ghana (%)
Place of birth for the foreign-born population - Liberia (%)
Place of birth for the foreign-born population - Nigeria (%)
Place of birth for the foreign-born population - Senegal (%)
Place of birth for the foreign-born population - Sierra Leone (%)
Place of birth for the foreign-born population - Other Western Africa (%)
Place of birth for the foreign-born population - Australia (%)
Place of birth for the foreign-born population - New Zealand (%)
Place of birth for the foreign-born population - Fiji (%)
Place of birth for the foreign-born population - Micronesia (%)
Place of birth for the foreign-born population - Bahamas (%)
Place of birth for the foreign-born population - Barbados (%)
Place of birth for the foreign-born population - Cuba (%)
Place of birth for the foreign-born population - Dominica (%)
Place of birth for the foreign-born population - Dominican Republic (%)
Place of birth for the foreign-born population - Grenada (%)
Place of birth for the foreign-born population - Haiti (%)
Place of birth for the foreign-born population - Jamaica (%)
Place of birth for the foreign-born population - St. Vincent and the Grenadines (%)
Place of birth for the foreign-born population - Trinidad and Tobago (%)
Place of birth for the foreign-born population - West Indies (%)
Place of birth for the foreign-born population - Other Caribbean (%)
Place of birth for the foreign-born population - Belize (%)
Place of birth for the foreign-born population - Costa Rica (%)
Place of birth for the foreign-born population - El Salvador (%)
Place of birth for the foreign-born population - Guatemala (%)
Place of birth for the foreign-born population - Honduras (%)
Place of birth for the foreign-born population - Mexico (%)
Place of birth for the foreign-born population - Nicaragua (%)
Place of birth for the foreign-born population - Panama (%)
Place of birth for the foreign-born population - Other Central America (%)
Place of birth for the foreign-born population - Argentina (%)
Place of birth for the foreign-born population - Bolivia (%)
Place of birth for the foreign-born population - Brazil (%)
Place of birth for the foreign-born population - Chile (%)
Place of birth for the foreign-born population - Colombia (%)
Place of birth for the foreign-born population - Ecuador (%)
Place of birth for the foreign-born population - Guyana (%)
Place of birth for the foreign-born population - Peru (%)
Place of birth for the foreign-born population - Uruguay (%)
Place of birth for the foreign-born population - Venezuela (%)
Place of birth for the foreign-born population - Other South America (%)
Place of birth for the foreign-born population - Canada (%)
Place of birth for the foreign-born population - Other Northern America (%)
Place of birth for the foreign-born population - Other (%)
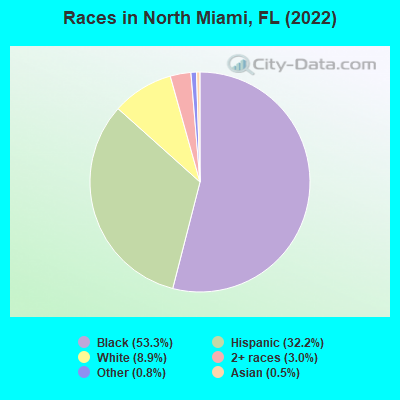
According to 2022 data, the most numerous races in North Miami, FL are White alone (5,321 residents), Hispanic (19,198 residents), and Black alone (31,703 residents). 23.7% of North Miami residents speak English at home. 55.1% of North Miami, FL residents are foreign-born (51.6% born in Latin America), which is 61.9% greater than the foreign-born rate of 21.0% across the entire state of Florida.
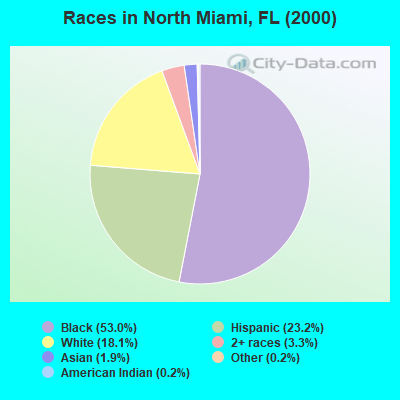
Race distribution in North Miami
2000 2022
10,458,509 65.4% White alone 2,682,715 16.8% Hispanic 2,264,268 14.2% Black alone 261,693 1.6% Asian alone 236,954 1.5% Two or more races 42,358 0.3% American Indian alone 28,994 0.2% Other race alone 6,887 0.04% Native Hawaiian and Other
11,309,403 50.8% White alone 6,025,039 27.1% Hispanic 3,241,015 14.6% Black alone 861,630 3.9% Two or more races 623,692 2.8% Asian alone 152,054 0.7% Other race alone 22,504 0.1% American Indian alone 9,486 0.04% Native Hawaiian and Other
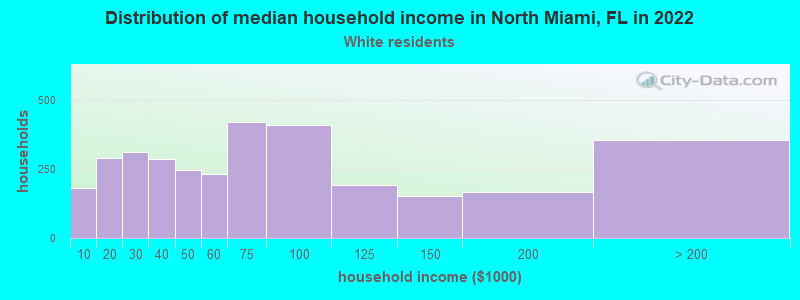
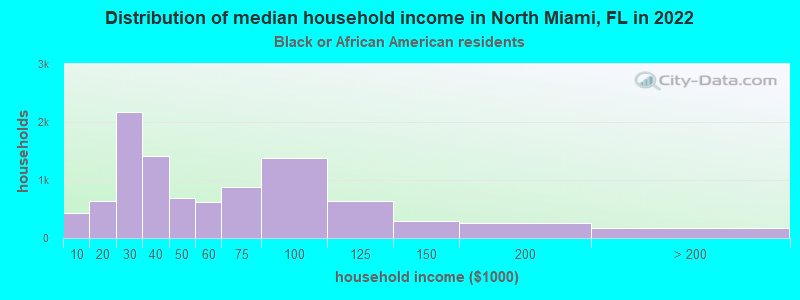
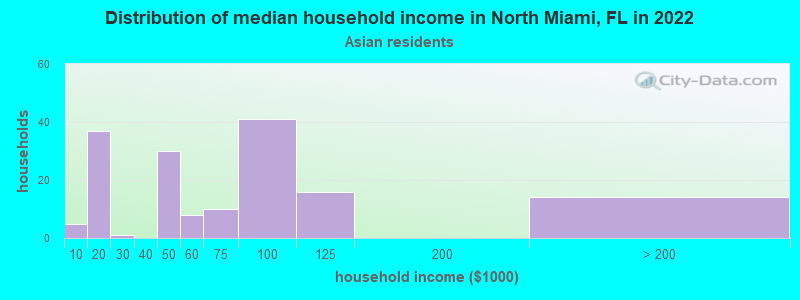
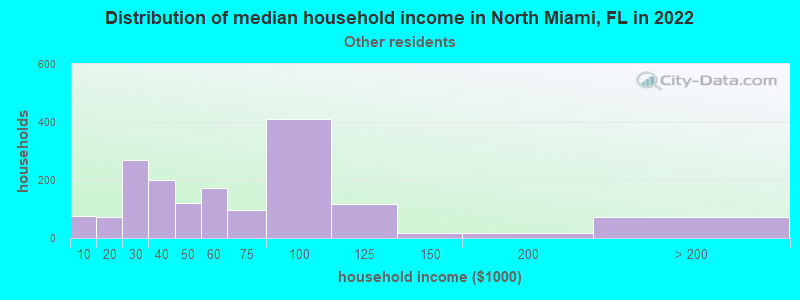
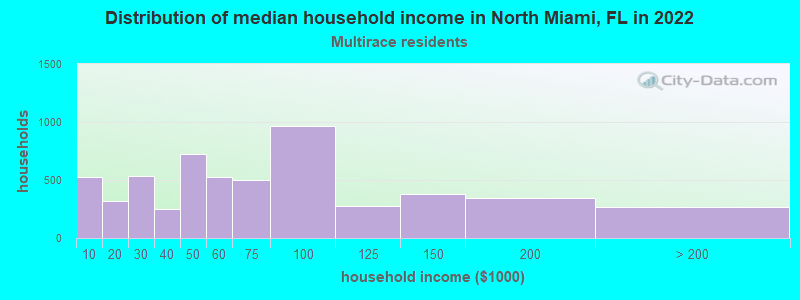
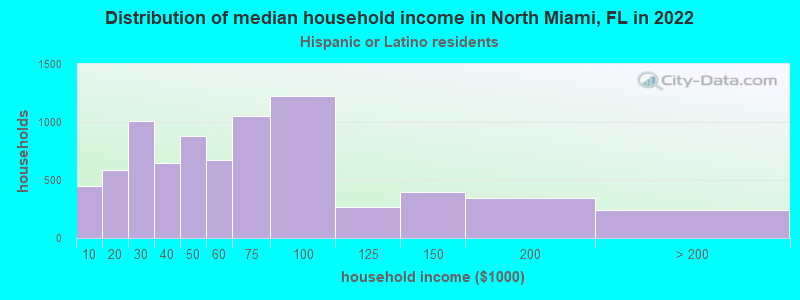
Income and house value in North Miami Median household income in 2022 $74,715 White non-Hispanic householders$43,801 Black householders$51,215 Some other race householders$55,911 Two or more races householders$54,247 Hispanic or Latino race householdersMedian 2022 house value $444,185 White Non-Hispanic householders$361,237 Black or African American householders$933,163 American Indian or Alaska Native householders $482,756 Asian householders$354,602 Some other race householders$362,482 Two or more races householders$374,924 Hispanic or Latino householders
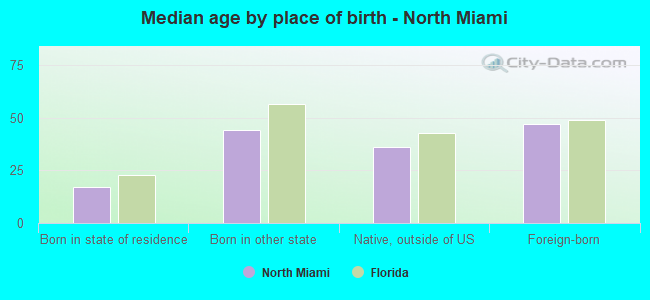
Median age by race in North Miami
38.1 Median age for White residents37.9 38.5 33.8 Median age for Black or African American residents33.7 33.8 -653,446,647.1 Median age for American Indian / Alaska Native residents-543,352,600.6 -762,696,213.5 47.8 Median age for Asian residents49.8 44.4 -679,849,340.2 Median age for Native Hawaiian / Pacific Islander residents-858,307,848.3 -443,298,968.6 41.2 Median age for Other race residents41.4 41.1 42.3 Median age for Two or more races residents42.1 42.9 42.0 Median age for White alone residents42.1 41.6 42.0 Median age for Hispanic or Latino residents41.4 42.7
Owner/renter occupied households by race in North Miami
House owners and renters - White residents 1,893 55.4% Owner occupied1,522 44.6% Renter occupiedHouse owners and renters - Black or African American residents 3,136 32.7% Owner occupied6,447 67.3% Renter occupiedHouse owners and renters - Asian residents 108 80.2% Owner occupied27 19.8% Renter occupiedHouse owners and renters - Other race residents 694 41.2% Owner occupied989 58.8% Renter occupiedHouse owners and renters - Two or more races residents 2,790 49.2% Owner occupied2,881 50.8% Renter occupiedHouse owners and renters - White alone residents 1,313 57.0% Owner occupied992 43.0% Renter occupiedHouse owners and renters - Hispanic or Latino residents 3,766 47.8% Owner occupied4,118 52.2% Renter occupied
Language usage in North Miami
English speakers - Total 23.7% of residents of North Miami speak English at home.
31.1% of residents speak Spanish at home 9,451 54.8% Speak English very well7,811 45.2% Speak English less than very well45.5% of residents speak other language at home 16,360 64.9% Speak English very well8,839 35.1% Speak English less than very well
English speakers - Born in the United States 72.8% of residents of North Miami speak English at home.
19.6% of residents speak Spanish at home 960 92.8% Speak English very well74 7.2% Speak English less than very well8.3% of residents speak other language at home 348 79.8% Speak English very well88 20.2% Speak English less than very well
English speakers - Native, born elsewhere 30.8% of residents of North Miami speak English at home.
55.2% of residents speak Spanish at home 571 55.0% Speak English very well467 45.0% Speak English less than very well15.8% of residents speak other language at home 289 97.3% Speak English very well8 2.7% Speak English less than very well
English speakers - Foreign-born 8.4% of residents of North Miami speak English at home.
36.9% of residents speak Spanish at home 4,862 40.4% Speak English very well7,161 59.6% Speak English less than very well54.1% of residents speak other language at home 9,740 55.3% Speak English very well7,872 44.7% Speak English less than very well
White (Caucasian) - Speak only English Native:
63.3% (3,023)Foreign-born:
12.1% (382)
White (Caucasian) - Speak another language Native:
39.6% (1,890)Foreign-born:
88.8% (2,801)
Black or African American - Speak only English Native:
49.0% (5,886)Foreign-born:
10.0% (1,671)
Black or African American - Speak another language Native:
50.9% (6,113)Foreign-born:
88.1% (14,711)
Asian - Speak only English Native:
58.3% (42)Foreign-born:
23.5% (63)
Asian - Speak another language Native:
41.8% (30)Foreign-born:
75.6% (204)
Other race - Speak only English Native:
21.8% (293)Foreign-born:
2.8% (68)
Other race - Speak another language Native:
78.2% (1,049)Foreign-born:
97.3% (2,365)
Two or more races - Speak only English Native:
24.9% (1,055)Foreign-born:
5.1% (414)
Two or more races - Speak another language Native:
75.0% (3,177)Foreign-born:
95.0% (7,678)
White alone - Speak only English Native:
79.6% (2,727)Foreign-born:
34.0% (504)
White alone - Speak another language Native:
20.6% (708)Foreign-born:
67.9% (1,005)
Hispanic or Latino - Speak only English Native:
17.7% (1,033)Foreign-born:
3.6% (442)
Hispanic or Latino - Speak another language Native:
82.3% (4,803)Foreign-born:
96.4% (11,935)
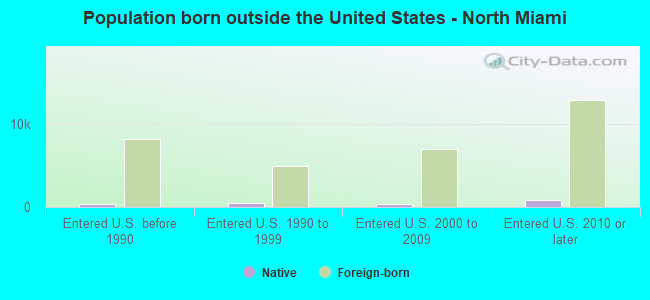
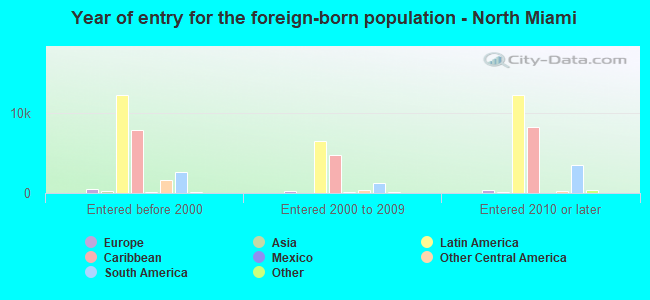
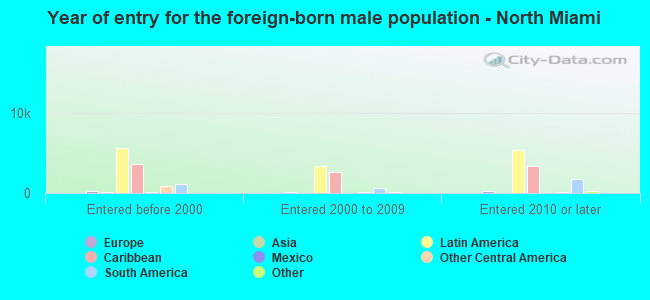
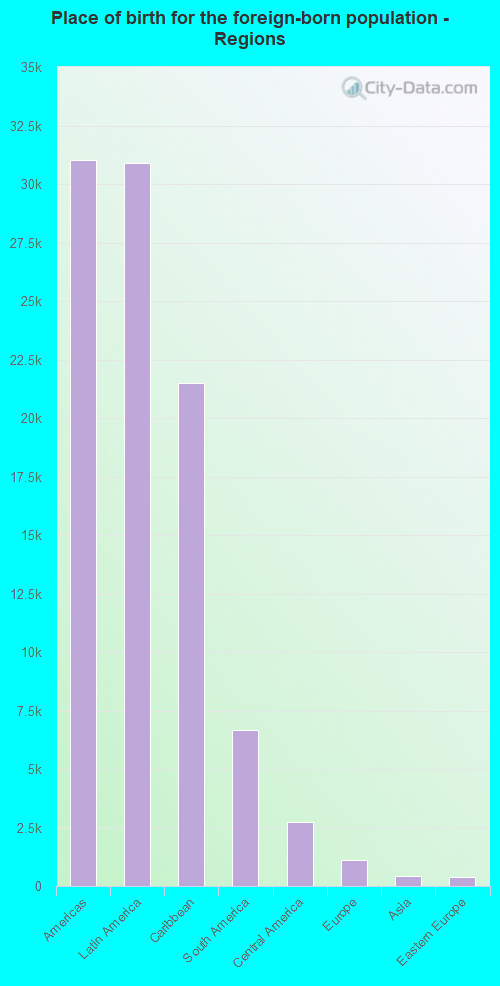
Foreign-born residents in North Miami 32,800 residents are foreign born (51.6% Latin America ).
This city:
55.1%Florida:
21.1%
Marital status for residents in North Miami Marital status - White (Caucasian) population 15 years and over
Males 42.3% Never married42.2% Now married2.0% Separated3.2% Widowed10.2% DivorcedFemales 33.3% Never married36.1% Now married2.4% Separated9.5% Widowed18.7% DivorcedWomen who gave birth in the past 12 months Now married:
50.2% (57)Unmarried:
49.8% (56)
Women who did not give birth in the past 12 months Now married:
37.1% (615)Unmarried:
62.9% (1,042)
Marital status - Black or African American population 15 years and over
Males 46.2% Never married41.7% Now married2.0% Separated2.8% Widowed7.3% DivorcedFemales 46.4% Never married34.3% Now married4.5% Separated6.2% Widowed8.6% DivorcedWomen who gave birth in the past 12 months Now married:
63.3% (272)Unmarried:
36.7% (158)
Women who did not give birth in the past 12 months Now married:
31.6% (2,561)Unmarried:
68.4% (5,554)
Marital status - Asian population 15 years and over
Males 31.6% Never married68.4% Now married0.0% Separated0.0% Widowed0.0% DivorcedFemales 41.1% Never married54.5% Now married0.0% Separated0.0% Widowed4.3% DivorcedWomen who did not give birth in the past 12 months Now married:
16.1% (19)Unmarried:
83.9% (98)
Marital status - Other race population 15 years and over
Males 45.8% Never married43.8% Now married3.7% Separated0.6% Widowed6.2% DivorcedFemales 32.5% Never married50.2% Now married4.8% Separated1.5% Widowed11.1% DivorcedWomen who gave birth in the past 12 months Now married:
0.0% (0)Unmarried:
100.0% (7)
Women who did not give birth in the past 12 months Now married:
42.7% (413)Unmarried:
57.3% (555)
Marital status - Two or more races population 15 years and over
Males 38.2% Never married44.1% Now married1.8% Separated2.9% Widowed12.9% DivorcedFemales 40.3% Never married36.4% Now married1.9% Separated6.5% Widowed14.9% DivorcedWomen who gave birth in the past 12 months Now married:
100.0% (41)Unmarried:
0.0% (0)
Women who did not give birth in the past 12 months Now married:
35.5% (1,275)Unmarried:
64.5% (2,318)
Marital status - White alone, not Hispanic / Latino population 15 years and over
Males 37.9% Never married42.1% Now married0.5% Separated6.8% Widowed12.6% DivorcedFemales 32.5% Never married36.1% Now married1.2% Separated14.0% Widowed16.2% DivorcedWomen who gave birth in the past 12 months Now married:
89.7% (84)Unmarried:
10.3% (10)
Women who did not give birth in the past 12 months Now married:
36.5% (314)Unmarried:
63.5% (547)
Marital status - Hispanic or Latino population 15 years and over
Males 42.1% Never married42.9% Now married2.7% Separated1.8% Widowed10.4% DivorcedFemales 36.9% Never married36.5% Now married3.0% Separated6.8% Widowed16.9% DivorcedWomen who gave birth in the past 12 months Now married:
14.8% (17)Unmarried:
85.2% (95)
Women who did not give birth in the past 12 months Now married:
36.1% (1,667)Unmarried:
63.9% (2,957)
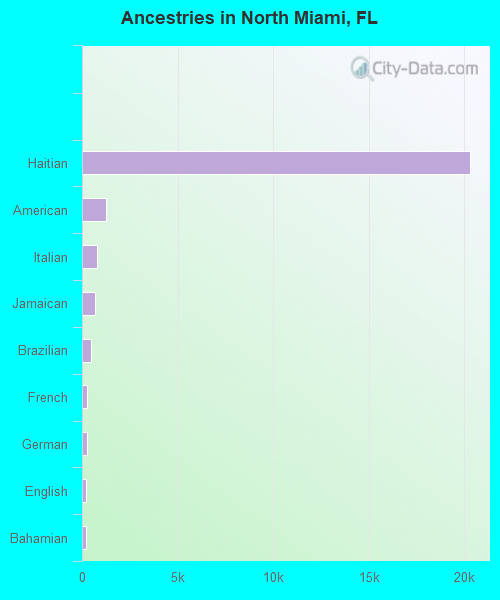
Ancestries in North Miami
20,286 46.1% Haitian1,232 2.8% American797 1.8% Italian674 1.5% Jamaican460 1.0% Brazilian247 0.6% French246 0.6% German229 0.5% English185 0.4% Bahamian171 0.4% Russian169 0.4% European145 0.3% Nigerian142 0.3% Polish98 0.2% African92 0.2% Guyanese84 0.2% Irish71 0.2% British50 0.1% Egyptian49 0.1% Turkish47 0.1% Bulgarian46 0.1% Norwegian41 0.09% Eastern European33 0.08% Israeli29 0.07% Barbadian26 0.06% Serbian26 0.06% Portuguese25 0.06% British West Indian22 0.05% Hungarian20 0.05% Dutch West Indian17 0.04% Moroccan16 0.04% Dutch13 0.03% West Indian13 0.03% French Canadian12 0.03% Estonian9 0.02% South African9 0.02% Slovak8 0.02% Lebanese7 0.02% Greek7 0.02% Ukrainian7 0.02% Czech7 0.02% Canadian7 0.02% Arab7 0.02% Afghan3 0.01% Finnish
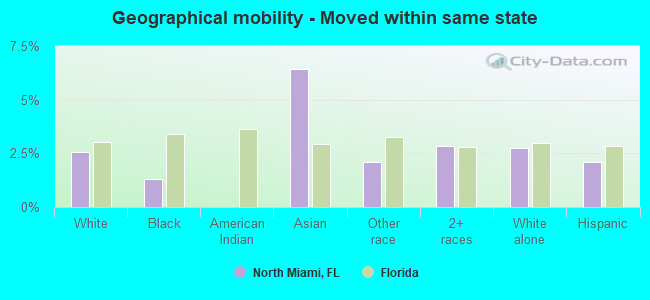
Geographical mobility in North Miami Same house 1 year ago 6,782 81.5% White (Caucasian)27,518 89.2% Black or African American19 100.0% American Indian / Alaska Native293 85.1% Asian3,582 90.6% Other race11,292 86.6% Two or more races4,386 85.5% White alone, not Hispanic / Latino16,184 84.9% Hispanic or LatinoMoved within same county 879 10.6% White / Caucasian1,584 5.1% Black or African American8 2.4% Asian108 2.7% Other race829 6.4% Two or more races286 5.6% White alone, not Hispanic / Latino1,570 8.2% Hispanic or LatinoMoved within same state 214 2.6% White / Caucasian407 1.3% Black or African American22 6.4% Asian83 2.1% Other race369 2.8% Two or more races141 2.7% White alone, not Hispanic / Latino402 2.1% Hispanic or LatinoMoved from different state 250 3.0% White / Caucasian999 3.2% Black or African American37 10.6% Asian37 0.9% Other race268 2.1% Two or more races206 4.0% White alone, not Hispanic / Latino282 1.5% Hispanic or LatinoMoved from abroad 236 2.8% White373 1.2% Black or African American94 2.4% Other race214 1.6% Two or more races79 1.5% White alone, not Hispanic / Latino605 3.2% Hispanic or Latino
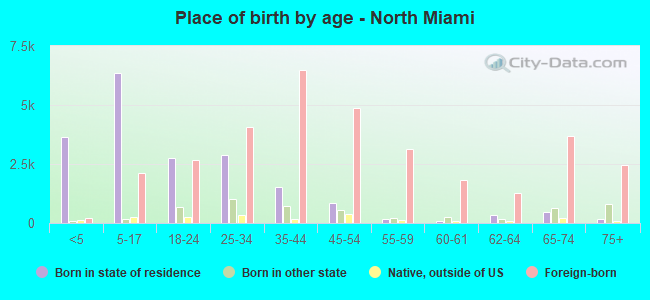
Children Nativity (place of birth) in North Miami
Children under 6 years - Living with two parents Both parents native 378 100.0% NativeBoth parents foreign-born 1,761 94.1% Native111 5.9% Foreign-bornOne native, one foreign-born parent 392 100.0% NativeChildren under 6 years - Living with one parent Native parent 782 99.4% Native5 0.6% Foreign-bornForeign-born parent 1,029 91.2% Native100 8.8% Foreign-bornChildren 6 to 17 years - Living with two parents Both parents native 620 97.7% Native14 2.3% Foreign-bornBoth parents foreign-born 2,252 78.8% Native605 21.2% Foreign-bornOne native, one foreign-born parent 346 100.0% NativeChildren 6 to 17 years - Living with one parent Foreign-born parent 2,908 65.0% Native1,563 35.0% Foreign-born
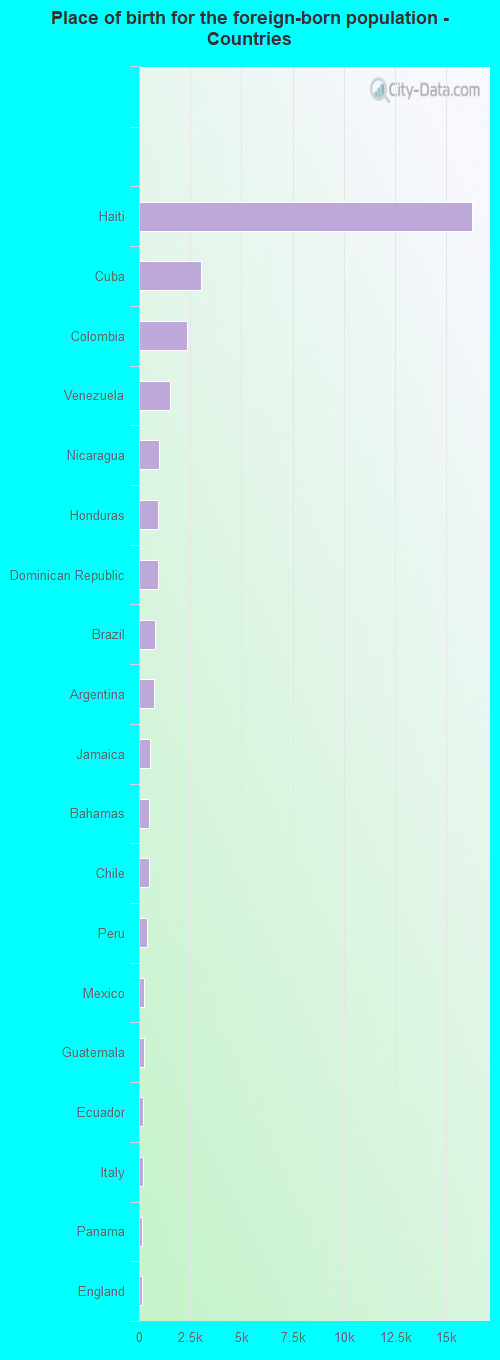
Place of birth for residents in North Miami 31,009 Americas30,880 Latin America21,485 Caribbean6,667 South America2,726 Central America1,111 Europe445 Asia390 Eastern Europe271 Southern Europe240 Northern Europe220 Africa207 Western Europe163 South Eastern Asia136 Western Africa128 Northern America104 Eastern Asia98 South Central Asia80 China77 Western Asia43 Northern Africa34 Southern Africa12 Oceania12 Australia and New Zealand Subregion4 Eastern Africa16,268 Haiti3,050 Cuba2,333 Colombia1,524 Venezuela992 Nicaragua921 Honduras918 Dominican Republic782 Brazil709 Argentina529 Jamaica501 Bahamas470 Chile388 Peru226 Mexico223 Guatemala217 Ecuador181 Italy167 Panama159 England147 Russia136 Nigeria128 Canada107 Uruguay101 France97 Philippines90 India89 Spain87 Costa Rica83 Bulgaria81 Germany67 China63 United Kingdom51 Guyana46 Ukraine42 Malaysia42 El Salvador38 Poland37 Bolivia34 South Africa33 Israel30 Turkey29 Czechoslovakia28 Dominica26 Trinidad and Tobago23 Barbados23 Japan23 Netherlands21 Egypt20 Bosnia and Herzegovina16 Norway14 Morocco13 Vietnam12 Australia12 Taiwan12 Hungary8 St. Lucia8 Cambodia6 Lebanon6 Sudan5 Iraq4 Uganda4 Serbia3 Uzbekistan3 Afghanistan3 Belarus
Grandparents responsible for own grandchildren in North Miami
Grandparents (30 to 59 years) White / Caucasian 49 78.5% Responsible for grandchildren13 21.5% Not responsible for grandchildrenBlack or African American 51 51.9% Responsible for grandchildren48 48.1% Not responsible for grandchildrenTwo or more races 61 100.0% Not responsible for grandchildrenWhite alone, not Hispanic / Latino 15 100.0% Responsible for grandchildrenHispanic or Latino 76 58.8% Responsible for grandchildren53 41.2% Not responsible for grandchildrenGrandparents (60 years and over) White / Caucasian 70 36.5% Responsible for grandchildren122 63.5% Not responsible for grandchildrenBlack or African American 137 15.2% Responsible for grandchildren763 84.8% Not responsible for grandchildrenTwo or more races 171 53.3% Responsible for grandchildren149 46.7% Not responsible for grandchildrenWhite alone, not Hispanic / Latino 18 100.0% Responsible for grandchildrenHispanic or Latino 242 45.7% Responsible for grandchildren287 54.3% Not responsible for grandchildren