Races in North Stanwood, Washington (WA) Detailed Stats
Ancestries, Foreign-born residents, place of birth

Recent posts about races in North Stanwood, Washington on our local forum with over 2,400,000 registered users:
 | moving to Stanwood (4 replies) |
1.7% of North Stanwood, WA residents are foreign-born , which is 777.5% less than the foreign-born rate of 15.0% across the entire state of Washington.
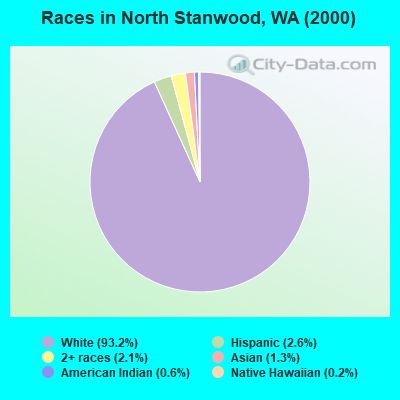
Race distribution in North Stanwood

- 43693.2%White alone
- 122.6%Hispanic
- 102.1%Two or more races
- 61.3%Asian alone
- 30.6%American Indian alone
- 10.2%Native Hawaiian and Other
Pacific Islander alone
2000
2022
-
- 4,652,49078.9%White alone
- 441,5097.5%Hispanic
- 319,4015.4%Asian alone
- 184,6313.1%Black alone
- 175,9263.0%Two or more races
- 85,3961.4%American Indian alone
- 22,7790.4%Native Hawaiian and Other
Pacific Islander alone - 11,9890.2%Other race alone

-
- 4,941,45663.5%White alone
- 1,093,31314.0%Hispanic
- 755,8329.7%Asian alone
- 523,4486.7%Two or more races
- 299,5373.8%Black alone
- 69,0240.9%American Indian alone
- 52,2310.7%Native Hawaiian and Other
Pacific Islander alone - 50,9450.7%Other race alone

Income and house value in North Stanwood
- Median household income in 2022
- $110,432White non-Hispanic householders
- $48,328Two or more races householders
- Median 2022 house value
- $680,300White Non-Hispanic householders
- $850,848Two or more races householders
Household income for White non-Hispanic householders

Household income for Two or more races householders

Foreign-born residents in North Stanwood
8 residents are foreign born
| This city: | 1.7% |
| Washington: | 10.4% |
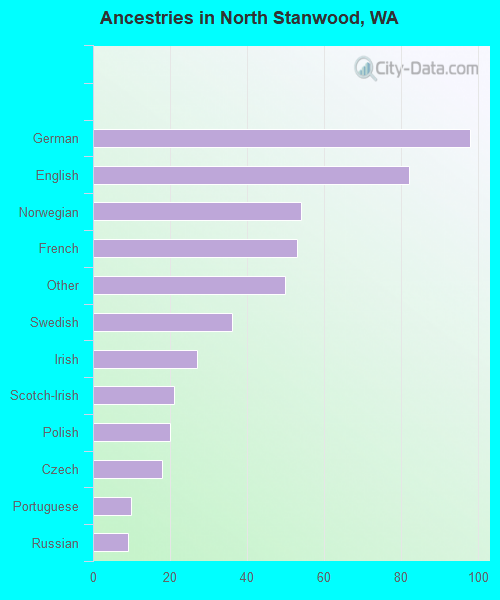
Ancestries in North Stanwood

- 9820.5%German
- 8217.2%English
- 5411.3%Norwegian
- 5311.1%French
- 5010.5%Other
- 367.5%Swedish
- 275.6%Irish
- 214.4%Scotch-Irish
- 204.2%Polish
- 183.8%Czech
- 102.1%Portuguese
- 91.9%Russian
Zip codes: 98292.