Races in North Versailles, Pennsylvania (PA) Detailed Stats
Ancestries, Foreign-born residents, place of birth

Recent posts about races in North Versailles, Pennsylvania on our local forum with over 2,400,000 registered users:

1.6% of North Versailles, PA residents are foreign-born , which is 332.6% less than the foreign-born rate of 7.0% across the entire state of Pennsylvania.
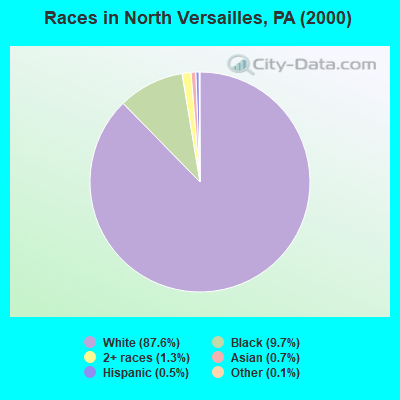
Race distribution in North Versailles

- 9,74787.6%White alone
- 1,0799.7%Black alone
- 1411.3%Two or more races
- 800.7%Asian alone
- 540.5%Hispanic
- 150.1%Other race alone
- 70.06%American Indian alone
- 20.02%Native Hawaiian and Other
Pacific Islander alone
2000
2022
-
- 10,322,45584.1%White alone
- 1,202,4379.8%Black alone
- 394,0883.2%Hispanic
- 218,2961.8%Asian alone
- 113,0970.9%Two or more races
- 13,0860.1%Other race alone
- 14,9040.1%American Indian alone
- 2,6910.02%Native Hawaiian and Other
Pacific Islander alone

-
- 9,487,22873.1%White alone
- 1,311,58110.1%Black alone
- 1,115,9978.6%Hispanic
- 493,9423.8%Two or more races
- 487,1243.8%Asian alone
- 63,5820.5%Other race alone
- 10,1300.08%American Indian alone
- 2,4240.02%Native Hawaiian and Other
Pacific Islander alone

Income and house value in North Versailles
- Median household income in 2022
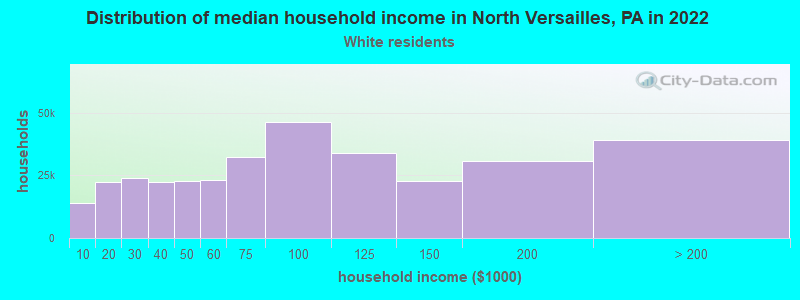
- $59,957White non-Hispanic householders
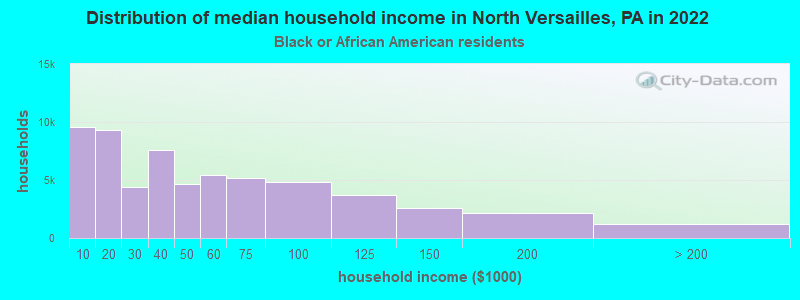
- $39,707Black householders
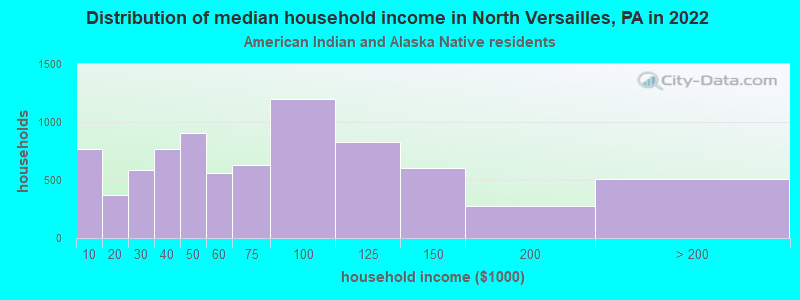
- $42,806American Indian and Alaska Native householders
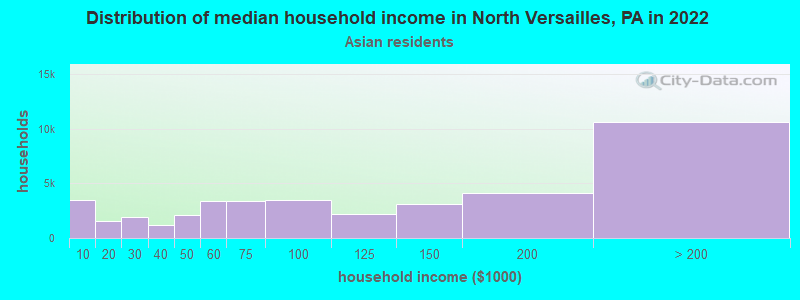
- over $200,000Asian householders
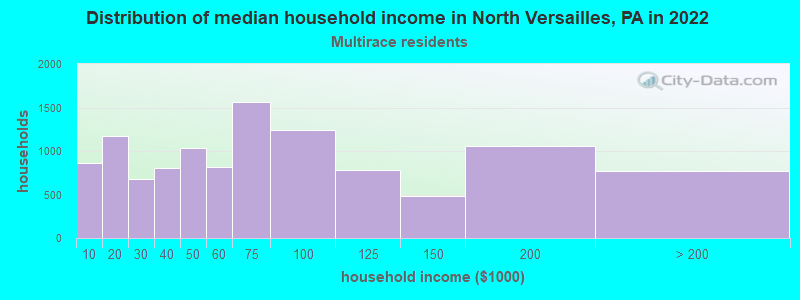
- $29,353Two or more races householders
- Median 2022 house value
- $167,536White Non-Hispanic householders
- $109,920Black or African American householders
- $252,233American Indian or Alaska Native householders
- $278,784Asian householders
- $146,029Two or more races householders
Household income for White non-Hispanic householders
Household income for Black householders
Household income for American Indian and Alaska Native householders
Household income for Asian householders
Household income for Two or more races householders
Foreign-born residents in North Versailles
180 residents are foreign born
| This city: | 1.6% |
| Pennsylvania: | 4.1% |
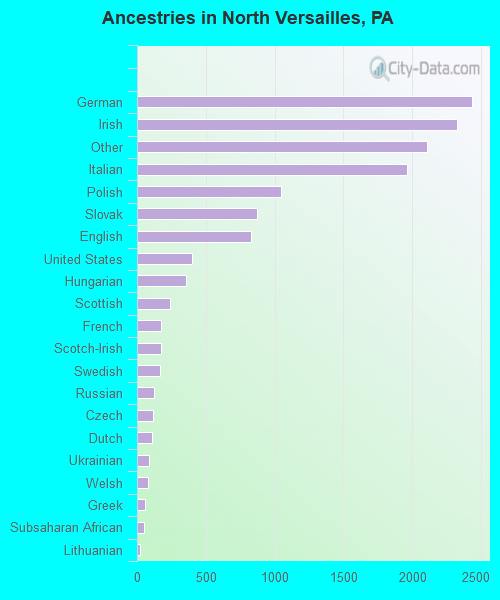
Ancestries in North Versailles

- 2,43617.7%German
- 2,32516.9%Irish
- 2,10715.3%Other
- 1,96114.2%Italian
- 1,0447.6%Polish
- 8756.3%Slovak
- 8326.0%English
- 4002.9%United States
- 3582.6%Hungarian
- 2391.7%Scottish
- 1751.3%French
- 1731.3%Scotch-Irish
- 1651.2%Swedish
- 1210.9%Russian
- 1160.8%Czech
- 1110.8%Dutch
- 890.6%Ukrainian
- 790.6%Welsh
- 580.4%Greek
- 530.4%Subsaharan African
- 230.2%Lithuanian
- 170.1%Norwegian
- 140.1%Arab
- 90.07%French Canadian
- 50.04%Portuguese
Zip codes: 15137.